


Student Performance Analysis Evaluation Score Dashboard




Try Before you Buy Download Free Sample Product
 Impress Your
 Audience
 100%
100% Editable
 Save Hours
 of Time


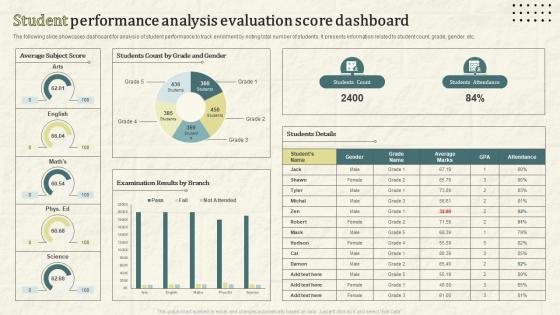
The following slide showcases dashboard for analysis of student performance to track enrolment by noting total number of students. It presents information related to student count, grade, gender, etc.
People who downloaded this PowerPoint presentation also viewed the following :
Student Performance Analysis Evaluation Score Dashboard with all 7 slides:
Use our Student Performance Analysis Evaluation Score Dashboard to effectively help you save your valuable time. They are readymade to fit into any presentation structure.





FAQs for Student Performance Analysis
So first off, you definitely want the basics - GPA, course completion, how often students actually turn stuff in. Attendance matters too, plus how much time they're spending on whatever learning platform you're using. But honestly? The real game-changer is catching problems early. Track things like quiz scores dropping or students missing deadlines - that's your red flag system right there. Participation in discussions is huge too. Oh, and make sure you're looking at demographic data because equity gaps are real. Mix the predictive stuff with final grades so you can actually help before students crash and burn.
Real-time dashboards are honestly game-changers for keeping students hooked. Instead of waiting weeks for grades, they see quiz scores and progress updates instantly. Quick feedback means they can tweak their study methods right away - way more effective than the old system. It's basically like a fitness tracker but for learning (which sounds nerdy but actually works). The visual format makes patterns super obvious too. Struggling kids get spotted faster, while the overachievers stay pushed. Just make sure your dashboard refreshes often and shows stuff students can actually act on, not just random numbers.
Oh yeah, so predictive analytics is basically like having a crystal ball for student dropouts. It tracks all the usual suspects - attendance, grades, how often they're actually engaging with coursework. When someone starts missing classes or their assignment submissions tank, the system flags them as high-risk. Pretty cool tech, honestly. The whole point is catching these warning signs early instead of waiting until they've already mentally checked out. Then you can actually do something about it - maybe they need tutoring, financial help, or just someone to check in. Obviously you've got to act fast once you get those alerts though.
Start with your SIS - that's where all the grade and attendance stuff lives. Then pull in your LMS analytics for the engagement piece, like how much time kids are actually spending on assignments. Assessment platforms are solid too since they're built specifically for tracking progress. But honestly? Attendance is everything. I know it sounds basic, but it predicts pretty much every other outcome. Don't just rely on one source though - you gotta cross-reference all three to get the real picture of what's happening with your students.
Honestly, the dashboard alerts are a game changer - way better than waiting for test scores to tell you a kid's struggling. Set them up to ping you when assignment completion drops or attendance gets spotty. I'd focus on those early warning signs rather than grades since by then it's almost too late, you know? The trend tracking is where it gets really useful though. Like, one missed assignment isn't a big deal, but three in a row? That's your cue. Just make sure you actually have a plan for what to do when the alerts go off - otherwise you're just collecting data for no reason.
Focus on making navigation super intuitive first. Students want clear progress tracking and goal-setting stuff, while teachers need detailed analytics and class overviews. Visual elements are huge - charts, color-coded alerts, anything that isn't boring spreadsheets. The interface should adapt based on who's logged in, showing relevant data automatically. Give students self-reflection prompts and achievement badges (they love that gamification aspect). Teachers need filtering options and export capabilities for sure. Honestly, the whole thing should feel more like checking your phone than using clunky school software. Keep it simple and fast.
Honestly, dashboards are game-changers for figuring out what's actually going on with your students. You'll see their strengths and weak spots in real-time instead of just guessing. I love how you can spot struggling kids right away and group them by skill level - beats the old "wing it" method I used to rely on. Track progress over time too, which helps you figure out what teaching tricks actually work. Oh, and definitely start small - pick your top 3-5 kids who need help most and build intervention plans from there.
So you'll want to tackle three main things: access controls, encryption, and compliance stuff. Role-based permissions are huge - only let the right people see student data. Everything needs to be encrypted when it's stored and when it moves around. FERPA compliance is obviously mandatory, though honestly those regs are such a headache at first. Regular security audits help catch issues early. Oh, and try anonymizing data for analytics when you can - way safer. I'd start with a privacy impact assessment with your IT team to see what gaps you have. Sounds like a lot but breaking it down makes it manageable.
So there's this huge push toward real-time data right now - dashboards pulling live info from your LMS, assessments, attendance, all that stuff. Way better than waiting months for reports. Predictive analytics are getting scary good too, like they'll flag kids who might fail before it actually happens. Oh and most platforms ditched those awful data dumps for actual visual storytelling (thank god). Makes decisions so much easier. I'd definitely look for mobile-responsive ones with custom views - different people need to see different things, you know? The personalized learning paths are pretty cool too.
Definitely track login frequency and how long kids stay in virtual classrooms - that stuff's pretty straightforward to measure. Assignment submission patterns are gold too, along with video attendance and forum posts. The hard part? Figuring out who's actually confused or struggling since you can't see their faces. Oh, and parent access is clutch so they can actually help at home instead of being totally in the dark. I'd start with whatever LMS data you can pull first - way easier than building everything from scratch. Then add the fancier engagement tracking once that's working smoothly.
Set up quick surveys after you push dashboard updates - students will tell you what's broken. Run usability tests with like 5-6 people every few months. Pizza focus groups work great too (seriously, free food gets them talking). Drop a feedback widget right in the interface so they can complain in real-time. Here's the thing though - you've gotta actually tell them what you fixed based on their complaints. Otherwise they'll stop helping you out. Oh, and don't make the surveys too long or nobody will fill them out.
So dashboards let you see in real-time if your students are actually meeting the goals that matter to your school. Track retention, course completion, skill mastery - whatever fits your mission. Think of it like a GPS for education, I guess? Rather than waiting till semester's end to see how things went, you get constant feedback to fix problems early. The trick is nailing down the right metrics upfront. Otherwise you're just staring at pretty charts that don't tell you if your specific students are succeeding or not.
Honestly, accessible dashboards are a game-changer for student engagement. When kids can actually navigate the interface without fighting it, they check their progress way more - we're talking 40-60% more logins. Makes sense, right? You can't engage with data you can't even access. Clear visual hierarchy and mobile optimization matter too. Once students easily track grades and due dates, their academic decisions improve naturally. Oh, and definitely run basic accessibility audits - test it on real student devices, not just your fancy work laptop. The performance gains basically follow from there.
Oh dashboards are actually pretty solid for getting students working together! Start with the peer feedback stuff - that's where you'll see results fast. The shared views let kids see how the whole class is doing (anonymized obviously) and they start comparing strategies. Plus there's this cool feature that basically matches struggling students with ones who get it - natural study groups form. Group projects get way better too since everyone can see who's actually contributing. Honestly the best part might be those discussion threads where students end up teaching each other. Way more effective than I expected it to be!
Look, teachers already have way too many tools thrown at them. Show them upfront how this dashboard actually saves time - like spotting kids who need help faster or tweaking lessons based on real data. Training has to be hands-on, not some boring presentation. Use PLC time so they can mess around with it together. Share wins when someone discovers something that actually helps their students (trust me, word spreads fast). The key is proving it makes their job easier, not harder. Oh, and don't abandon them after rollout - they'll need ongoing support to stick with it.
-
“I really like the convenient operation and professionalism I saw on the SlideTeam website. I want to express my regards and appreciation to the team.”
-
You can rely on SlideTeam whenever you run out of designs for your presentation. Thank you so much SlideTeam!