Have you ever thought about how vital problem-solving is in sales? Well, it’s crucial for dealing with small and big issues. Even if you have an excellent sales team and killer closing skills, things can go south if they’re targeting the wrong customers or spending too much money.
An exciting study found that companies that use sales reports are 28% more likely to meet their sales goals.
Remember what Matt Maher, a Canadian contemporary Christian music (CCM) artist, said: “ To move forward, you have to look back.” That's the same for sales reports—it’s all about learning from the past.
Enhance your business insights with our dynamic Monthly Sales Report Dashboard, a powerful tool that delivers real-time data to drive informed decisions and optimize monthly performance.
What Is a Sales Report?
A sales report, also called a sales analysis report, is a detailed record of all a company’s sales over a certain period. It’s like a snapshot showing sales managers everything about how the business sells its products.
Why should you use a Sales Report Dashboard Template?
- Simplicity and Time-Saving: Templates simplify life and save time by providing an easy way to input information.
- Consistency: Ensures a uniform appearance, making information retrieval quick and straightforward.
- Flexibility in Reporting: Users can employ it for diverse reporting needs, including daily sales activity or annual reports segmented by quarter.
- Customization:This feature lets you make templates specific to your organization’s needs or goals and highlight certain metrics.
Empower your strategic decision-making with our dynamic Annual Sales Report Dashboard, providing comprehensive insights for a successful year ahead.
Recognizing the critical role of sales reports in enhancing sales performance for business growth, we have curated a collection of Top 7 Sales Report Dashboard ready-made PowerPoint Templates. These templates are 100% editable and customizable, eliminating the need to navigate the complexities of creating a sales report template from scratch.
Let’s Dive in!
Template 1: Retail Products Sales Report Dashboard
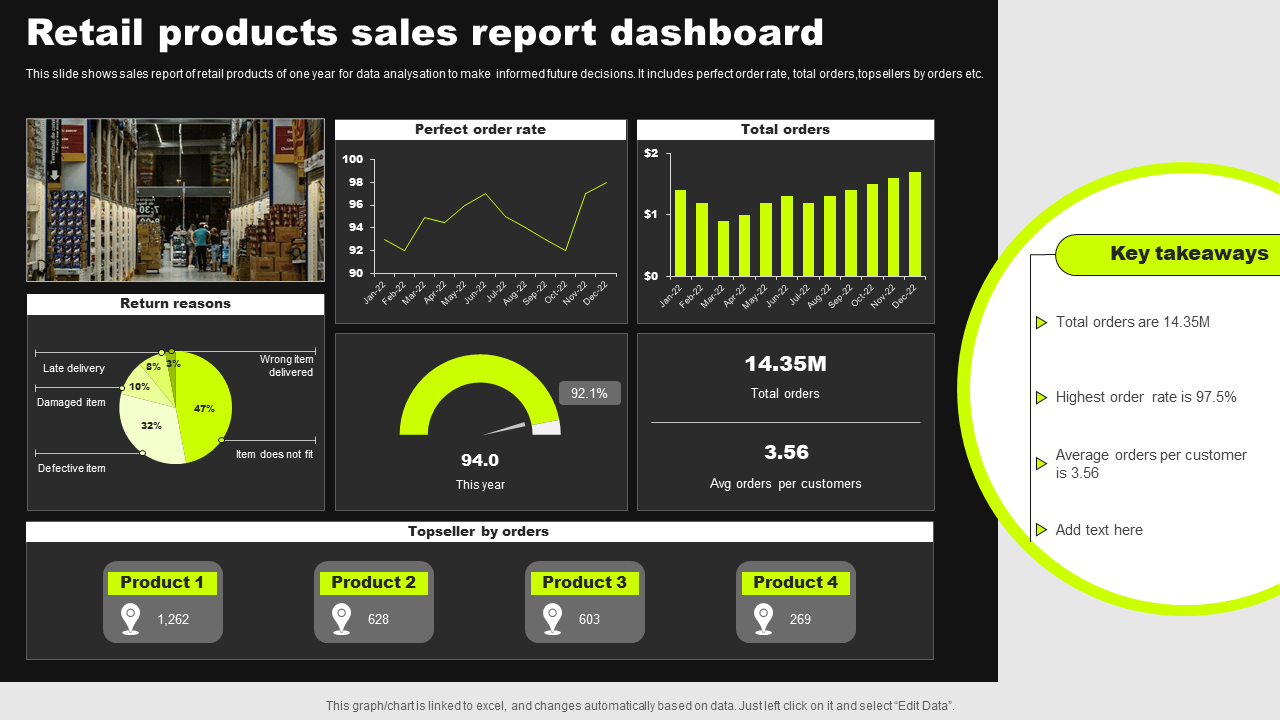
This professional PowerPoint Template is a powerful tool that concisely interprets sales data for analysis and decision-making purposes. Use it to explore retail product data for a specific year, enabling all sales staff, from representatives to executives, to identify trends, make intelligent choices, and contribute to meeting department goals. More extended sales reports, which include metrics such as perfect order rate, total orders, and top sellers by orders, presented in easily readable and understandable bar and graph formats, are valuable for financial reporting, tax filing, and budget-setting within a business.
Template 2: KPI Dashboard to Analyze Company Sales Report
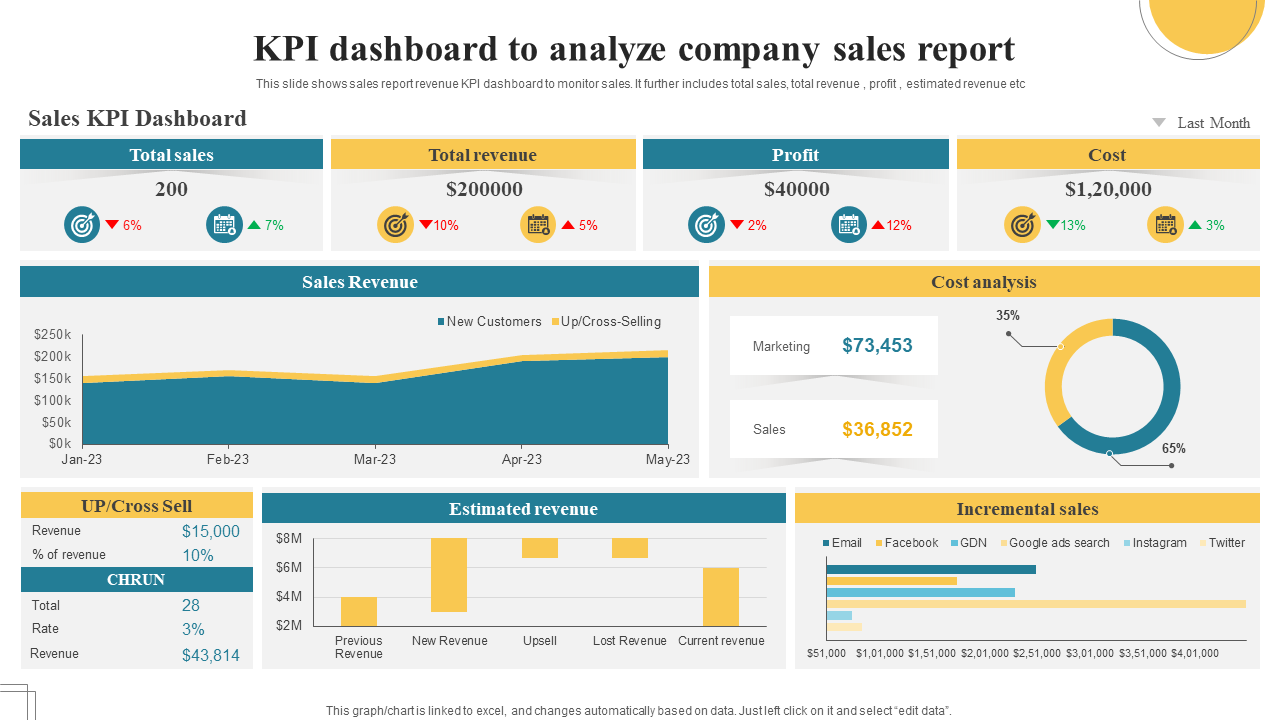
Are you seeking an effortless way to track sales, total revenue, profit, and costs? This PowerPoint template offers a comprehensive solution for monthly sales reports. It features a bar graph illustrating sales revenue, estimated revenue, and incremental sales. Additionally, a pie chart provides a detailed cost analysis, highlighting marketing and sales parameters. Sales leaders and professionals seeking efficient company sales report analysis can utilize this designed KPI dashboard to engage their audience effectively.
Template 3: Product Sales Reporting Dashboard with Revenue
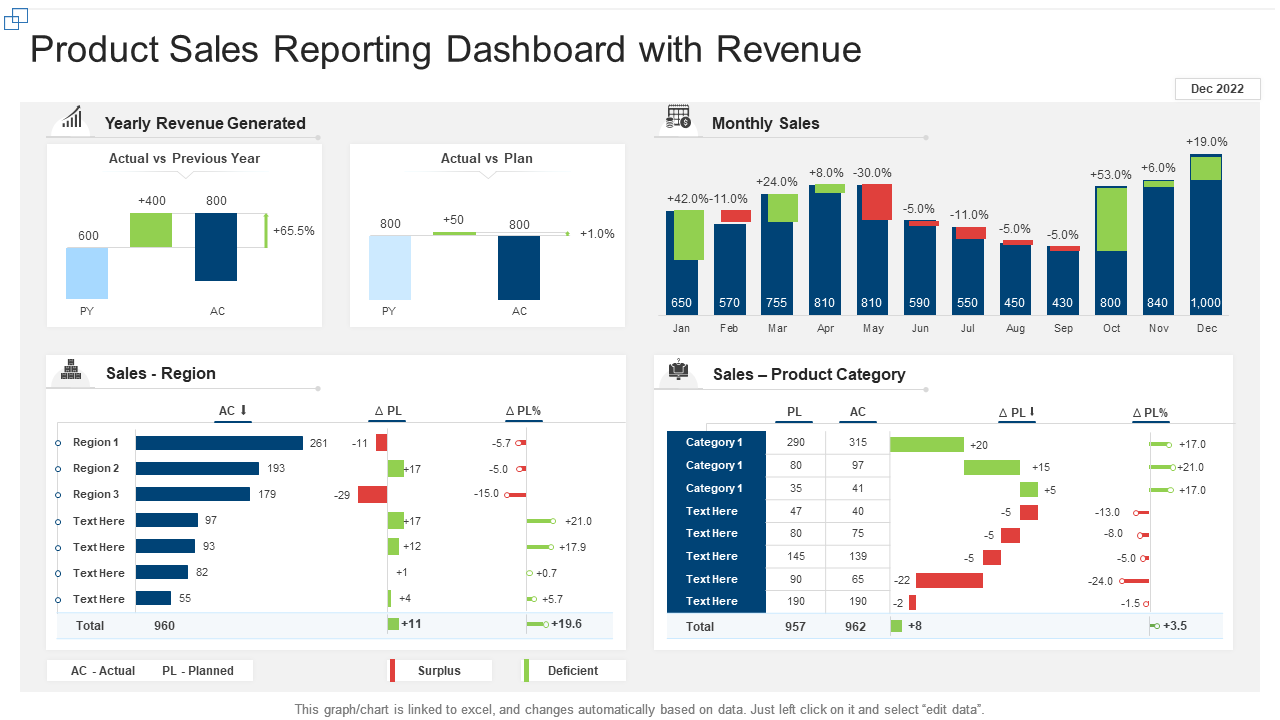
Empower businesses with actionable insights using this interactive PPT Template. It is equipped with a comprehensive suite of features that enable users to track essential performance indicators necessary for Product sales. It incorporates vital information, such as yearly revenue generated for actual versus the previous year, detailed monthly sales analysis, a breakdown of sales by region, and an assessment of product category sales. Use it to effectively compare actual versus planned performance by employing a color-coded system, with red indicating surplus and green denoting deficiencies.
Template 4: Sales Reporting Dashboard with Open Deals
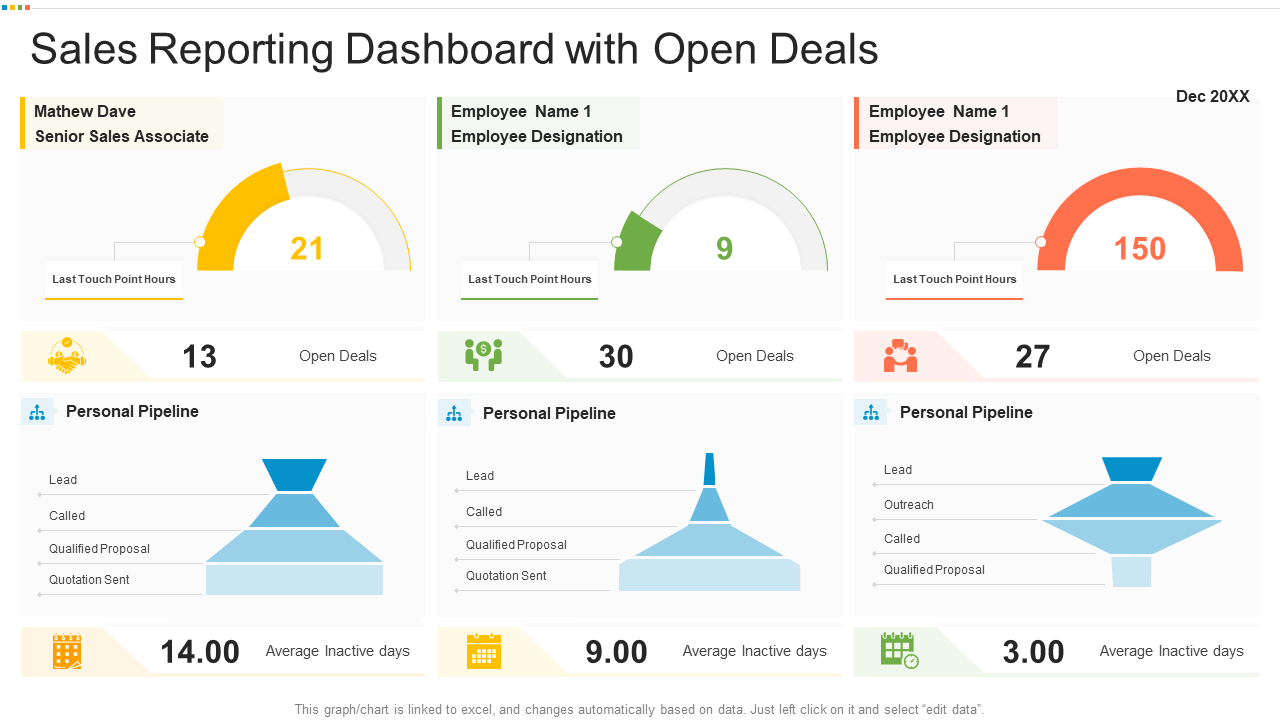
This PPT Slide provides a crucial interface for sales teams, offering real-time insights into ongoing activities. It allows employees to monitor open deals and facilitates a deeper understanding of individual performance. Each employee's name and designation are prominently featured, providing a personalized view of their sales journey. The dashboard includes essential metrics such as the last touch point hours and personal pipeline status, encompassing leads, calls, qualified proposals, and quotations sent to highlight the number of open deals and average inactive days, enabling comprehensive tracking and analysis. This comprehensive approach enhances transparency, collaboration, and informed decision-making, ultimately contributing to more successful deal closures.
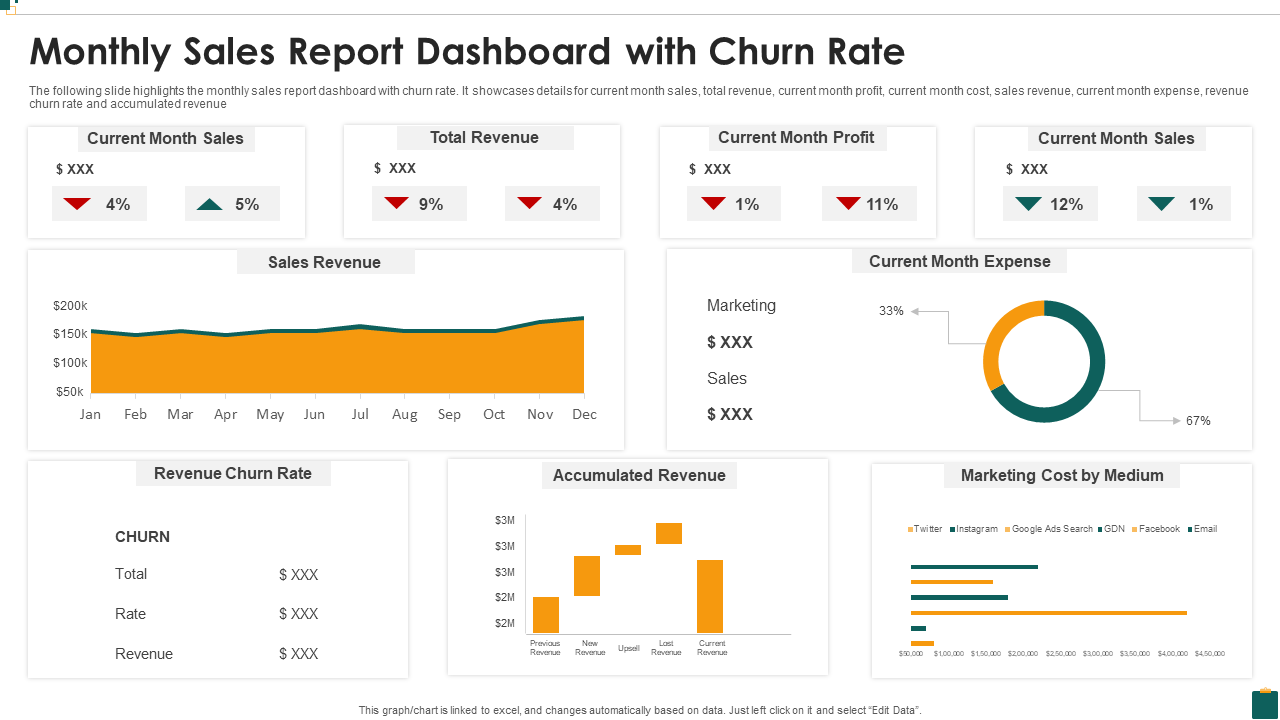
Template 5: Monthly Sales Report Dashboard with Churn Rate
Use this PPT Layout to integrate your business's churn rate effectively into a comprehensive monthly sales report. This template provides a detailed overview of crucial metrics, including current month sales, total revenue, current month profit, current month cost, sales revenue, current month expense, revenue churn rate, and accumulated revenue. This will help to assess your business's financial health and performance. Dynamically present metrics, enhancing understanding of your business's performance and supporting data-driven decision-making.
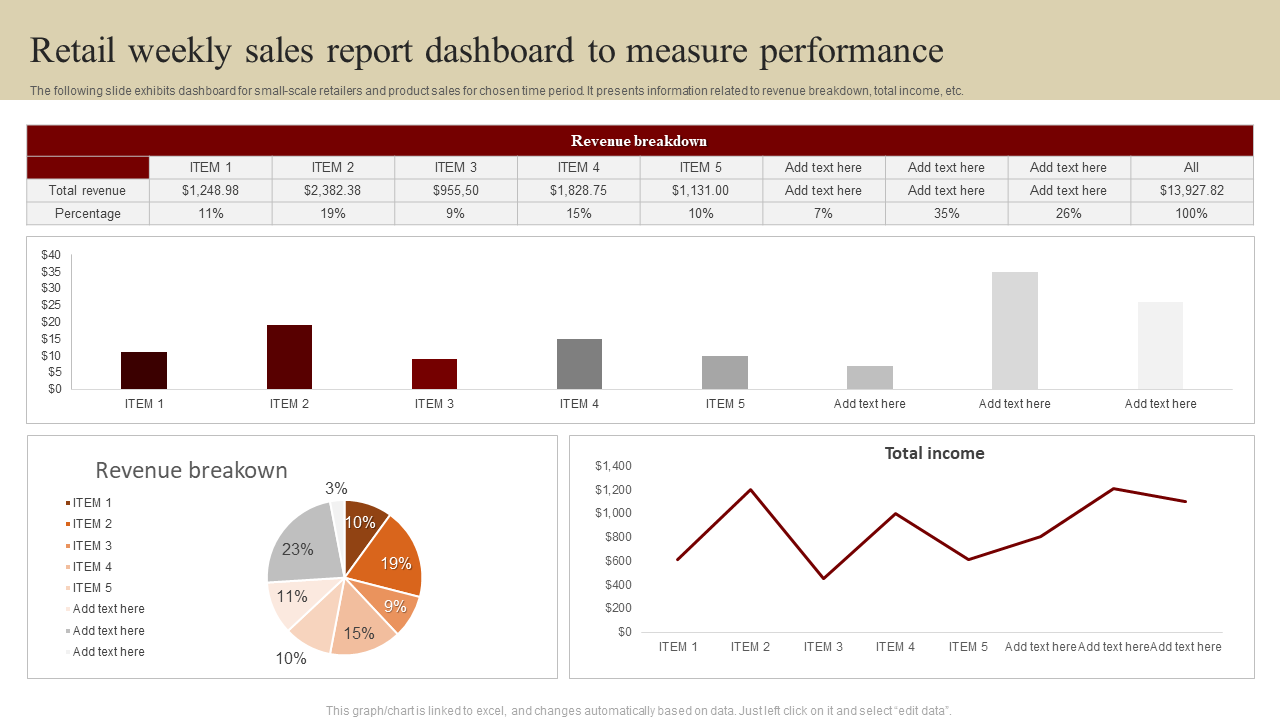
Template 6: Retail Weekly Sales Report Dashboard to Measure Performance
Explore this professional PowerPoint Template created for small-scale retailers seeking to analyze weekly sales performance. The featured slide unveils a meticulously crafted dashboard with key metrics, including a detailed revenue breakdown and total income, offering a holistic overview of retail performance within a selected time frame. This will enable the sales team to monitor transaction numbers and item-specific revenue, determining the necessary number of potential customers to achieve business goals. Grab it Now!
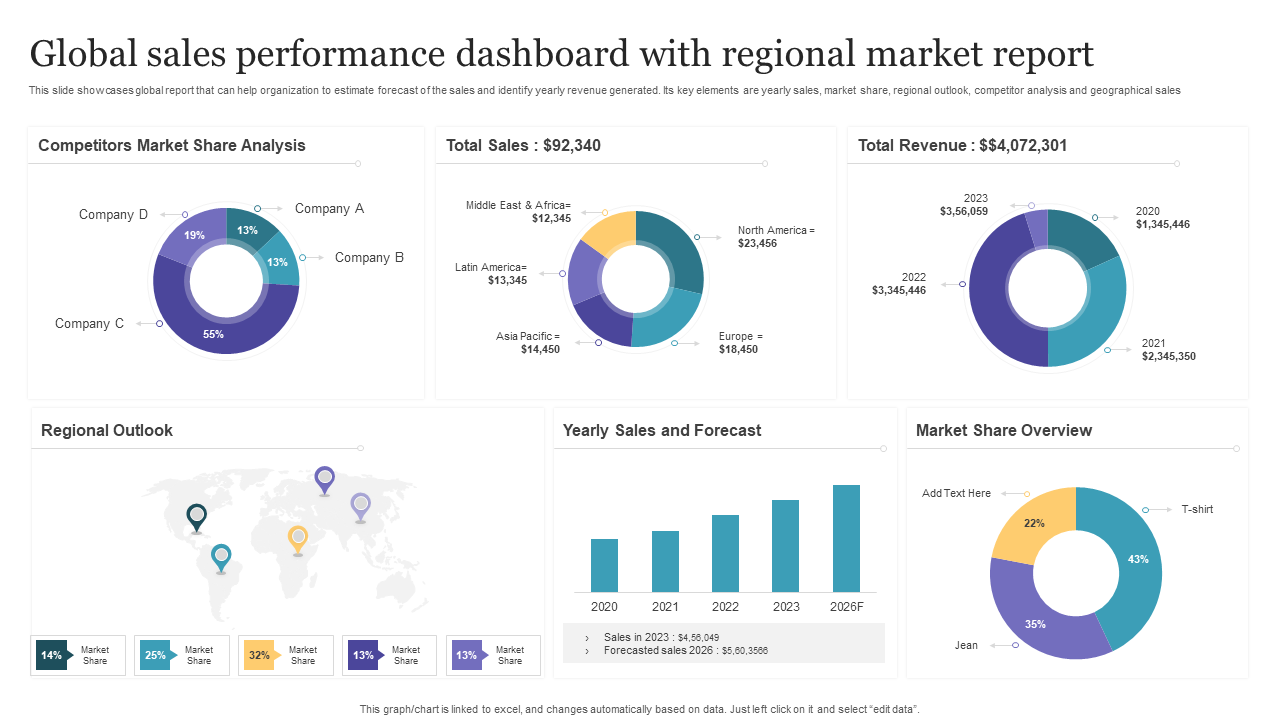
Template 7: Global Sales Performance Dashboard with Regional Market Report
Businesses need to monitor their sales performance and constantly look for methods to improve it. This template makes it easier to estimate sales projections and determine annual revenue produced. It includes essential metrics such as analyzing competitors' market shares for businesses in the same industry, region-by-region tracking of annual revenue, yearly sales and forecasts, regional outlook, and a thorough market share overview. Companies can gain essential insights into their overall success and identify opportunities for improvement by routinely tracking sales performance.
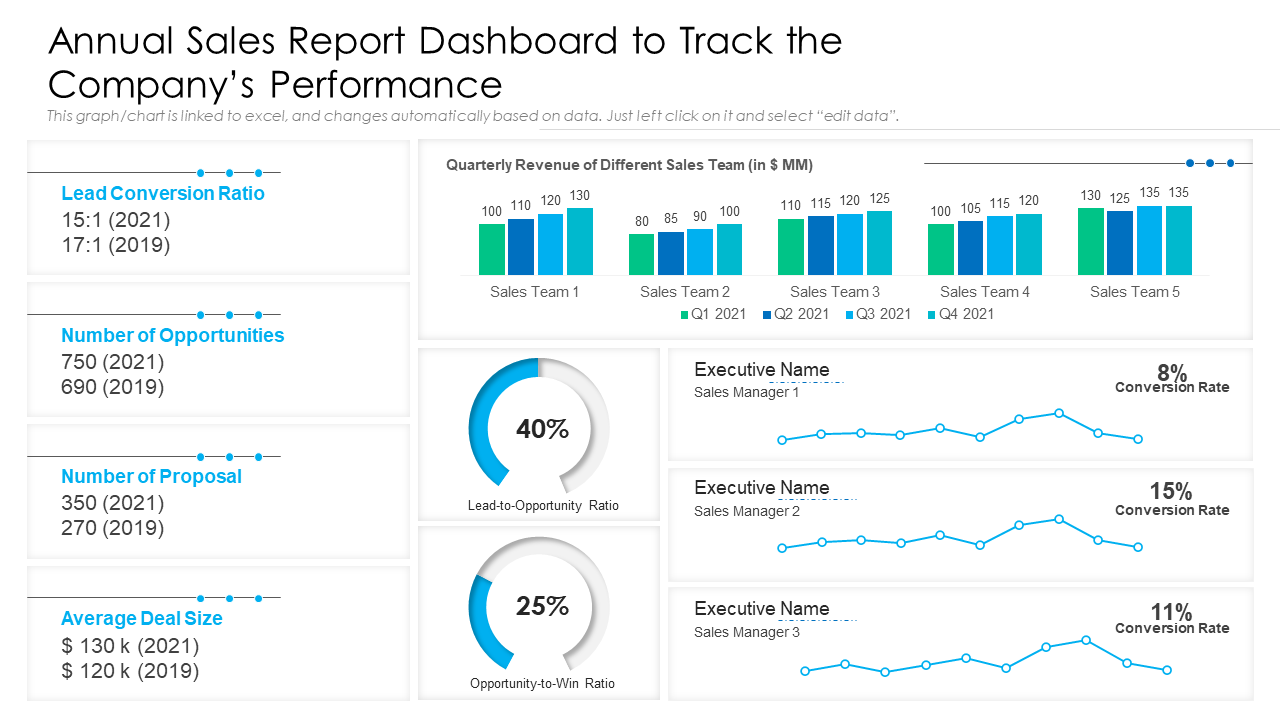
Template 8: Annual Sales Report Dashboard to Track the Company's Performance
This PPT Template offers the optimal solution for assessing your company's financial performance. It includes tracking quarterly revenue for different sales teams, evaluating the conversion rate of each sales manager, and analyzing various metrics such as lead conversion ratio, number of opportunities, number of proposals, and average deal size based on past results. It serves management, stakeholders, employees, and investors, offering accurate insights into the company's financial position. Use this resource to monitor the previous year's activities and sales performance, showcase critical achievements, and effectively plan goals and objectives for the upcoming year. So why wait?
Template 9: Dashboard Snapshot for Annual Sales Report Analysis
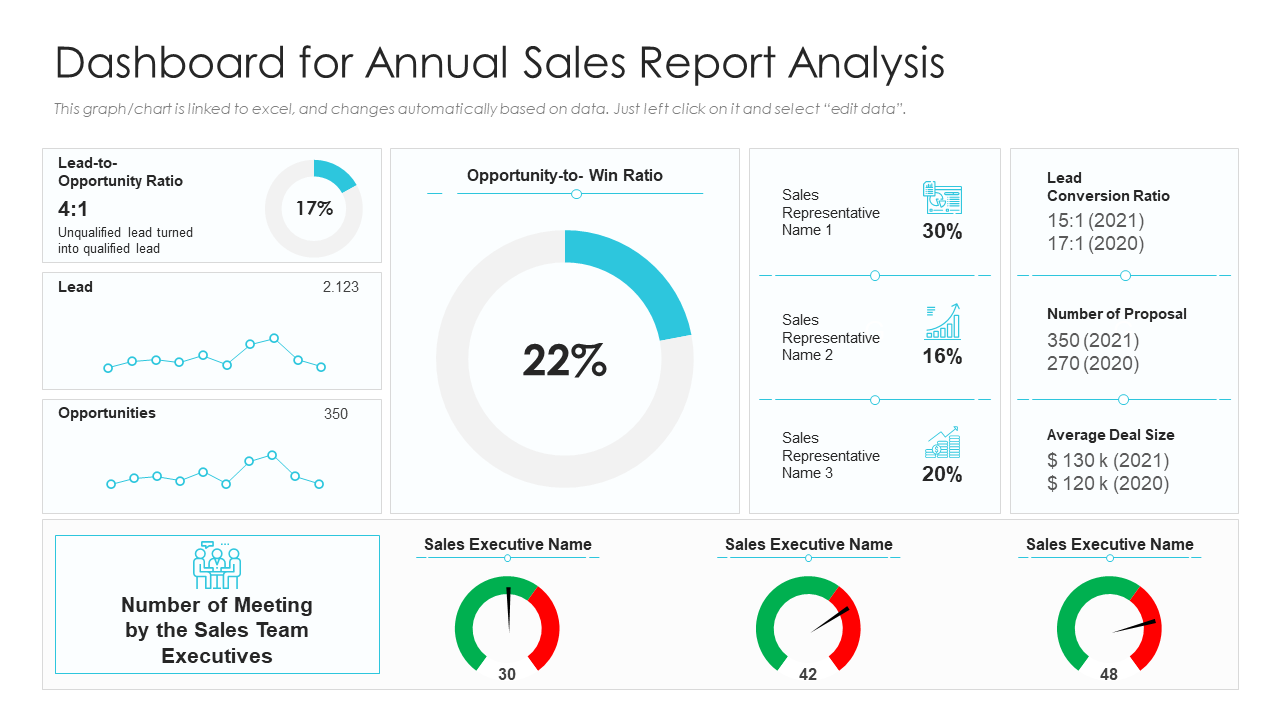
Use this PPT Template to provide accurate and up-to-date data on your company's performance. This will help sales managers make data-driven decisions that contribute to the company's growth. It encompasses crucial metrics such as Opportunity ratio, the number of meetings held by sales team executives, sales representative names, the number of proposals, and average deal size. This will aid in financial tracking and strategic decision-making.
Refine Your Sales Reporting Process
Understand your sales performance through sales report templates to maximize your sales potential. Customize your reports for the audience, employ data visualizations, choose suitable reporting periods, and contextualize the information presented. These templates ensure the inclusion of all relevant categories and present data in a readable format, increasing the possibility that the team will remain involved in tracking and promoting goal success.
PS Anticipate success with our Sales Forecast Dashboard Template, a strategic ally providing accurate insights to empower your business planning and drive future growth.




 Customer Reviews

