

 Customer Reviews
Performance is an accurate indicator of an organization's success and credibility. Apple’s $2.53 trillion market cap places it above Alphabet, Amazon, Microsoft, and other global companies. A company's performance is measured using various criteria (Performance metrics), including revenue, innovative products, management style, customer relationship management, and service quality. These numbers and information, indicative of an organization's performance, competence, and quality, can vary from organization to organization and department to department. Therefore, businesses must assess performance with a predetermined objective, also known as performance metrics or PMs.
Check out our guide to the Annual Performance Report, one of the essential tools for organizational management and business growth.
Performance metrics is a powerful tool to monitor and evaluate business growth. These metrics offer a thorough company analysis to improve strategy and operations.
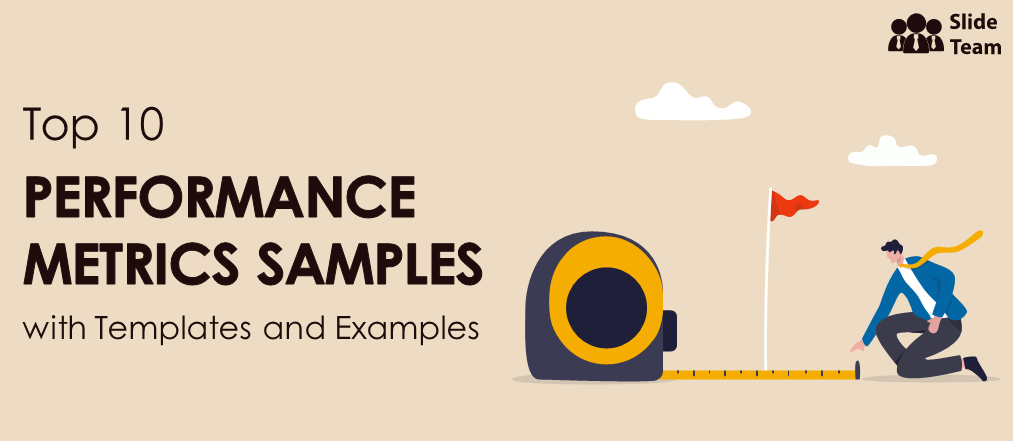
This blog will assist you in monitoring and evaluating the status of a specific business process within your organization. Use them as success markers to map out the outcomes of your business. We at SlideTeam, have compiled a list of the Top 10 Performance Metrics Samples to guide you in mapping your project, department, and program performance. These PPT templates give you access to a broader range of information to improve workflow or organize upcoming projects.
Streamline your evaluation process to depict your business's position in the market. Read more about Growth charts.
The 100% customizable nature of the templates provides you with the desired flexibility to edit your presentations. The content-ready slides give you the much-needed structure.
Fine-tune your business with SlideTeam's top-notch PPT Templates!
Template 1: Human Resources Performance Management Metrics PPT
Do you want to keep track of your company's human capital? Use this PPT Template to assess the effectiveness of all human resources in meeting business objectives. This complete deck includes a performance review, metrics model, the most common HR metrics, employee turnover, profit per employee, revenue per employee, revenue-cost per employee comparison, workforce diversity by gender, staff with professional qualifications, competency rating, and many other features to assist you in creating a qualitative review of the employees. Track critical areas in HR metrics to better understand employee absenteeism and identify areas for improvement. With this download, learn the specifics of employee evaluation. Save it now!

Template 2: Customer Satisfaction and Performance Metrics PPT
Customer satisfaction metrics are crucial for your company. Use this PPT Template to evaluate customer interaction to raise revenue and profitability. This comprehensive deck includes the steps in analyzing customer responses, such as elevate, suggest, inquire, and reflect. This Slide helps track your company's performance in terms of lead conversion rate, customer retention rate, and timely delivery. Employ it as a guideline to improve overall CX and satisfaction levels. Save it now!

Template 3: Finance Operational Performance Metrics PPT
Use this PPT Template to evaluate your business's financial and operational strength. This Template is ideal for analyzing the total sales, sales growth, profit margins, and gross profit to propel business growth and financial health. It includes key performance indicators (KPIs) such as operating cash flow, return on investment, and return on assets, as well as debt-equity ratio, return on equity, and others, to better understand the business performance. This Slide is perfect for financial analysts, CEOs, team leaders, and others who need to make data-driven decisions. With this download, you can gain strategic insights into cash management that will help your business's operational efficiency. Download now!

Template 4: Product Operational Performance Metrics Template
Use this PPT Template to evaluate various products' sales performance and profitability. This Slide is significant for determining product success and making better product decisions. The infographics depict the product development ratio, product sales breakdown, and product monitoring to understand customer behavior and expectations better. The PowerPoint Presentation includes graphics intended to support the launch of a new product while providing you with helpful information. Make a product roadmap to increase ROI with this download. Download now!

Template 5: Business Key Performance Metrics Review Dashboard Template
Use this PPT Template to keep track of your company's operational capabilities. The Slide depicts a sales strategy review dashboard for understanding gross profit, sales by month, revenue growth, and new customer additions. It is an excellent tool for marketing and sales to assess the current status of a specific project or process. This download will initiate improvement measures and allocate resources to achieve key targets and objectives. Employ it to get a comprehensive picture of your company's day-to-day operations. Get it now!

Template 6: Organization Operational Performance Metrics PPT
Want to maintain your edge in the market? Use this PPT Template to assess the efficiency of your company's operations. It shows tabular metrics with colorful icons representing critical, moderate, and healthy operational performance. Use it to evaluate site operations, critical processes, and product development. It is a fantastic tool for tracking your company's general effectiveness and productivity. Employ this presentation to identify problems and root causes to plan for optimal operations. Get it right away!

Template 7: Employee Operational Performance Metrics PPT
Human resources are any organization's most valuable asset. Use this PPT Template to learn more about your employees' efficiency. This Template is essential for reviewing employee operational performance to understand its impact on revenue, profitability, and customer satisfaction. It depicts a performance dashboard with multicolored graphics and data on sales, operations, and vision corporations. It benefits sales teams, HR managers, and corporate trainers. Use this download to keep tabs on employees and inspire them to grow professionally and personally. Save it right away!

Template 8: Regional Sales Performance Metrics Dashboard Template
Sales performance is a crucial indicator of business success. Use this PPT Template to demonstrate regional sales performance. It includes metrics to evaluate total sales, revenue, sales by month, and regional sales growth. The Slide offers a graphical representation of the sales data to provide insightful sales reports and analyses for every region. It is helpful to track the team's conversion rate and provide feedback on the sales process. With this download, you can create a flawless sales performance management process. Get it now!

Template 9: Rebranding Performance Metrics PPT
Use this PPT Template to assess the effectiveness of your brand's performance. KPIs for understanding leads, conversions, and sales revenue are included in this PPT Design. It is an essential tool for explaining the rebranding process to attract new clients and simplify brand positioning. Employ the infographic to establish a brand value benchmark. Get it now!

Template 10: HR Dashboard Recruitment Performance Metrics Template
Use this PPT Template to demonstrate your company's hiring process. This recruitment dashboard is ideal for tracking HR reports and hiring analytics. It offers data-driven insights into the recruitment funnel, focusing on employee churn rate, open positions by department, and so on. Employ the presentation to develop new talent acquisition strategies to benefit the company. Download now!

*******
The full report card.
Performance metrics are critical for making informed business decisions and taking appropriate, timely action. These potent tools monitor the effectiveness of various projects, departments, and businesses. Use SlideTeam's PPT templates to gain knowledge and enhance business performance using the appropriate KPIs.
PS: Explore our guide on powerful analytics and data visualization tools to build your performance dashboard.
FAQs ON PERFORMANCE METRICS
1. What are the examples of metrics?
Metrics are data sets used to assess or monitor performance. It is essential for businesses because it accurately represents performance in numbers or statistics.
Example:
a) Performance metrics
b) Finance metrics
c) Employee performance metrics
d) HR metrics are used to track and measure the human resources department in an organization. Businesses can use it to analyze cost per hire, revenue per employee, absenteeism, early turnover, and other factors. This is critical for improving the hiring process to maximize business productivity and efficacy.·
2. What are the basic types of performance metrics?
Performance metrics provide data for tracking business processes. The data helps promote business change and improvement.
The following are some examples of critical performance metrics:
a) Business performance metrics monitor and evaluate specific processes within a company compared to established benchmarks. The data is used to assess sales and marketing operations for businesses to succeed.
b) Sales performance metrics aid in measuring the sales performance of a company's products or services. It includes key performance indicators (KPIs) for tracking sales, lead generation, and retention.
c) Project management performance metrics assess a project's success and profitability. It is helpful to track the progress of a project and make changes as needed.
d) Employee performance metrics assess a company's employees' productivity and efficiency. It is beneficial to contribute to employees' personal and professional development.
3. What are the five key performance indicators?
The five key performance indicators are as follows:
a) NPM (Net Profit Margin): It displays a company's revenue and profit performance over a given period, excluding costs, interest, and taxes.
b) Customer Retention Rate (CRR) reflects the number of customers that a company can retain.
c) Human Capital Value Added (HCVA) measures employees' contributions to the business.
d) Market Growth Rate (MGR) provides an accurate market summary to assist businesses in planning future projects.
e) Return on Investment (ROI) evaluates a project to assist businesses in comprehending the monetary benefits.


![Top 10 Daily Status Report Templates to Document Your Performance [Free PDF Attached]](https://www.slideteam.net/wp/wp-content/uploads/2022/06/Top-10-Daily-Status-Report-Templates_1-1013x441.png)