


Finance operational performance metrics ppt daigram




Try Before you Buy Download Free Sample Product
 Impress Your
 Audience
 100%
100% Editable
 Save Hours
 of Time


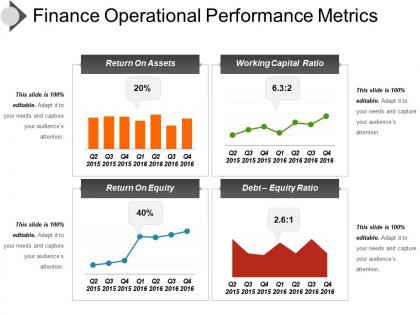
Manage your business finances with our finance operational performance metrics PPT diagram. This financial metrics PPT layout will help in analyzing your financials which helps in measuring your company’s overall performance. It further helps in taking adequate business decisions on the basis of its financial capability. The financial metrics which also helps in measuring your business financial health are operating cash flow, return on investment, and return on assets, debt equity ratio, return on equity and more. Use this business performance dashboard PPT diagram to take imperative investment and business decisions which results in bringing more gains to your company. You can define the importance of measuring your financial performance with this operating performance ratio PowerPoint slide template. Such as it helps in improving your management efficiency, it also helps in motivating your employees to work with more adequacy and efficiency. Thus, click on the Download link now to explore more with this professionally designed PPT design. Discredit irrational ideas with our Finance Operational Performance Metrics Ppt Daigram. Explain the elements that appear illogical.
People who downloaded this PowerPoint presentation also viewed the following :
Finance operational performance metrics ppt daigram with all 5 slides:
Congratulate the jubilant with our Finance Operational Performance Metrics Ppt Daigram. Felicitate them for their achievement.


FAQs for Finance operational performance
So ROI, EBITDA, and cash flow are your big three. Cash flow's honestly the most critical - doesn't matter how profitable you look on paper if you can't cover payroll, right? ROI shows whether your investments actually make sense, and EBITDA cuts through all the accounting BS to show real operational profit. Working capital and debt-to-equity ratios are solid too if you want the full health picture. But seriously, don't go overboard with metrics. Pick maybe 3-4 that actually fit your business and stick with those consistently.
Check your cash daily and do weekly forecasts - seriously, most finance teams slack on this and then panic when things get tight. Track your cash conversion cycle, days sales outstanding, and when payments actually hit. Set up dashboards showing actual vs projected flows so you catch problems early. The real game-changer is automating feeds from your AR/AP systems instead of doing manual updates (trust me on this one). Start with 13-week rolling forecasts updated weekly - gives you enough time to make smart moves before you're scrambling for cash.
Look, ROI and ROE are like your go-to metrics for figuring out if you're actually making decent money or just spinning your wheels. ROI shows how much profit you're squeezing out of any investment - super useful for comparing different projects. ROE is more about shareholder returns specifically. Honestly, I think they're way more helpful when you compare them to your competitors rather than just looking at the raw numbers. Also check them over time to spot trends. Oh and don't ignore your operational stuff either - profits look great until you realize you're hemorrhaging cash elsewhere.
So variance analysis is basically your detective tool - compare what actually happened vs what you budgeted. I'd start with the big ones first, like anything over 5-10%. Look at where costs went crazy, revenue tanked, or processes got sluggish (AP cycles, collections, etc). Here's the thing though - most people stop at spotting the variance. Don't do that. Dig deeper into WHY it happened. Maybe you're short-staffed or missing those early payment discounts. Monthly reports on your top 5 KPIs should do the trick.
Look, dashboards are a game changer - you get instant access to your key finance numbers instead of hunting through endless spreadsheets. When something's off, you'll catch it right away rather than finding out weeks later when it's already a mess. Honestly? Executives eat up those visual charts, so presenting becomes way less stressful. You can customize different views too - CFO gets the big picture stuff while your team sees the nitty-gritty details they actually need. Set up alerts for the critical numbers so you're not babysitting everything 24/7.
So most companies use Bloomberg or S&P Capital IQ to grab peer data - industry reports work too but they're usually less current. Focus on the big ratios: ROE, margins, debt-to-equity, working capital stuff. Pull it quarterly and set up dashboards showing your percentile ranking. Here's the annoying part though - finding actual comparable companies is way harder than it sounds. Size and business model matter more than just being in the same industry. I'd start with maybe 8-10 direct competitors, then add more for context. Geography's huge too if you're not purely digital.
Honestly, reporting frequency is huge for catching problems early. Think of it like checking your bank account - do it quarterly and you'll miss the slow leak that empties your wallet. Daily/weekly reports let you pivot fast when cash flow tanks or customers start bailing. That said, some stuff just doesn't change much day-to-day, so you're just creating busy work. I'd focus on maybe 3-5 metrics that actually matter for your business. Match how often you check them to how quickly they can go sideways - volatile stuff needs constant watching.
So if you're just starting out, track your burn rate and runway - that's literally life or death stuff. Customer acquisition cost matters too since you can't just throw money at growth forever. Revenue growth is obviously huge because investors go crazy for those hockey stick charts. Once you're established though? Totally different game. Focus on EBITDA, return on assets, working capital efficiency. You're past the survival phase and into making things actually profitable. Here's the thing - don't get sucked into vanity metrics that make you feel good but mean nothing. Pick maybe 3-5 metrics for where you're at and actually obsess over those. Otherwise you'll just drown in spreadsheets.
So basically, non-financial metrics show you the story behind your numbers. Like when customer complaints start piling up before your revenue actually tanks - that's your early warning system right there. Employee turnover rates, customer satisfaction scores, operational stuff... they all predict what's coming instead of just telling you what already went down. Financial metrics are great for knowing if you're winning, but honestly? The non-financial ones tell you if you can keep winning. I'd grab maybe 3-5 of these KPIs and track them with your regular financial dashboard. Way easier to fix problems when you see them coming.
Honestly, the worst part is your data will be a mess and your old systems won't play nice together. Like trying to sync a flip phone with your car's Bluetooth - just painful. Finance teams hate change too, especially when they're used to doing everything manually. They get nervous about automation taking over their spreadsheets. Change management is huge because nobody trusts reports they didn't build themselves. Oh, and executives always lowball the time and money it takes. My advice? Pick one small area first, prove it works, then expand from there.
Look, predictive analytics is basically your financial crystal ball - though obviously not perfect! Instead of just seeing what already happened, you can actually forecast stuff before it hits. Cash flow problems? You'll spot them early. Customers about to default? Same thing. The real game-changer is catching trends in operational costs that aren't obvious yet. Honestly, it's like having an early warning system for your business. You can pivot strategies before small issues turn into disasters and allocate resources based on what's coming, not what's done. My advice? Pick one metric you already track religiously and start building models around that first.
You know that game of telephone where the message gets totally twisted by the end? Same thing happens with metrics when teams define stuff differently. Sales calculates "customer acquisition cost" one way, marketing does it completely different - then you're stuck in meetings watching VPs argue over numbers that don't even match up. Super awkward. Make sure everyone's using the same formulas and timeframes, otherwise your data tells like three different stories. I'd write down your main definitions first, then get department heads to actually agree on them. Trust me, it'll save you so many headaches later.
Yeah, regulatory changes can totally flip your metrics game upside down - sometimes literally overnight. New compliance rules might force you to track certain KPIs while making others pretty much useless. Calculation methods for stuff like capital ratios get tweaked constantly too, which is annoying. The timing never works out either - regulators don't care about your reporting schedule. I'd build measurement systems that can actually bend without breaking when rules change. Oh, and definitely stay on top of regulatory updates. Maybe stress-test your current metrics against what's coming down the pipeline? It's honestly just constant adaptation at this point.
Start with automated checks that catch weird data or outliers - seriously saves so much headache later. Monthly reconciliations between your systems are boring as hell but totally necessary. Get someone to own each metric, like actually be responsible for it being right. Document how you calculate everything so people aren't making up their own formulas. I'd honestly audit what you're doing now first to see where things usually go wrong. Oh, and use the same validation rules across everything - consistency matters way more than perfection.
Think of metrics as your business fortune teller - they'll show you what's coming down the pipeline. Historical data helps you set budgets that actually make sense and catch cash flow problems early. Revenue per employee and margin trends? That's where the good stuff is. You can run "what if" scenarios too, like what happens if sales tank 15%. Honestly, most people track way too many things. Pick 5-7 metrics that actually matter for your business and stick with them. Build those dashboards now so you're not scrambling when planning season hits next year.
-
Excellent products for quick understanding.
-
Perfect template with attractive color combination.