


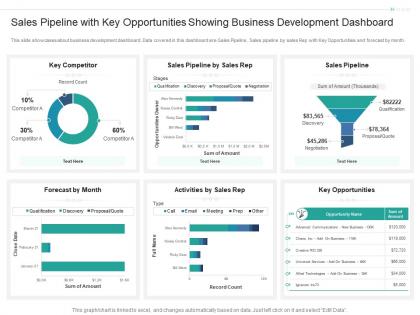
Sales pipeline with key opportunities showing business development dashboard


Try Before you Buy Download Free Sample Product
 Impress Your
 Audience
Editable
of Time


Our Sales Pipeline With Key Opportunities Showing Business Development Dashboard are topically designed to provide an attractive backdrop to any subject. Use them to look like a presentation pro.
People who downloaded this PowerPoint presentation also viewed the following :
Sales pipeline with key opportunities showing business development dashboard with all 2 slides:
Use our Sales Pipeline With Key Opportunities Showing Business Development Dashboard to effectively help you save your valuable time. They are readymade to fit into any presentation structure.

FAQs for Sales pipeline with key opportunities showing
So definitely track your deal stages with conversion rates, plus total pipeline value and average deal size. How long deals take to close at each stage is critical too. Lead sources are clutch - you need to know what's actually bringing in business. I always think comparing sales rep performance is underrated for spotting who needs help. Oh and forecast accuracy versus what actually happens, that one stings but it's necessary. Make everything visual with charts and colors so patterns jump out at you. Start simple though - once people use it regularly, then you can get fancy with more metrics.
Honestly, visual dashboards are a game changer for pipeline stuff. You can actually see what's happening instead of drowning in spreadsheet hell. Bottlenecks jump right out at you, conversion rates by stage become obvious, and you'll catch patterns like deals consistently dying at the demo phase. I used to waste so much time digging through raw numbers trying to find problems. Now seasonal trends pop up immediately, and you can spot which deals are just sitting there stalling. The trick is building charts that answer your actual questions - way better than those boring traditional reports nobody reads anyway.
Look, I'd focus on three main things: conversion rates between stages, how long deals sit in each stage, and lead volume. Conversion rates show you exactly where things are breaking down - like if your demo-to-proposal rate sucks, that's where to dig in. Time tracking catches bottlenecks before they kill your quarter. Volume helps you actually forecast instead of just guessing. Most sales dashboards are honestly a mess of random metrics that look impressive but don't help you fix anything. Get these basics working first, then worry about deal values and source tracking later.
Here's how I'd tackle it - first figure out your actual sales stages, then make the dashboard match that. Real estate folks might need "under contract" and "closing" stages. SaaS companies? More like "demo scheduled" or "trial started." Most tools let you customize fields and stage names pretty easily. Generic templates look nice but they're honestly kind of useless if they don't fit how you actually sell. I'd skip the fancy stuff at first - just map out your real process on paper, then build the dashboard around that workflow instead of forcing your team into someone else's idea of sales stages.
Honestly, real-time data is a game changer because you catch problems while you can still fix them. Instead of staring at terrible quarterly numbers wondering what went wrong, you'll see conversion rates tanking and can jump on it immediately. I've seen too many teams miss obvious red flags just because they were looking at last month's reports. When something's working, double down fast. Struggling reps? Coach them now, not later. Hot leads need attention right away. Just set up alerts for your most important metrics so you're not constantly checking dashboards like some kind of data zombie.
Look, historical data is what makes your forecasting actually work instead of being total guesswork. Your system learns real patterns from past quarters - seasonal drops, closure rates, how long deals typically drag on. I've seen people try to eyeball this stuff and miss obvious trends. More good data = better predictions about which deals will actually close. You'll want at least a year of clean sales records uploaded to start seeing real improvements. Oh and make sure the data isn't messy or you're basically teaching it wrong habits from day one.
Honestly, Salesforce and HubSpot are your best bet if you want everything integrated - CRM plus pipeline visuals all in one place. Tableau's amazing for custom stuff, though it'll take you a minute to figure out. Power BI's solid too but similar learning curve. I've been obsessed with Tableau lately, their charts are weirdly satisfying to build. Pipedrive and Monday.com work great if you don't need anything fancy. Start with what numbers you actually care about tracking, then find whatever shows those the clearest. Don't overthink it.
Oh yeah, automated alerts are a game changer! Set them up for when deals get stuck in one stage too long or when follow-ups are overdue. Most tools let you pick thresholds - like if your monthly pipeline dips below target. I'm obsessed with getting Slack notifications for hot leads that need quick action. Weekly email summaries work great too. Honestly though, don't go crazy with alerts or you'll hate your phone. Start with maybe 2-3 really important ones first, then add more if needed. Way better than constantly checking your dashboard!
Keep it simple - don't throw every metric you can think of on there. Revenue's great but you need the early warning signs too, like lead quality and conversion rates. That way your team can catch issues before they become disasters. Color-wise, less is more (I've seen some truly hideous dashboards that hurt to look at). Focus on showing trends instead of just random numbers sitting there. Oh and make sure it actually updates regularly - stale data is basically useless when you're trying to make real decisions.
Dude, having everyone work together on the same dashboard is a game changer. Your data stays fresh since people update stuff in real-time. No more guessing what's actually happening with deals. The team can spot trends together - like who needs help or what's working best. Managers can jump in early when things look sketchy too. Way better than those messy spreadsheet days where everyone was flying blind. Oh, and definitely do regular dashboard check-ins with your team. Builds the habit, you know?
Honestly, your dashboard will show you exactly where people are getting stuck. Look at conversion rates between pipeline stages - that's where the magic happens. If Sarah's crushing it with lead gen but can't close anything, boom, she needs negotiation training. Mike takes three weeks to go from demo to proposal? Time management issues right there. I always compare struggling reps to my top performers first - saves me from guessing what's actually wrong. Way better than those boring company-wide training sessions that put everyone to sleep. The patterns become super obvious once you start digging into the numbers.
Honestly, having your sales dashboard on mobile changes everything. You can check deal progress between meetings or update stuff right from client sites. No more sprinting back to your desk when something urgent pops up. Real-time updates mean you won't miss anything that could mess with your quarterly goals - trust me on this one. During client conversations, you can actually pull up metrics on the spot to back up your decisions. Oh, and definitely set up notifications for your biggest deals. You'll thank yourself later when you catch something important while you're out grabbing coffee.
Honestly, pipeline dashboards are game-changers for this stuff. You get shared visibility so marketing can actually see what happens to their leads instead of just hearing "they suck." Like you can show them "your campaign leads fly through discovery but crash and burn in negotiations" - way more helpful than vague feedback. Both teams start spotting patterns in real-time: which content works, what lead sources convert best at different stages. Marketing can tweak their targeting when they see how segments perform. Oh and definitely do weekly reviews with the dashboard data - sounds boring but it actually works. Your alignment will get so much better.
Honestly, tracking where deals die in your pipeline is a game-changer. You'll start noticing patterns - like everyone bails after demos or when you mention price. Pretty eye-opening stuff. The data tells you if it's a training thing, your messaging sucks, or maybe pricing needs work. Also shows which lead sources actually convert at each step (spoiler: some are way better than others). I'd focus on whatever stage converts worst week-over-week first. That's where you'll probably see the biggest improvement.
I'd say weekly minimum, but the teams that crush it do quick daily check-ins too. Daily stuff keeps urgent deals from slipping through the cracks. Weekly lets you catch trends before they bite you in the ass. Oh, and don't skip monthly deep dives - that's where you'll spot the bigger patterns. Honestly though, consistency matters more than the exact schedule. Start weekly and adjust based on how fast your deals usually move. Some industries need daily attention, others can get away with less frequent check-ins.
-
Easy to edit slides with easy to understand instructions.
-
Excellent products for quick understanding.