

Project Management Dashboard With KPIs




Try Before you Buy Download Free Sample Product
 Impress Your
 Audience
 100%
100% Editable
 Save Hours
 of Time


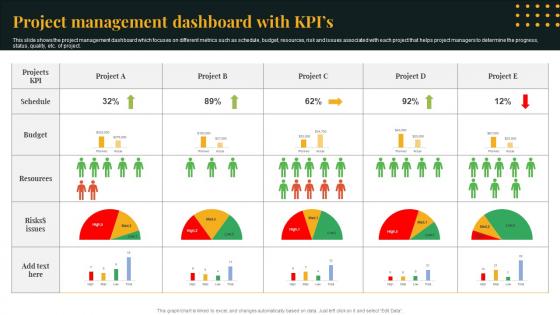
This slide shows the project management dashboard which focuses on different metrics such as schedule, budget, resources, risk and issues associated with each project that helps project managers to determine the progress, status, quality, etc. of project.
People who downloaded this PowerPoint presentation also viewed the following :
Project Management Dashboard With KPIs with all 7 slides:
Use our Project Management Dashboard With KPIs to effectively help you save your valuable time. They are readymade to fit into any presentation structure.





FAQs for Project Management
You definitely want to track schedule and budget first - those are usually make-or-break. Quality stuff like defect rates matter too, depending on what you're building. Team productivity and how happy your stakeholders are can totally derail things even when the numbers look fine. Oh, and resource utilization if you're doing multiple projects at once (which is always a nightmare). Honestly though? Don't go crazy tracking everything. Pick maybe 3-5 things that actually matter for your specific situation. I'd start with time and money since those are non-negotiable, then add whatever quality metrics make sense for your deliverables.
Honestly, stakeholder satisfaction is like a crystal ball for your other project metrics. Unhappy stakeholders? Get ready for budget overruns and timeline disasters. They'll request endless changes, drag their feet on approvals, or just stop caring about your project altogether - trust me on this one. Quick pulse surveys work way better than waiting for formal reviews. Do them weekly if you can. Short bursts, nothing fancy. Address complaints fast because once stakeholders check out mentally, everything else falls apart. It's wild how one cranky executive can derail months of work, but that's project management for you.
So budget variance is basically how you catch financial problems before they wreck your project. Just compare what you planned to spend vs. what you're actually spending - super straightforward but honestly a lifesaver. I learned this the hard way on a project that went 30% over because we weren't watching closely enough. Check it weekly, not monthly when it's too late to fix anything. Set up some kind of alert when you hit 10-15% variance so you can dig into what's going wrong and maybe adjust your scope or get more resources.
Just divide your on-time deliveries by total completed projects, then multiply by 100. Pretty straightforward math. 8 out of 10 projects = 80%. The real headache is figuring out what "on time" actually means. Original deadline or the latest revised one? I'd go with the revised date because let's be real - scope creep happens all the time. Also decide if "delivered" means when your team finishes or when the client signs off. Big difference there. Track it monthly or quarterly depending on your cycles. Whatever you pick, just stay consistent with your definitions so everyone's measuring the same thing.
Ugh, scope changes are the worst for KPIs. Your budget and timeline metrics will definitely get wrecked since you're suddenly doing way more work than planned. Resource stuff gets messy too - now you need different people or skills you didn't account for. But here's what really screws people over: they forget to update their baseline measurements after approved changes. So your KPIs look terrible even though you're crushing it against the new requirements. Always recalibrate those baselines when scope changes get the official green light, otherwise you're just torturing yourself with impossible targets.
So basically, you wanna track how much of your team's time goes to actual billable work vs just sitting around. It's like a health check - are people drowning at 120% capacity or bored at 40%? Sweet spot is usually 70-85% utilization. Any higher and you're looking at burnout central. Check weekly so you can shuffle work around before someone either burns out or starts reorganizing their desk drawers for the third time. Honestly, it's one of those metrics that seems obvious but most managers ignore until it's too late.
Match your KPIs to how the methodology actually functions. Waterfall needs metrics for sequential progress - milestone completion, budget variance, scope creep. Makes sense since everything's planned upfront. Agile's completely different though. Sprint velocity, burndown rates, team satisfaction work better because you're iterating constantly. I've watched teams jam Waterfall metrics into Agile projects and it's painful to see. Here's what works: think about what success looks like in your specific framework first. Then pick metrics that actually measure those things. List your methodology's core principles, find KPIs that match up. Way more effective than forcing square pegs into round holes.
Dude, cumulative flow diagrams are seriously underrated. They show you exactly where work gets stuck - like when everything piles up in code review (story of my life). The visual patterns make it super obvious what's happening with your team's speed and cycle times. Way better than staring at boring KPI dashboards that don't tell you much. You can spot if your work-in-progress limits are actually doing anything or just there for show. I'd check yours weekly if I were you. Catches the annoying bottlenecks before they completely derail your deliverables.
Honestly, just look at what your stakeholders actually care about first. Customer-facing stuff? You'll need satisfaction scores and feedback, not just budget tracking. I usually go 60-70% hard numbers (execs eat that up) and 30-40% softer stuff like team morale. Pure data misses so much context - like when your client's happy but the team's burning out. Track both types for a few sprints, then see what people actually bring up in meetings. That's your real answer right there. Oh, and don't overthink the exact ratio - it's more art than science anyway.
Don't get caught up in metrics that just look pretty on paper. Like, 95% tasks done sounds amazing until you realize they're all the small stuff and your main deadlines are totally screwed. People also love picking random timeframes that make their numbers look better - I've seen it a million times. Comparing KPIs between completely different project types is useless too. Honestly? Just pick 3-4 metrics that actually matter for your success and check them regularly. Way better than drowning in data that doesn't help you.
Honestly, you've got to schedule regular check-ins for your KPIs - monthly works, but weekly's better if stuff is moving quickly. Don't get too attached to the metrics you picked during planning because they'll probably become useless once you're actually executing. Ask yourself "what really matters right now?" at each stage. Like, customer satisfaction is pointless during development but super critical at launch. Your team will definitely know when a KPI isn't working anymore since they're in the trenches daily. Set those calendar reminders or you'll forget to pivot. Trust me on that one.
Honestly, just check if your current PM tool has reporting built in first - most do these days. Asana, Monday, Jira all have decent KPI dashboards that pull data automatically. Way better than doing spreadsheets by hand (been there, not fun). If you need fancier visuals for presentations, Power BI or Tableau are solid but probably overkill unless you're dealing with executives who love charts. I'd stick with whatever integrates cleanly with how your team already works. No point making everyone learn new software just for prettier reports.
Yeah, communication metrics totally work for tracking collaboration! I track response times and meeting participation - gives you a real sense of engagement levels. Cross-functional chat frequency is my favorite though, shows you when teams start getting siloed (which happens way more than people think). You'll want to measure feedback loops too since that's usually the first thing that breaks down. Decision speed is another good one. Honestly, don't overcomplicate it - just pick 2-3 that actually matter for how your team works and check them weekly.
So basically, tracking risk stuff gives you a heads-up before your project goes sideways. Things like how exposed you are to problems, whether your fixes actually work, how fast you solve issues - this catches budget blowouts and delays before they wreck your main numbers. Projects that do this well perform 15-20% better on cost and timeline stuff. Honestly, most people overthink it though. Just pick your 3 biggest risks and check on them weekly. It's way better than scrambling when everything's already on fire.
Honestly, client feedback is like getting cheat codes for building KPIs that actually work. You're not just throwing darts in the dark anymore - clients tell you straight up what matters to them. Maybe it's hitting deadlines, solid communication, or staying on budget. Reviews help catch those sneaky patterns too (I always forget how we mess up timeline estimates lol). Once you see what keeps coming up in feedback sessions, boom - those are your money metrics right there. Way better than generic KPIs everyone uses. Just track whatever clients complain or rave about most. That's where the real insights live.
-
SlideTeam offers so many variations of designs and topics. It’s unbelievable! Easy to create such stunning presentations now.
-
I want to thank SlideTeam for the work that they do, especially their customer service.