

Project Management KPI Dashboard To Review Task Progress





Try Before you Buy Download Free Sample Product
 Impress Your
Audience
 100%
Editable
 Save Hours
of Time


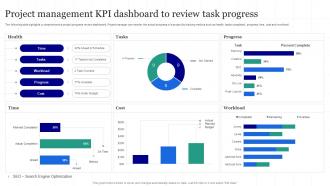
The following slide highlights a comprehensive project progress review dashboard. Project manager can monitor the actual progress of a project by tracking metrics such as health, tasks completed, progress, time, cost and workload.
People who downloaded this PowerPoint presentation also viewed the following :
Project Management KPI Dashboard To Review Task Progress with all 7 slides:
Use our Project Management KPI Dashboard To Review Task Progress to effectively help you save your valuable time. They are readymade to fit into any presentation structure.






FAQs for Project Management KPI Dashboard To
Focus on the big ones first: budget variance, schedule performance, scope creep, and quality stuff like defect rates. I've watched so many teams drown themselves tracking like 30 different metrics - total waste of time. Team velocity matters too, plus client satisfaction scores since those actually tell you if things are working. Oh, and resource utilization if you're running multiple projects at once. Here's the thing though - pick maybe 5-7 max and use them to make real decisions, not just fill out reports. Start there and only add more if you hit a specific problem that needs measuring.
KPIs are like having a dashboard for your project - they'll show you what's actually happening vs what you think is happening. Track stuff like budget variance, timeline slips, team velocity. Honestly, I was skeptical at first but the patterns you start seeing are pretty revealing. Maybe you'll notice your estimates are always off by 30%, or certain team members are consistently overloaded. Once you have that data, you can fix your planning process or shuffle resources around differently. Pick 3-4 metrics that match your biggest headaches and just track them for a few weeks. Don't overthink it.
Look, hitting your budget is nice and all, but you're only seeing half the story. Qualitative KPIs track the stuff that actually matters long-term - is your team happy? Do stakeholders trust you? How's communication flowing? I learned this the hard way on a project where we crushed our numbers but everyone was miserable. These softer metrics catch problems early. Like when morale starts tanking or collaboration goes to shit. You'll spot it weeks before it blows up your timeline. Start with 2-3 qualitative measures alongside your usual financial tracking.
Honestly, start with your actual project goals and make them super specific. Work backwards from there to figure out which numbers actually matter. I've seen so many teams get obsessed with tracking stuff that looks impressive but tells you nothing useful - total waste of time. Pick maybe 3-5 KPIs max that directly connect to your goals. More than that and you'll just confuse everyone. Make sure your team gets why each one matters and how their daily work affects those numbers. Oh, and don't be afraid to change them up as things evolve.
Honestly, I'd just pick a dashboard tool and stick with it - Monday.com or Asana work great, though Excel still does the job if you're not feeling fancy. Set up those automated reports so you're not pulling data manually every week (learned that the hard way). Traffic light charts are your friend here - stakeholders love seeing green/yellow/red at a glance. Keep your weekly reports short and sweet. Here's the thing though: don't go crazy with KPIs right off the bat. Start with maybe 3-5 that actually matter, then expand later. Consistency beats perfection every time.
Honestly, KPIs are like giving people scorecards they actually want to check. You want stakeholders engaged? Show them numbers that prove their work matters. Early on, those green dashboards are pure gold for building momentum - people eat that stuff up. But here's the thing - when metrics start dipping mid-project, that's when the real magic happens. Those conversations about pivoting or fixing things? Pure gold. Just don't dump 20 different charts on them. Pick maybe 3-5 KPIs that actually connect to what each group cares about, and you'll see engagement spike naturally.
Look at your project charter first for baseline stuff, but honestly? Most initial KPIs are garbage. Focus on maybe 3-5 that actually matter - schedule variance, budget burn rate, quality metrics. Skip the vanity numbers. Check them monthly and don't get stubborn if they're not helping. Your team needs to get why each one matters and how it ties to success. Dashboard beats status meetings every time - people can just check the numbers whenever instead of waiting around. Oh, and definitely pivot if something isn't giving you useful info.
Honestly, I'd stick to three main ones: budget variance, CPI, and ROI. Budget variance is pretty straightforward - shows exactly how much you're over or under in actual dollars. CPI is your efficiency ratio, and anything under 1.0 means you're bleeding money faster than planned. ROI proves the project's worth to higher-ups, though calculating it mid-project can be a pain. Oh, and if your company does earned value stuff, track that too since it covers both cost and schedule. Weekly budget variance reports are a game-changer - they'll catch problems before things go sideways.
Honestly, KPIs totally depend on your industry and what actually keeps your boss up at night. Construction folks obsess over safety incidents and material waste. Software teams? They're drowning in sprint velocity and bug tracking metrics - kinda exhausting tbh. Healthcare projects care most about patient safety and staying compliant with regulations. Manufacturing is all about efficiency and quality control numbers. Here's the thing though - skip the generic KPI templates everyone uses. Figure out what failure looks like in your specific field first. Then build your metrics around avoiding exactly that disaster. Way more useful than copying what worked for someone else's completely different project.
Honestly, most people go overboard and track like 10+ KPIs - you'll just get overwhelmed. Pick maybe 3-5 that actually tell you if you're succeeding. Skip the vanity stuff too (seriously, nobody needs to know total hours logged). Focus on metrics that are realistic and measurable, not some pie-in-the-sky numbers. Oh and don't be stubborn about changing them - I've seen projects pivot and the original KPIs become totally useless. Start with what "success" looks like at the end, then figure out what signals you're heading there. Way easier than trying to measure everything.
Here's the thing - KPIs show everyone what winning actually looks like, so people naturally step up their game. Your team sees their sprint completion rates or bug counts in real time? They'll own those numbers way more than vague "do better" feedback. Honestly, nobody wants to be the red dot on everyone's dashboard lol. Just pick 3-4 metrics that actually connect to what your team does daily. Don't get caught up in fancy vanity metrics that look impressive but don't mean anything. Review them weekly during standups and you're golden.
Honestly, I'd start with whatever project management tool you're already using - most have decent reporting built in. Monday.com and Asana are solid for basic KPIs like timelines and budget stuff. Microsoft Project works great but it's kind of a beast, probably overkill unless you're running huge projects. Jira's good too if your team's already in that ecosystem. For fancier dashboards that'll impress the executives, Power BI or Tableau can pull from multiple sources. My advice? Don't overcomplicate it initially - see what your current setup can do first before dropping money on new software.
Check your KPIs weekly when things are moving fast, but don't actually change them unless there's a major scope shift. Weekly check-ins catch problems early and keep everyone focused on the right stuff. If your project's more chill, monthly works fine too. Honestly, I've seen teams obsess over this timing thing way too much. The real trick is being consistent - pick a schedule and stick with it. Don't mess with the actual metrics just because you're missing targets though. That's basically cheating yourself. Only update when the project fundamentals actually change.
Honestly, dashboards are a game changer for keeping everyone on the same page. No more digging through boring status emails - people can actually see what's going on right away. Team members can't really BS their way through updates when the numbers are staring everyone in the face. During meetings, you'll notice conversations get way more focused because people point to actual data instead of just talking in circles. Oh, and stakeholders love being able to spot problems or wins without having to ask a million questions. Just don't go overboard with charts at first - maybe start with 3 or 4 that actually matter.
Honestly, just dig into your old project data - that's where the gold is. Pull up 5-10 similar projects and see what actually went down with budgets, timelines, all that stuff. I learned this the hard way lol. Maybe you guys always go 15% over budget or projects take 20% longer than planned. That's totally normal btw, most teams have patterns like this. Calculate some averages from the real numbers instead of just hoping for the best. Way better than setting KPIs based on what you think should happen versus what actually does happen.
-
Excellent template with unique design.
-
I am not the best at presentations but using SlideTeam’s PPT template made it easier for me. Thank you SlideTeam!