

Progress Monitoring Dashboard For Data Migration Project





Try Before you Buy Download Free Sample Product
 Impress Your
Audience
 100%
Editable
 Save Hours
of Time


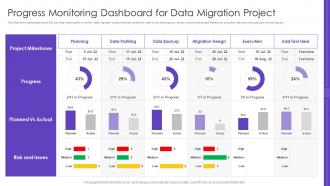
This slide showcases dashboard that can help organization to monitor data migration project and take actions in case of any discrepancy. Its key components project milestones progress, planned vs actual plus risk and issues.
People who downloaded this PowerPoint presentation also viewed the following :
Progress Monitoring Dashboard For Data Migration Project with all 7 slides:
Use our Progress Monitoring Dashboard For Data Migration Project to effectively help you save your valuable time. They are readymade to fit into any presentation structure.





FAQs for Progress Monitoring Dashboard For
Track completion rates, timeline adherence, and budget burn first - those are your bread and butter. Quality stuff like defect rates matters too because shipping broken code sucks for everyone. I'd also watch resource utilization so you know if people are drowning or bored. Risk indicators catch problems before they explode. Stakeholder satisfaction and milestone hits round it out. Mix leading indicators (predicting future mess) with lagging ones (what already went wrong). Honestly, start with maybe 5-7 metrics or you'll go crazy trying to track everything.
Dude, you NEED a progress monitoring dashboard. Everyone can see what's actually happening with your project in real-time instead of those painful status meetings where half the team looks lost. Stakeholders just pop in whenever they want updates - no more random Slack pings asking about timelines (honestly such a relief). All your key metrics and roadblocks live in one spot, so there's automatic transparency. Oh and set it up early! I made that mistake once and had to backfill a month of data. Make sure people actually know where to find it though.
Put your most important stuff top-left - that's where people look first. Stick to 3-4 colors max and don't cram everything together. I once made this hideous rainbow dashboard that nobody could read lol. Group similar metrics so they make sense together. Make your charts actually readable - hate when you need a magnifying glass! Same fonts throughout looks way cleaner. Oh and definitely test it with someone else first. They'll catch weird stuff you totally missed since you've been staring at it forever. Clear labels with dates are clutch too.
Honestly, real-time data makes such a huge difference. You catch problems immediately instead of finding out weeks later when you can't do anything about it. Makes decision-making so much smoother because you're working with what's actually happening right now, not some outdated report from last month. I mean, once you get used to seeing live data, going back to static dashboards feels painful. Your team stays on the same page too since everyone's looking at current reality. Oh and start with your most important data sources first - you don't need to connect everything at once. Trust me, you'll notice the impact pretty quickly.
So KPIs are basically your dashboard's way of telling you if you're actually getting stuff done or just wasting time. Track the metrics that matter – completion rates, budget, timeline, whatever's crucial for your project. Honestly, they're like having a crystal ball for spotting problems early. When something starts going sideways, you'll know exactly where instead of playing guessing games. Here's the thing though – pick maybe 3-5 good ones. Don't go crazy tracking every little detail or you'll drown in data.
Start with surveys and user interviews - classic but they work. In-app feedback widgets are clutch too. But honestly? Watch what people actually click on vs. what sits there collecting digital dust. I've worked on projects where we built these elaborate features that literally nobody touched. Check your support tickets regularly for patterns - if five people ask about the same thing, that's your roadmap right there. Set up feedback cycles every few months, but here's the thing everyone forgets: actually tell users when you fix stuff based on their input. Makes them way more likely to keep helping you out.
Honestly? Don't cram everything onto one screen - learned that the hard way. Pick 3-5 key metrics max and actually define what success looks like before you build anything. Skip the vanity metrics that barely change or your team can't really control. Focus on leading indicators over lagging ones (way more useful for actually steering the ship). Oh, and definitely test it with real users first. I've seen too many beautiful dashboards that nobody touches because they're confusing as hell. Start small, then expand once people are actually using it.
Here's what I'd do - set up different filtered views so each team sees what they actually need. Marketing can focus on campaign stuff and conversion rates. Finance will want budget variance and ROI data (they're pretty picky about that). Operations usually ends up checking workflow bottlenecks constantly - honestly they're always the most paranoid about delays. HR can track productivity and spot training gaps. Leadership gets the big picture view for strategy calls. The trick is not overwhelming people with metrics that don't matter to their day-to-day work. Everyone should know exactly which numbers move the needle for them.
So for your dashboard, honestly Tableau and Power BI are your best bets - they're super user-friendly and handle most stuff you'll throw at them. React with D3.js is amazing if you're into coding and want total control, but yeah, way more work upfront. Google Data Studio's pretty decent too, especially if you're already using Google stuff. Excel works fine for basic tracking if you're not trying to impress anyone lol. Really comes down to how complex your data is and whether your team can actually use the fancy tools. I'd sketch out what you actually want to track first, then pick whatever won't make you want to throw your laptop.
Honestly, charts and graphs are game-changers for tracking progress. Your brain processes visual stuff way faster than staring at endless spreadsheet rows. Bar charts and line graphs let you spot trends instantly - like whether you're crushing goals or falling behind. I used to waste so much time trying to make sense of raw data in tables. Color-coded dashboards are clutch too. You'll catch patterns and weird outliers at a glance instead of hunting through hundreds of numbers. Start with simple visuals first, then get fancy once everyone's comfortable reading them. Trust me, it's night and day difference.
Watch your dashboard for the obvious stuff - tasks falling behind, resource crunches, missed deadlines. Compare what's actually happening vs your timeline. That's where you'll catch problems before they explode. Dependencies are huge too - if one task slips, you'll see exactly which ones are screwed next. Honestly, automated alerts for critical stuff will save your sanity instead of digging through spreadsheets constantly. I check mine every morning with coffee (bad habit maybe?). Trust the data when it's screaming at you.
Just add trend lines and year-over-year comparisons straight into your dashboard. Rolling averages work great too. I usually show 3-6 months of context so your current numbers actually mean something - hate when dashboards just show today's data with zero background. Color coding helps when big changes happened that explain weird spikes or drops. Oh, and annotations are clutch for marking major events. Don't go overboard though. Start with one solid historical comparison first, then build from there. The historical stuff should actually help you understand what's happening now, not just make your dashboard look busy.
Start with basic data literacy stuff - reading charts, spotting trends, the usual. Then do hands-on workshops for your specific dashboard features and filters. The interface itself isn't that hard to learn, honestly. What trips people up is figuring out what the data actually means for their job. I'd do role-specific training first, then make some quick reference guides. Maybe record walkthrough videos too? Oh, and definitely set up office hours the first month - people always have random questions once they start using it for real.
Start with role-based access - only show people what they need for their specific teams. HTTPS is non-negotiable, obviously. Strong auth with multi-factor if you can swing it. Don't put sensitive stuff like employee names directly on charts. Anonymized IDs work way better. I've watched this blow up when the wrong manager saw performance data they shouldn't have access to. Not fun. Oh, and run access audits periodically - people change roles but somehow keep their old permissions forever. Basic rule: give minimal access that still lets them do their job.
So most platforms let you set up different user groups - like managers, analysts, executives - and give each group their own dashboard layout. Managers might see team performance stuff while executives get the big picture KPIs. You can also hide sensitive data from certain people, set up custom filters, and create totally separate templates if needed. Honestly the hardest part isn't the technical stuff, it's figuring out what each role actually needs to see first. Trust me, map that out before you start building or you'll be redoing everything later. Once you dive in though, it's pretty straightforward.
-
I am really satisfied with their XYZ products. Used their slides for my business presentations and now I am taking their help for my son's high-school assignments. Super satisfied!!
-
Loved the fact that SlideTeam provides clean, high-definition, and professional PowerPoint products.