

Agile Methodology For Data Migration Project It Kpi Dashboard For Monitoring Project Progress





Try Before you Buy Download Free Sample Product
 Impress Your
Audience
 100%
Editable
 Save Hours
of Time


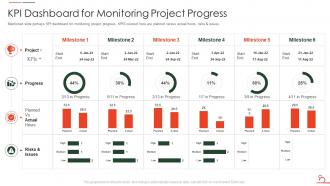
Mentioned slide portrays KPI dashboard for monitoring project progress. KPIS covered here are planned versus actual hours, risks and issues.
People who downloaded this PowerPoint presentation also viewed the following :
Agile Methodology For Data Migration Project It Kpi Dashboard For Monitoring Project Progress with all 7 slides:
Use our Agile Methodology For Data Migration Project It Kpi Dashboard For Monitoring Project Progress to effectively help you save your valuable time. They are readymade to fit into any presentation structure.






FAQs for Agile Methodology For Data Migration Project It Kpi Dashboard For
Track your migration velocity first - how many records you're crushing per sprint. Then watch data quality stuff like error rates and validation fails. System performance matters too (throughput, downtime, the usual suspects). Business continuity is huge though - can people actually do their jobs while this is happening? Honestly, I'd be paranoid about rollback readiness because migrations love to explode unexpectedly. Get stakeholder feedback scores from sprint reviews. Set up alerts for critical thresholds so you're not finding disasters during retros when it's too late.
Don't wait until the end to check data quality - learned that one the hard way! Build those validation checks right into each sprint instead. Set up automated stuff that runs constantly: profiling, completeness checks, business rules, all that. Your dashboard needs to show quality metrics in real-time so you catch problems early. After each sprint, run reconciliation reports between your source and target systems. Oh, and make sure it's not just the data team's job - everyone should care about quality or you're screwed.
Data quality issues will bite you first - then scope creep and timeline pressure hit like a freight train. Build those validation checkpoints early or you'll regret it later. Track your migration velocity and error rates so stakeholders can see real progress instead of pestering you every day. Don't skip data profiling even when everyone's rushing you (trust me on this one). Automated testing pipelines are non-negotiable. Always pad your timeline estimates because this stuff never goes as planned. Update your dashboard daily so expectations stay realistic. Oh, and prepare for the "are we there yet?" questions - they're coming regardless.
With Agile, your dashboard needs to show what's happening right now, not last week's numbers. Focus on stuff that actually helps - data validation rates, how fast things are processing, where you're getting stuck. Don't just make it look pretty for meetings (though honestly, stakeholders do love their charts). Your whole team should be able to jump in and update things, not just the PM sitting on everything. The dashboard itself will change as you figure out what actually matters. I'd start with maybe 3-5 key metrics and build from there. Keep it simple at first - you can always add more complexity once you know what you're looking for.
Look, stakeholder communication can make or break your whole project. Everyone needs to be on the same page about what you're actually measuring and why it matters. I've watched migrations completely fall apart because people had totally different ideas about timelines - it's honestly painful. Set up regular check-ins where you explain the dashboard stuff in normal language, not just throwing numbers at them. Each metric should connect to what they actually care about. Oh, and definitely get automated alerts for the critical stuff so they're not blindsided by problems during those weekly updates.
Put your most important KPIs right at the top - traffic light colors are perfect for quick status checks. Real-time data is key, otherwise you're flying blind with old info. Group similar stuff together and stick to simple visuals like progress bars and line graphs. Different people need different views, so think about that early on. Oh, and definitely test it with real users first! I can't tell you how many "beautiful" dashboards I've seen that are completely useless in practice. Make sure it's accessible to everyone who needs it.
Honestly, Power BI is your best bet if you're already using Microsoft stuff - it plays nice with everything. Tableau and Grafana are solid too for the visualization part. You'll need something like Azure Data Factory or Apache Airflow running behind the scenes to actually move your data and track the metrics. Oh, and don't forget a decent database to store all your KPI data - InfluxDB works great, or just stick with SQL Server if that's what you know. I'd start by nailing down which 5-7 metrics actually matter to your team first, then worry about the tech stack.
Honestly, real-time monitoring is a game changer for migrations. Instead of crossing your fingers and hoping nothing explodes, you see data quality issues and performance problems as they happen. Course corrections become way easier when you're not finding out about failures three sprints later (been there, not fun). The whole thing turns into this feedback loop where you can actually adjust based on what the metrics are telling you. Short version: set up alerts for your critical stuff so problems hit your phone immediately. Keeps everything moving at a steady pace and saves you from those brutal rollback situations that make everyone miserable.
Start with data discovery completion and source connectivity - that's your bread and butter. Track how much profiling you've actually finished too. Honestly, the first few weeks are gonna be a nightmare so keep it simple. Don't get fancy with data quality metrics yet, that stuff comes way later when you're moving actual data around. Monitor your team's velocity on discovery tasks and watch for blockers. I'd build a basic dashboard that just answers "are we figuring out what we need to know?" Everything else can wait.
Track the obvious stuff first - adoption rates, support tickets, how fast people can actually get things done. Page load speeds too since nothing kills morale like a slow system. But honestly? The survey feedback is where you'll find the real gold. Ask users straight up if this migration made their lives easier or harder. Compare how they're using features now versus before - that'll tell you if people are actually embracing the change or just suffering through it. Oh, and set up some kind of early warning system in your dashboard. Trust me, you want to catch problems before your inbox explodes with angry emails.
Honestly, backlog management is a lifesaver for data migration - it stops everything from turning into chaos. I learned this the hard way on my last project! You're creating a smart priority queue for all your migration tasks and datasets. Short tasks first, then the bigger chunks. Weekly grooming sessions keep things realistic and prevent that dreaded scope creep. Your dashboard needs to show velocity and remaining work so stakeholders don't bug you every five minutes. It's like having a really organized to-do list that actually works instead of just stressing you out.
Set up automated alerts for when your KPIs hit certain thresholds - like data quality dropping below 95% or migration speed slowing by 20%. Daily standups are clutch for reviewing dashboard metrics so you can pivot quick. Slack integrations honestly save tons of time vs manually checking dashboards all day. Do weekly retrospectives focused specifically on KPI trends, not just general project stuff. Oh and assign someone to own each critical metric - that way there's actual accountability when things go sideways. The whole point is making sure feedback drives immediate action instead of just collecting dust.
Look, data governance basically controls what KPIs you can actually track and trust during migration. Weak governance means your data quality metrics will be garbage - no reliable baselines, no validation rules. With strong governance though? You get clear lineage, ownership, and quality standards. Then you can confidently measure accuracy rates, completeness percentages, compliance stuff. It's kind of a chicken-and-egg thing sometimes, honestly. Here's what I'd do: pick KPIs that match your current governance maturity level first. Don't go for those aspirational metrics you can't even validate yet - just builds frustration.
Look, it really comes down to what would make your boss panic if it broke. Healthcare companies are obsessed with patient data and can't afford downtime. Banks? They're all about transaction accuracy and staying compliant with regulations. Retail gets super nervous about customer experience - especially during big sales events. Manufacturing worries about production lines and supply chain stuff staying connected. Honestly, I'd just figure out what keeps your industry up at night first. Then build your KPIs around those specific nightmares. Ask yourself: what failure would actually hurt the business most?
Keep those sprints super short - like 1-2 weeks tops. Break everything into tiny chunks you can actually show people, because stakeholders get way less antsy when they see real stuff happening instead of just updates about updates, you know? Daily standups are honestly a lifesaver since data problems crop up out of nowhere and need fixing fast. Monitor your KPIs constantly and don't be stubborn about changing scope. Oh, and if your data quality numbers start looking weird, just pivot - I've seen too many teams ignore red flags and regret it later.
-
Use of different colors is good. It's simple and attractive.
-
Attractive design and informative presentation.