Let’s imagine we start running to improve our health. A noble goal. We start, and within five minutes, we are exhausted. A few days pass. Now, we can run for 15 minutes before stopping. This time (in minutes) that we keep track of during our runs tells us that we are getting healthier. To measure, record, and organize this data, we have great apps with ergonomic dashboards; apart from time, these dashboards also keep us informed of the distance, speed, calories burnt, etc.
Tracking progress in business follows a similar process. We have the metrics to keep track of and a dashboard to help us organize this data. It will tell us how the business is doing.
Now, you could always use a watch and pen and paper to keep track of progress, but it won’t give you every metric you want. SlideTeam’s KPI Metrics Dashboard Templates, however, provide you with all tools you will even need to keep track of your company’s progress with every metric you can think of, already noted within these customizable and content-ready PowerPoint Presentations.
Let’s explore this universe of agile progress measurement that manifests as PPT Templates.
Template 1: Agile Metrics to Measure Project Development Agile Software Development Lifecycle
Analyze the value provided and risk taken over the course of the project with this PPT Layout. Track and showcase the flow efficiency using graphs and use the ‘Key Takeaways’ section to present additional information relevant to the graph. Download it now by clicking the link below.
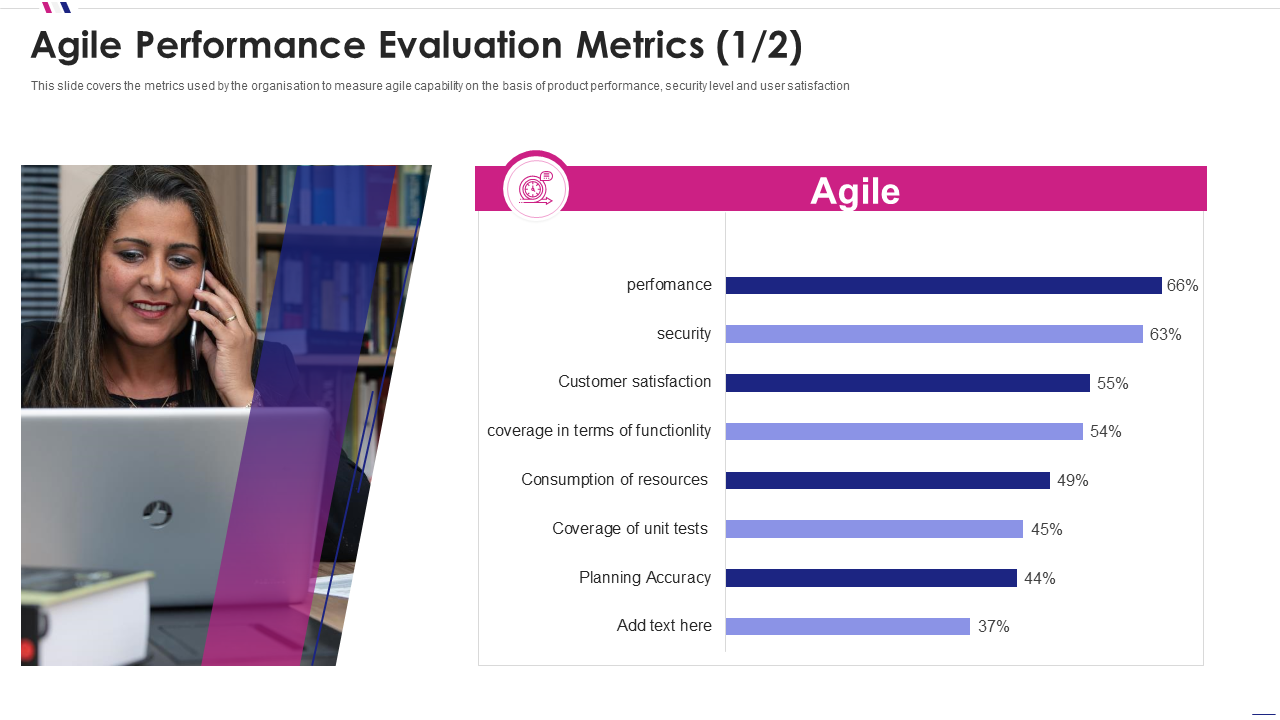
Template 2: Performance Evaluation Metrics Agile Software Development
This bar graph PowerPoint Slide presents how far the project has come along on metrics such as performance, security, customer satisfaction, and more. Color-coordinate the graph to ensure it always remains an easy read and empower your team and shareholders to keep up to date with the project’s progress. Get this presentation template now!
Template 3: Agile Software Development Evaluation Metrics
Tabulate and note the metric to keep track of data warehouse, mobile development, and package implementation viz-a-viz quality, time-to-market, and stakeholder satisfaction. Enable the business to keep these metrics in mind and use informed decision-making with each iteration. Download it now.
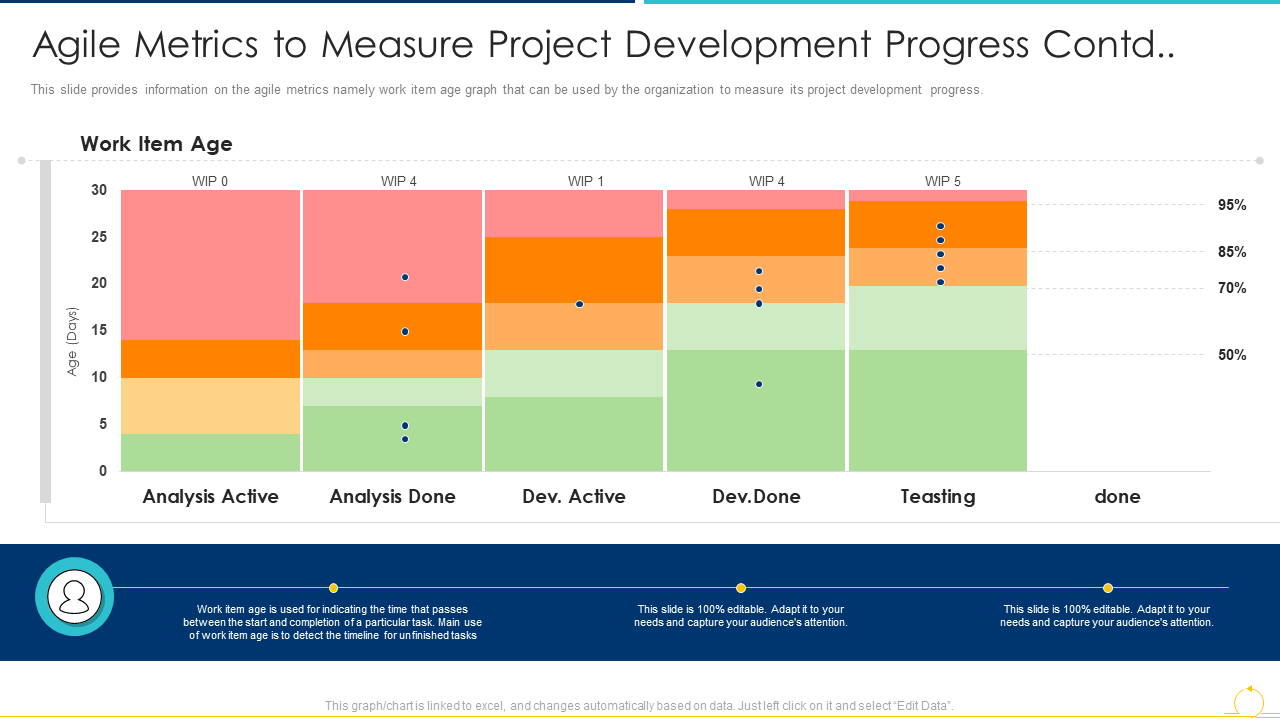
Template 4: SDLC Agile Model Metrics to Measure
Where is your software development life cycle? Use this color-coded bar graph PPT Preset to present how far along in each phase the software is currently at. These phases are Analysis Active, Analysis Done, Development Active, development Done, and Testing. The aim is to make sure that you are competent enough to eke out any inefficiencies that may creep in. Get this presentation template now.
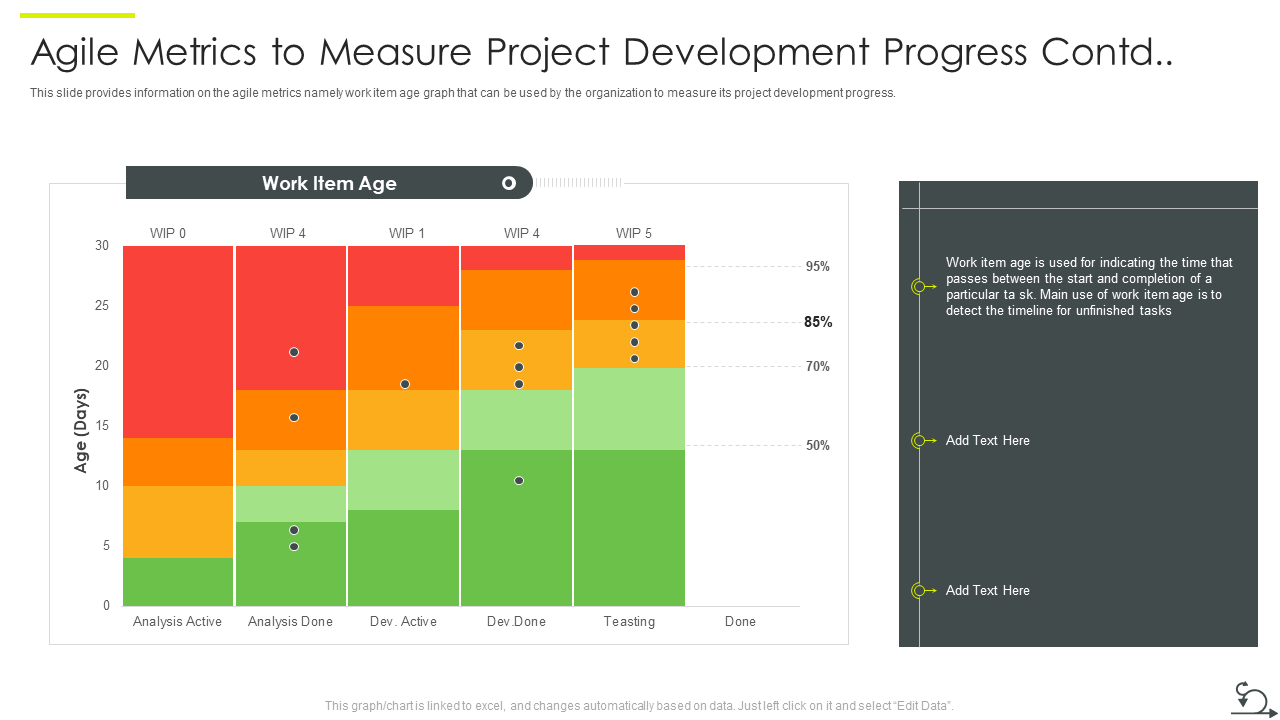
Template 5: Metrics to Measure Project Development Progress
On the lines of Template 4, but with a stronger color scheme, use this PowerPoint Slide to ensure tracking software development becomes an easy process for the organization. The colors notify you of areas where team performance is lagging and add your notes to the project status. Get it now.
Template 6: Using Agile in Data Transformation Project IT KPI Dashboard
With a number of charts and graphs, this Key Performance Indicator (KPI) dashboard PPT Template will soon emerge as the ultimate reference point for tracking performance metrics. Along with the metrics, measure the hours and risks for achieving each milestone as well. Download it now!
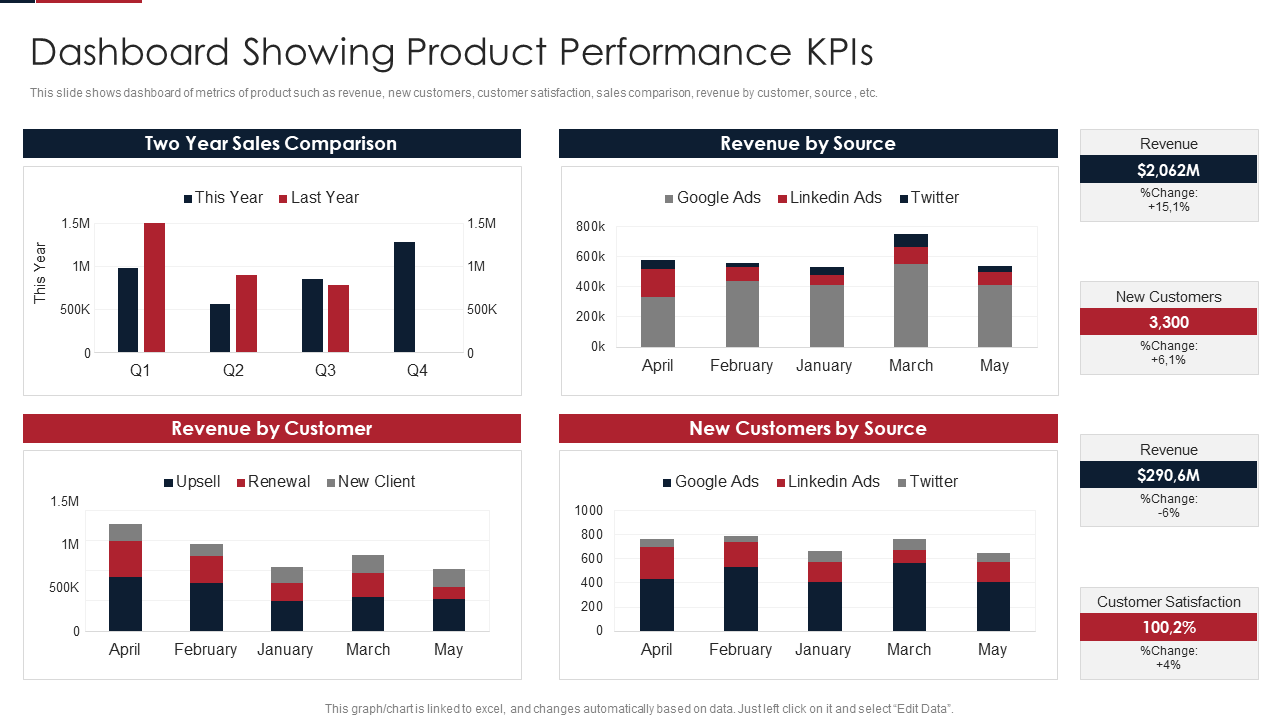
Template 7: Agile Product Lifecycle Management System Dashboard
Use this bar graph PowerPoint KPI Dashboard Slide to present sales comparisons, revenue, customer satisfaction, and more for a given quarter/month/year from a particular source. Customer satisfaction and revenue are given the importance these deserve, with the template expressing these indices in absolute numbers as well. Use revenue by the customer as the talking point of your presentation to elevate it to thinking about Key Account Management. Download it now!
Template 8: Agile Delivery Metrics Data Model
This PPT Design has a simple look and feel but is an important input to the decision-making process. Use this PPT Template to keep the focus on the metrics in the table to help in decision-making. Of any business offerings, the template offers you a clear comparison of stakeholder satisfaction. It is perfect for noting the agile principles in a single place. Download it now.
Template 9: Agile Methodology For Data Migration Project
With a bi-color scheme, this PPT Preset is perfect for monitoring team performance against relevant metrics. Risks and Issues, and cost overruns are common in project implementation; use this slide to see if there is a way these could have been reduced/avoided. Along with team performance, measure the project progress and risks involved. Get it now.
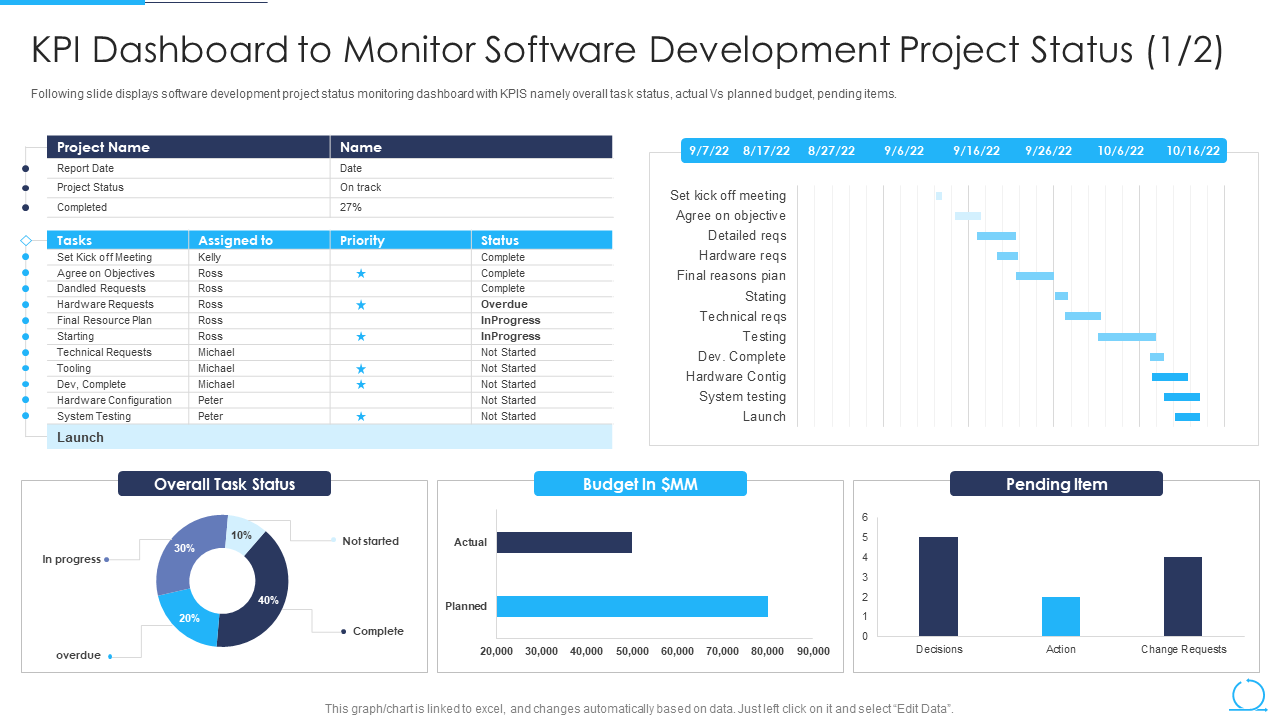
Template 10: KPI Dashboard To Monitor Software Development Project Status
An extensive KPI Metric Dashboard, this PPT Template allows you to present a detailed analysis of the agile process and its current status. With information regarding the project, the budget, pending tasks, and more, this template covers it all. Use it to transmit your command over the project and the software. Download it now.
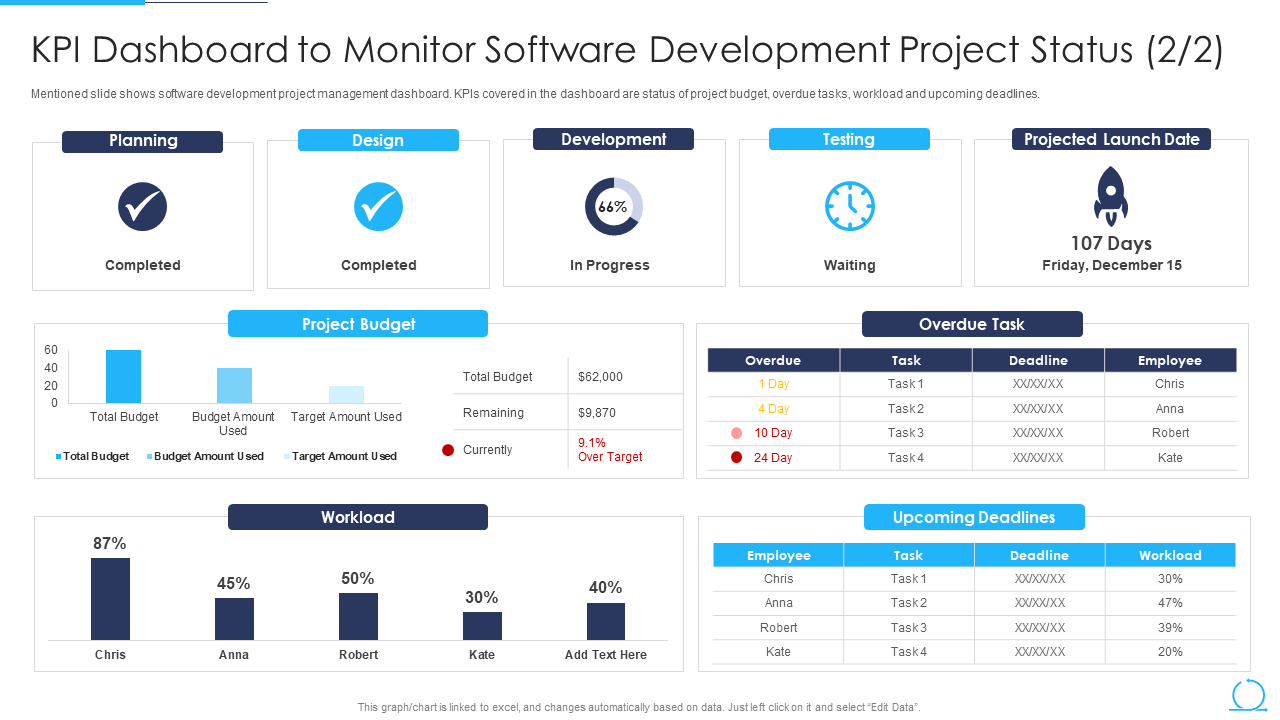
Template 11: Agile QA Model IT KPI Dashboard
A version of the previous template, use this KPI Dashboard PPT Slide to track the status of the planning, design, development, budget, overdue tasks, workload, and more. The graphs are chosen carefully but can be used for the metrics of your need. Download it now.
Template 12: Agile Delivery Metrics Disciplined Delivery
A more color-oriented and vibrant version of Template 3, this PPT Slide will help you note down agile metrics in a table to ensure easy comprehension and improved retention. You get to rate critical variables on the parameters of quality, time-to-market, and stakeholder satisfaction. Download it now.
Template 13: Agile Software Quality Assurance Model
With a brighter color scheme, this KPI Dashboard PPT Template will help you showcase progress made so far in your project and the work that remains to reach the end of the development cycle. If within a large organization, you are given a chance to report on this topic, just key in your data into this presentation template and be branded a genius. Get it now!
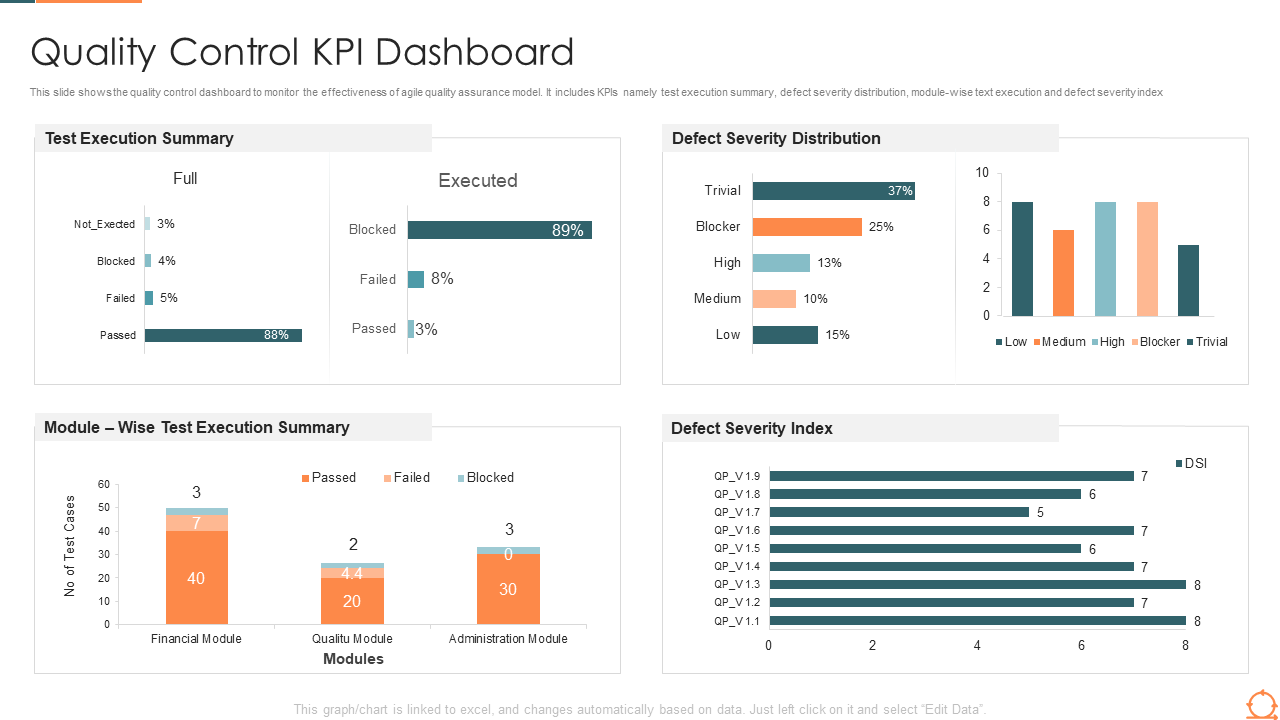
Template 14: Quality Control KPI Dashboard Agile Quality Process
Quality assurance is paramount to agile process success. Employ this PPT Template KPI Dashboard to keep track of metrics such as defect distribution, index, execution summary, etc. Download it now.
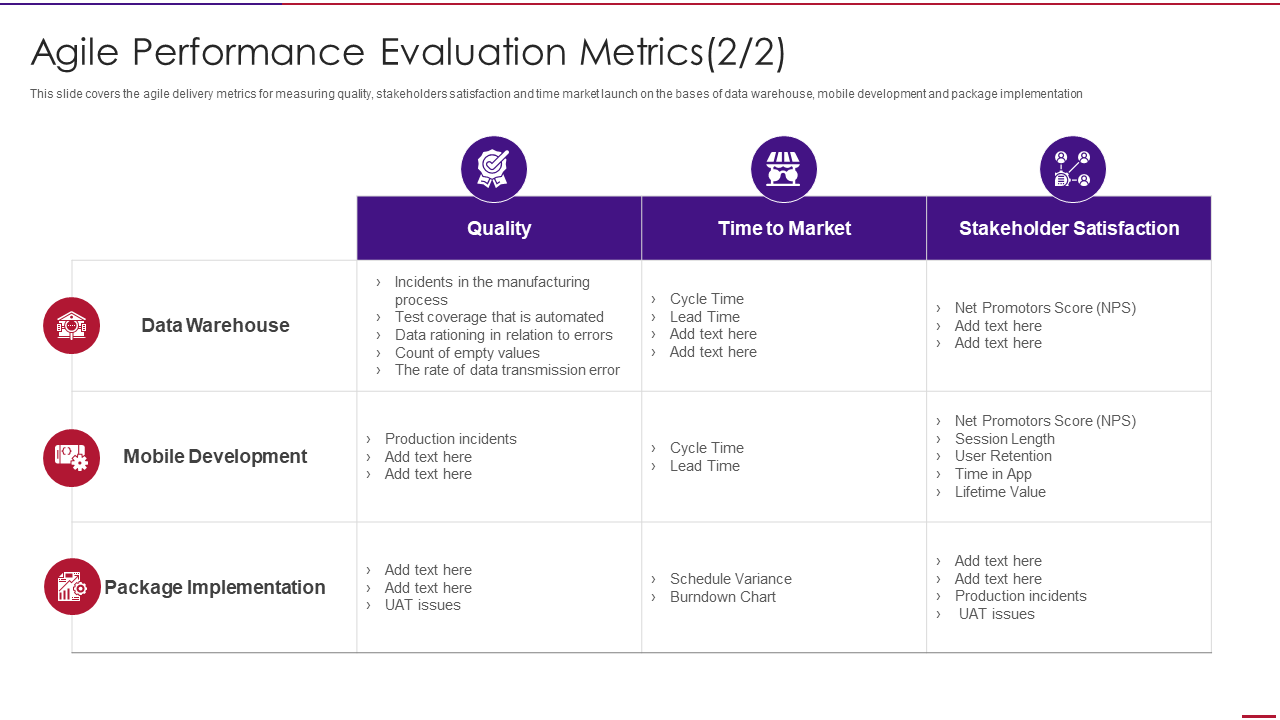
Template 15: Agile Performance Evaluation Metrics
The last template of the blog is yet another exciting color swap to make your audience attentive and help with remembering project objectives and act as an iteration sprint guide. Get it now.
The Eternal Guides to Business Performance
These KPI Dashboards are your guides to tell you where you started, where you are, and where you want to go. Not only to these help you present your progress to others, but these dashboard templates also help you keep yourself on track and take a strategic approach to your work. Download our Agile KPI Metrics Dashboard Templates to stay on the right path.
FAQs on Agile KPI Metrics
What are Agile KPI Metrics?
Agile KPI metrics are a type of metric that is closely associated with the agile development methodology. Agile KPIs measure progress against specific goals and help to track how quickly developers are able to achieve those goals. There are multiple types of agile KPI metrics used to assess different stages or aspects of an agile project, including product backlog, sprint planning, daily scrum, iteration burndown, and more.
KPIs are a common tool in agile development to measure how well projects are progressing toward goals. KPIs are "key performance indicators," and they help track progress by measuring certain metrics associated with the project's overall success. For example, a team might track its velocity, which is a metric that measures how fast it’s able to complete tasks and deliver updates.
What are the KPIs in Agile?
There are many KPIs that you can use to measure your team’s performance in an agile environment. Some of the most common ones include:
- Velocity: This shows how much work your team is able to complete in a given timeframe. It’s an important metric because it helps you understand how your team operates and if they are meeting their deadlines.
- Release burn-down chart: This measures the progress of your current project over time, showing you visually if you are on track to meet your deadline.
- Defect density: This measures how many defects are in the code that your team is working on and can help you identify any issues with the quality of your work.
How are agile metrics measured?
Agile metrics are used to track and measure progress in a development process. Several metrics can be used, depending on the goals and needs of your team or organization. These usually vary with the type of industry. The most used ones are the number of defects found and resolved, the number of sprints completed, etc.
The success of an agile team depends on how well they are able to measure their progress and adapt their processes as needed. By using a wide range of metrics, teams can make sure that they are always moving in the right direction and meeting their goals.
How do you measure agile success?
To assess the success of an agile project, it’s important to measure a variety of factors. Some key metrics that can be tracked and analyzed include velocity, quality assurance, customer satisfaction, team morale, and risk management. By tracking these different metrics over time, you can gain insight into how your team is performing and adapt your process as needed to ensure the continued success of your project.
Of course, measuring agile success isn’t always straightforward or easy. You may need to experiment with tools and techniques to find what works best for you and your team. But with a little practice and perseverance, you can create a robust system that allows you to continuously improve your process and achieve better outcomes on a regular basis.
Why are metrics important in Agile?
The use of metrics in Agile is all about gaining a better understanding of how things are going and making the best decisions possible. With the right metrics in place, you can ensure that your agile processes are working as effectively and efficiently as possible. While metrics might seem like an unnecessary extra step, especially in a world of agile where processes are continuously changing and adapting, they’re actually an important element of any successful implementation. If you want to achieve the best results with your agile efforts, be sure to use metrics as a tool for monitoring progress and making improvements.
What are the five key values of Agile?
There are five key values at the heart of Agile:
- Customer satisfaction - In agile development, we always prioritize customer needs and make sure that our software meets their requirements.
- Individual empowerment - In agile development teams, everyone is empowered to contribute to the project and make decisions.
- Commitment to quality - agile teams are dedicated to delivering high-quality products that meet customers' needs. This means that we continuously test and refine our work and fix any issues as they arise.
- Constant improvement - In an agile development process, we embrace change and constantly work to improve our software products and processes. This means that teams are continuously learning, iterating, and applying new ideas to deliver the best results possible.
- Flexibility - The agile development process is highly flexible, which allows us to respond quickly to changing requirements, new ideas, and unexpected challenges.





 Customer Reviews


