


Project dashboard agile project management for software development it




Try Before you Buy Download Free Sample Product
 Impress Your
 Audience
 100%
100% Editable
 Save Hours
 of Time


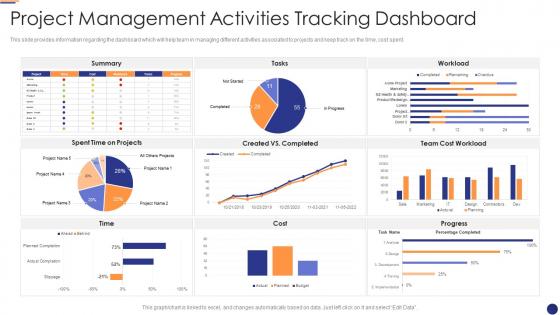
This slide provides information regarding the dashboard which will help team in managing different activities associated to projects and keep track on the time, cost spent.
People who downloaded this PowerPoint presentation also viewed the following :
Project dashboard agile project management for software development it with all 7 slides:
Use our Project Dashboard Agile Project Management For Software Development IT to effectively help you save your valuable time. They are readymade to fit into any presentation structure.





FAQs for Project dashboard agile project management for
Honestly, I'd start with velocity and burndown charts - they're your bread and butter. Sprint goal completion rates too since that shows if you're actually hitting what matters. Cycle time is clutch for seeing how fast work flows through your system. Oh, and definitely track defect rates because shipping fast but broken doesn't help anyone. Lead time from backlog to production tells you the real story, plus team capacity so you know if everyone's drowning. But seriously, don't go metric-crazy. These six will give you what you need without turning your dashboard into a confusing mess.
Honestly, color coding is your best friend here - green for stuff that's going well, red when things are getting sketchy. Burndown charts will save you so much time instead of digging through spreadsheets all day. Progress bars and little icons help everyone see velocity and blockers right away. The key is making those raw numbers actually mean something at a quick glance. Don't go overboard though - I've seen dashboards that look like a rainbow threw up and nobody can find anything. Stick to the metrics your team actually uses for decisions.
Dude, you absolutely need real-time data or your dashboard is basically useless eye candy. Sprint progress, blockers, velocity stuff - all of it needs to update automatically so you can actually make decisions during standups. Flying blind with old data is honestly worse than having no dashboard at all. Quick iterations and pivots are the whole point of Agile, right? So you've gotta see what's happening now, not what happened last Tuesday. Set up automated feeds from whatever tools you're using. Trust me, manually updating dashboards will drive you insane and nobody's got time for that nonsense.
Your dashboard isn't a set-it-and-forget-it thing. Every couple sprints, sit down with your team and actually look at what you're tracking. Ask "Does this help us make decisions?" Honestly, most dashboards end up being metric museums full of stuff nobody cares about anymore. Ditch what's not useful and add new widgets when priorities change. Oh, and don't guess what stakeholders want - just ask them directly. Make this part of your retros so it doesn't slip through the cracks. Trust me, you'll thank yourself later when people actually use the thing.
Honestly, just focus on what your team checks every single day - sprint progress, blockers, velocity. That's it. Don't go crazy with a million colorful charts that'll just confuse everyone (been there, made that mistake). Clean layouts work best, and make sure stakeholders can figure out what's happening in like 30 seconds max. Group similar stuff together, use icons that actually make sense. The real trick? Ask your team what they want to see while you're building it. They'll catch things you totally missed. Run it through a couple sprints first before you commit to the whole thing.
Yeah, definitely! Most dashboards let you drag widgets around however you want. I usually put burndown charts up top since that's what I check first. The filter options are pretty straightforward once you mess with them - just look for the customize button. Different roles need different stuff too, like PMs want story status visible while devs focus more on blockers and task lists. Oh, and save multiple layouts if you can. I have one for standups and another for sprint planning meetings. Makes switching between them way faster than rebuilding everything each time.
Honestly, most teams I know use Jira, Azure DevOps, or Trello since they come with dashboards built in. Jira's probably your best bet if you don't mind the steep learning curve - it plays nice with dev tools. Monday.com and ClickUp are solid alternatives too. Some teams go nuts with Tableau or Power BI for heavy analytics stuff, though that might be overkill depending on your setup. Hell, I've seen people make Google Sheets work surprisingly well for basic tracking. My advice? Start with whatever your devs already know, then add dashboard features on top. Way easier than making everyone learn a whole new system from scratch.
Honestly, that Agile dashboard is a game changer once you start using it right. You can see sprint progress and blockers in real-time instead of waiting around for meetings or hunting down updates from everyone. Spotting bottlenecks becomes way easier - you'll catch them before they mess up your whole sprint. The burn-down data helps you make actual decisions about scope changes, not just guessing what feels right. Oh, and team velocity tracking is clutch for planning. Just make sure everyone's actually updating it daily or you won't get the full picture.
Retrospectives are perfect for fixing your dashboards - your team will straight up tell you what's broken or missing. Like when burndown charts make no sense or you're not tracking blockers right. Half the teams I know are staring at dashboards that don't actually help them decide anything (which is honestly just sad). Listen for complaints about visibility issues or metrics that make people do weird stuff. Communication gaps too. Then just throw those fixes into your next sprint. Whatever feedback you get should directly change which widgets you add or dump.
Honestly, just think of it like organizing layers. Put the big picture stuff up top - sprint progress, velocity, whatever the bosses need to glance at. Below that, add the nitty-gritty details your team actually uses daily. You can set it up so people click deeper if they want more info, but keep the main screen clean. Oh, and definitely let different roles customize their view - your PO doesn't care about the same metrics as your devs. Makes everyone's life easier when they see what matters to them first.
Honestly? Data overload will kill you first. Teams want to track literally everything and suddenly your dashboard is completely useless. Pick maybe 3-5 metrics that actually matter for decisions - that's it. People will hate it at first too, thinking you're spying on them. Can't blame them really. Get them involved in choosing what to track so it feels less creepy. Oh and integrating your tools is gonna be a nightmare if they don't work together. Just start manual if you have to, then automate the stuff that's actually worth it later.
Honestly, feedback loops are what separate useful dashboards from those pretty-but-pointless ones we've all seen too many times. Your dashboard stops being just a static report and actually starts driving real improvements. Collect regular feedback from your team, stakeholders, whoever's using it - then actually update your metrics based on what they tell you. Sprint retros are perfect for this stuff. The whole point is showing what people need to see, not just what looks impressive. Start simple though - maybe just add a feedback widget or do monthly review sessions with your team.
Tracking historical data in your Agile dashboard is honestly a game-changer. You'll start seeing actual velocity trends instead of just wing-it estimates. Bottlenecks become obvious when you look at multiple sprints - way better than that "sprint felt rough" gut feeling we all have. Your team's real improvement shows up in the numbers over time. Stakeholders eat this stuff up too since they get concrete progress reports, not just individual sprint updates. Oh, and don't try analyzing patterns until you've got 6-8 sprints worth of data - anything less is pretty much useless.
Dude, agile dashboards basically put everyone's work out in the open - there's literally no hiding when you're falling behind. Everyone can see who's working on what, what's stuck, where the bottlenecks are. Not gonna lie, it feels weird at first being that exposed. But that's exactly why it works! When your progress (or lack of it) is sitting right there on the board for the whole team to see, you can't just let stuff slide into your inbox and hope people forget. People actually start speaking up about problems early instead of panicking last minute. The visibility thing is uncomfortable but honestly pretty effective.
Honestly? Scrum and Kanban are your best bet for dashboards. Scrum's great because you can see sprint progress and those burndown charts everyone obsesses over - makes daily standups way less awkward when people ask how things are going. Kanban dashboards instantly show you where stuff gets stuck, which is kinda the whole point. SAFe works too since you're juggling multiple teams and need that overview. Oh, and don't overthink it - just build around whatever methodology you're already doing and focus on the metrics that actually matter for your specific meetings.
-
Innovative and attractive designs.
-
Much better than the original! Thanks for the quick turnaround.