Manufacturing Product Key Performance Metrics Dashboard
Try Before you Buy Download Free Sample Product
Audience
Editable
of Time
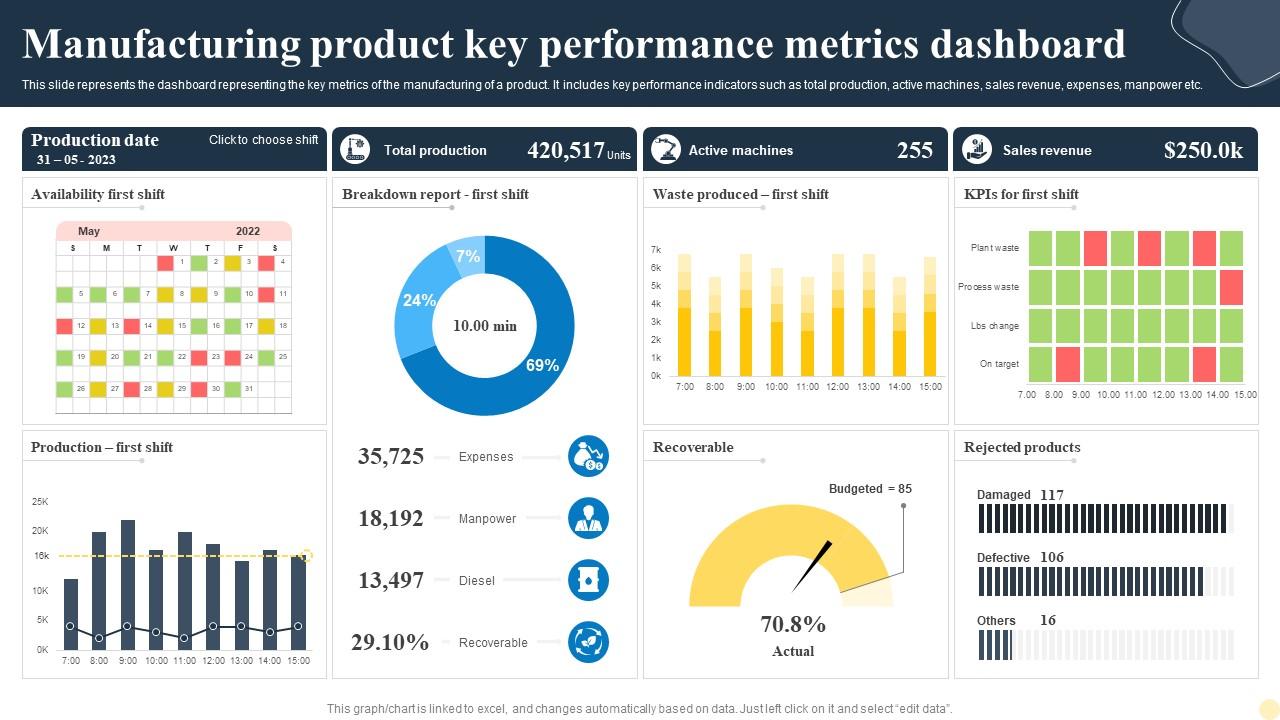
This slide represents the dashboard representing the key metrics of the manufacturing of a product. It includes key performance indicators such as total production, active machines, sales revenue, expenses, manpower etc.
People who downloaded this PowerPoint presentation also viewed the following :
Manufacturing Product Key Performance Metrics Dashboard with all 7 slides:
Use our Manufacturing Product Key Performance Metrics Dashboard to effectively help you save your valuable time. They are readymade to fit into any presentation structure.
FAQs for Manufacturing Product Key
OEE is huge - tracks how your equipment's actually doing vs what it could do. Seriously game-changing once you see those numbers. Cycle time's next, helps you find where things are getting stuck. First-pass yield catches quality problems early (way cheaper than fixing them later, trust me). Oh and basic cost per unit - kinda boring but you need it. Those four will give you a solid view of what's happening. Don't go crazy adding more metrics right away though, get these working first then build from there.
Start with your big business goals - what's actually driving success? Revenue, cost cuts, customer happiness, whatever. Then work backwards to find manufacturing metrics that feed into those outcomes. Don't just track output volume because it looks cool on dashboards (guilty of this myself). If profit's the real target, efficiency ratios and waste reduction matter way more. Your production, quality, and maintenance numbers should all connect back to the main objectives somehow. Oh, and review these regularly - priorities shift faster than you'd think.
Track stuff like equipment availability and mean time between failures - basically figure out which machines are causing you the most headaches. Once you start monitoring OEE regularly, you'll be shocked at the patterns that pop up. One team I know about dropped their downtime by 30% just from having better visibility. Set up alerts when things hit certain thresholds so you can catch issues early instead of scrambling later. Oh, and don't go crazy with metrics at first - pick 3-4 downtime KPIs and check them weekly. You've gotta walk before you run, you know?
So data analytics turns all that messy manufacturing data into something you can actually use for tracking KPIs. You know how annoying it is pulling numbers from different systems manually? This automates that whole headache and gives you real-time dashboards showing what's happening. The cool part is finding patterns you'd miss - like machine temperature affecting defect rates or how shift changes mess with productivity. Plus you get heads up when KPIs start drifting. Honestly, just pick your most important metrics first and figure out what data sources you can connect automatically. Way easier than you'd think.
Pull your data from the last 6-12 months first - that's your starting point. Industry benchmarks are helpful for context but don't just copy them blindly since your setup is probably different. The key is setting targets that push your team without crushing their morale (learned that one the hard way). Consider what your equipment can actually handle and where your team's skills are right now. Oh, and make sure you're tracking stuff that actually impacts your profits, not just numbers that look impressive on paper. Start a bit conservative then tweak things every quarter based on real results.
So here's the thing - quality control is basically the domino that knocks everything else over. Bad defect rates? Your efficiency tanks from all the rework, costs go up from waste, and delivery times get screwed because you're fixing stuff. I swear one terrible quality day can wreck your entire metrics dashboard. But it works the other way too. Nail your quality consistently and suddenly your equipment effectiveness shoots up, customers are happier, costs look amazing. Track those quality trends weekly - you'll spot which ones predict disasters in other areas before they hit.
Dude, engaged workers are straight up 20-25% more productive than checked-out ones. Plus way fewer defects. I've actually watched plants where engagement tanked first, then production issues followed a few weeks later - weird but consistent pattern. Your best employees spot equipment problems early before they turn into expensive disasters. Safety incidents? Almost always correlate with low engagement scores. Honestly, tracking engagement alongside your normal metrics might predict efficiency drops better than anything else. When people give a damn about their work, cycle times improve and downtime drops. It's like having an early warning system you didn't know existed.
Look, lead time tracking is basically your early warning system for supply chain disasters. You'll catch which suppliers always run late and where your own processes get stuck. Track your top 10 critical components first - that's honestly the fastest way to see results. Once you spot the patterns, you can push back on vendors with actual data, tweak your inventory, and stop making impossible promises to customers. It's kinda like being a detective for your own operation. The bottlenecks become super obvious when you measure each stage properly.
So inventory turnover is basically how fast you're moving stuff through your business - raw materials, finished products, all of it. You calculate it by dividing cost of goods sold by your average inventory value. Higher numbers are good because you're not sitting on dead stock that ties up your cash. Honestly, it's one of my favorite metrics for figuring out if your production planning is actually working. When turnover starts dropping, you're probably making too much stuff or your demand forecasting is off. I'd check it monthly and compare against what others in your industry are doing.
Look at your KPIs - that's where you'll find the money drains. OEE, scrap rates, energy per unit, labor productivity ratios. Downtime might be destroying you, or maybe material waste is way higher than you thought. Inventory turnover is honestly one of the best indicators but everyone sleeps on it. Short sentences here work well. Once your dashboard shows the worst spots, focus there first. That's where improvements will actually move the needle instead of just keeping you busy.
Honestly, MES systems like Wonderware or Ignition work great for real-time stuff. SAP and Oracle have KPI dashboards too, but they're kind of overkill unless you're huge. I've actually seen smaller companies crush it with just Tableau or Power BI - way cheaper and connects to whatever data you've got. The thing that kills most KPI projects? Manual data entry. Nobody keeps that up. So whatever you pick needs to pull from your equipment automatically. Oh, and map out what data you can actually get first - saves you from buying something fancy that won't work with your setup.
Your KPIs need to actually tell people what to do next. OEE tanks? Cool, now what - check machine calibration or review how shifts hand things off. Don't just stare at red numbers. I'd honestly start with maybe 3-5 key ones and build your processes around those first. You'll want regular check-ins to spot trends and figure out what's actually causing issues. Here's the thing though - you gotta track whether your fixes worked. Otherwise you're basically just hoarding spreadsheets. Close that loop by seeing if your changes moved anything. Build some standard procedures around each KPI so people know their next move.
Ugh, when you miss those manufacturing targets, everything goes sideways fast. Costs spike. Deliveries get delayed and customers start complaining - which is honestly the worst part of this job sometimes. Your team loses steam, management breathes down your neck asking why efficiency tanked. Then quality starts slipping because everyone's rushing to catch up, making things even messier. Weekly team huddles are a lifesaver though. Catch the bottlenecks early before they completely wreck your numbers. Trust me on this one.
Just build them into your normal KPIs instead of making separate reports. Track energy per unit, waste ratios, water usage - stuff like that. Honestly, those standalone "sustainability dashboards" are where good intentions go to die. Pick 2-3 things that actually affect your costs first - energy efficiency hits both your wallet and the planet. Then make your plant managers report weekly on them, same as safety numbers. My old boss used to say if it's not on the weekly scorecard, it doesn't exist. Smart approach if you ask me.
Honestly, data quality is gonna be your worst enemy here. All your systems probably don't play nice together - it's like having puzzle pieces from totally different sets. Defining what "good" actually means gets tricky too since every production setup is different. Real-time stuff? That's a whole other mess because everything's constantly changing. Oh, and don't try to track everything at once - you'll go crazy. Pick maybe 3-5 KPIs that actually matter, nail those down first. Once they're bulletproof, then you can think about expanding.
-
Visually stunning presentation, love the content.
-
The presentations are very helpful. I am always able to get appropriate templates for the different topics related to my profession.