Production Metric Dashboard Implementing Lean Production
Try Before you Buy Download Free Sample Product
Audience
Editable
of Time
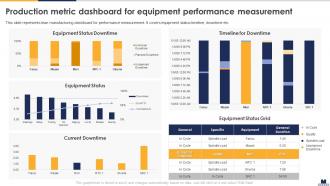
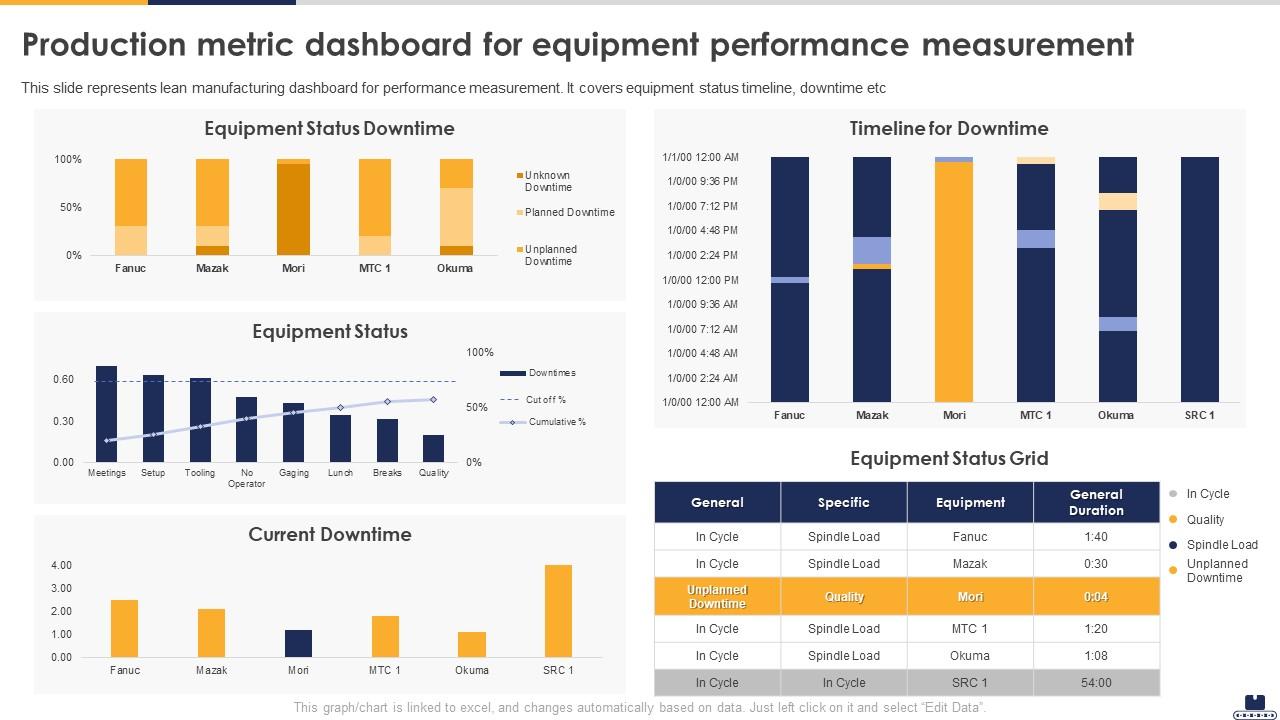
This slide represents lean manufacturing dashboard for performance measurement. It covers equipment status timeline, downtime etc.
People who downloaded this PowerPoint presentation also viewed the following :
Production Metric Dashboard Implementing Lean Production with all 7 slides:
Use our Production Metric Dashboard Implementing Lean Production to effectively help you save your valuable time. They are readymade to fit into any presentation structure.
FAQs for Production Metric Dashboard
Key lean production KPIs include overall equipment effectiveness (OEE), cycle time, takt time, first-pass yield, inventory turnover, and lead time reduction metrics. These indicators enable manufacturers to streamline operations by identifying bottlenecks, minimizing waste, and optimizing resource allocation, with many production facilities finding that systematic KPI tracking delivers improved efficiency and competitive advantage.
Organizations can effectively measure waste reduction through key performance indicators including defect rates, inventory turnover ratios, cycle time reduction, overall equipment effectiveness, and material utilization percentages. Manufacturing companies often track these metrics using digital dashboards and real-time monitoring systems, enabling continuous improvement initiatives that streamline operations, reduce costs, and enhance competitive advantage in increasingly efficiency-focused markets.
Cycle time measures the total duration from production start to completion, serving as a critical indicator of process efficiency, resource utilization, and workflow bottlenecks in lean manufacturing systems. By tracking cycle time variations, manufacturers can identify improvement opportunities, optimize production schedules, and enhance customer responsiveness, with many organizations finding that reduced cycle times directly correlate with increased profitability and competitive advantage.
Value stream mapping enhances lean production metrics understanding by visualizing material and information flows, identifying waste sources, and revealing bottlenecks that traditional metrics might miss. This comprehensive approach enables manufacturers to connect process inefficiencies directly to performance indicators like cycle time and throughput, while automotive and electronics companies find that mapping delivers clearer insights into operational improvements and competitive positioning.
Employee productivity metrics in lean environments include cycle time per worker, value-added time ratios, defect rates per employee, cross-training capabilities, and continuous improvement suggestions implemented. These measurements enhance operational efficiency by identifying skill gaps, streamlining workflows, and recognizing high performers, with many manufacturing organizations finding that employee-focused metrics ultimately deliver faster production cycles and improved quality standards.
Just-In-Time significantly enhances lean production metrics by reducing inventory costs, minimizing waste, and accelerating cycle times through demand-driven manufacturing processes. This approach enables manufacturers across automotive, electronics, and consumer goods sectors to achieve lower carrying costs, improved cash flow, and faster response times, ultimately delivering enhanced operational efficiency and competitive advantage in increasingly dynamic markets.
Methods to track inventory turnover improvements include ABC analysis for prioritization, just-in-time monitoring systems, cycle counting audits, demand forecasting analytics, and supplier performance metrics. These approaches streamline operations by reducing carrying costs, minimizing waste, and enhancing cash flow, with many manufacturing and retail organizations finding that strategic inventory optimization ultimately delivers competitive advantage and improved profitability.
Organizations measure lead time by tracking production from customer order initiation to final delivery, using value stream mapping, digital workflow systems, and real-time monitoring tools. Manufacturing companies, logistics providers, and service organizations implement automated tracking systems, standardized measurement points, and continuous data collection processes, ultimately delivering faster cycle times, reduced bottlenecks, and enhanced customer satisfaction.
Best practices for aligning lean production metrics with overall business goals include establishing clear KPI hierarchies, connecting operational metrics to financial outcomes, implementing cross-functional dashboards, conducting regular metric reviews, and ensuring leadership alignment. These approaches streamline decision-making by creating visibility across departments, enabling faster response times, and ultimately delivering improved profitability and competitive advantage.
Visual management techniques enhance lean metrics comprehension by displaying key performance indicators through dashboards, color-coded charts, status boards, and real-time data visualization tools. These approaches streamline information processing, enable faster decision-making, and improve team alignment, with manufacturing and healthcare organizations finding that visual displays significantly reduce response times to performance variations while fostering continuous improvement culture.
Organizations face challenges including resistance to change from employees, difficulty measuring intangible improvements, lack of standardized data collection systems, and inadequate training on lean methodologies. These obstacles often require strategic change management, comprehensive staff education, and robust measurement frameworks, with many manufacturing and service companies finding that phased implementation approaches help minimize disruption while building organizational buy-in.
Lean production metrics vary by industry focus, with manufacturing emphasizing cycle time and defect rates, healthcare tracking patient flow and readmission rates, and retail monitoring inventory turnover and customer satisfaction scores. While core principles remain consistent across sectors, each industry adapts measurements to address specific operational challenges, regulatory requirements, and customer expectations, ultimately delivering improved efficiency and competitive advantage tailored to their unique market demands.
Initial setup time is crucial in lean production evaluations because it directly impacts cycle efficiency, machine utilization rates, and overall throughput capacity. Reducing setup time through SMED (Single-Minute Exchange of Die) techniques enables manufacturers to achieve smaller batch sizes, faster changeovers, and more responsive production scheduling, ultimately delivering improved operational flexibility and reduced inventory costs.
Organizations use root cause analysis to improve lean production metrics by systematically identifying underlying issues behind waste, defects, and inefficiencies through techniques like fishbone diagrams and five-whys analysis. This approach enables manufacturers to address fundamental problems rather than symptoms, ultimately reducing cycle times, minimizing inventory costs, and enhancing overall equipment effectiveness across production lines.
Lean production metrics software includes Tableau, Power BI, Minitab, JMP, SAP Manufacturing Execution Systems, and specialized tools like KPI dashboards and real-time monitoring platforms. These technologies streamline data collection, automate reporting, and enhance visibility across manufacturing operations, with many organizations finding that integrated analytics deliver faster decision-making, reduced waste, and improved operational efficiency.
-
Excellent work done on template design and graphics.
-
World-class PowerPoint designs that are fully customizable!