


 Customer Reviews
How is your production line currently performing? Do you know its efficiency? Are there any concerns? Where are the bottlenecks?
Manufacturing operations are intricate. Even the smallest manufacturers can struggle to keep track of everything, let alone know about their multiple production lines and locations.
Imagine having a real-time view of your entire manufacturing operation, including the efficiency of each production line, on a single screen.
Dashboards can assist you in doing just that.
Now, consider driving a car in which the dashboard displays the previous day's speed, and distance traveled. It may sound strange, but many operations and production managers operate their factories in this manner. They are aware of the previous day's output and overall equipment effectiveness (OEE), but this is of little help in maximizing performance today. That is why, in this machine-driven industry where even small amounts of data can make a big difference, professional dashboards are indispensable for optimizing your performance.
You must be aware of your equipment when using this production dashboard. What they produce over time will reveal the market share of each of these, allowing you to prioritize the most productive ones. You will be aware of your assets while assessing this, which will help you evaluate the return on assets.
So, are you ready to get a real-time view of your manufacturing lines? The Production Dashboard PPT Templates from SlideTeam can provide you with production visibility while reducing errors and taking care of manufacturing issues.
Have a look!
Template 1: Product Manufacturing Dashboard PPT Template
Our product manufacturing dashboard PPT Template allows you to track the most important production KPIs. With this useful analytics tool, you can track and optimize production quality while also efficiently managing overall plans and productivity. Use this template to identify which of your machines is real value for money. Get this template now!

Template 2: Production Metrics Dashboard For Manufacturing Company
Having all of your company's important key performance indicators at your fingertips provides a great overview that aids in optimization. Using our template, assess your organization's overall production capacity, quantity, availability, etc. Production metrics dashboard design will assist you in focusing on every minute detail that might make a huge difference. Get it now!

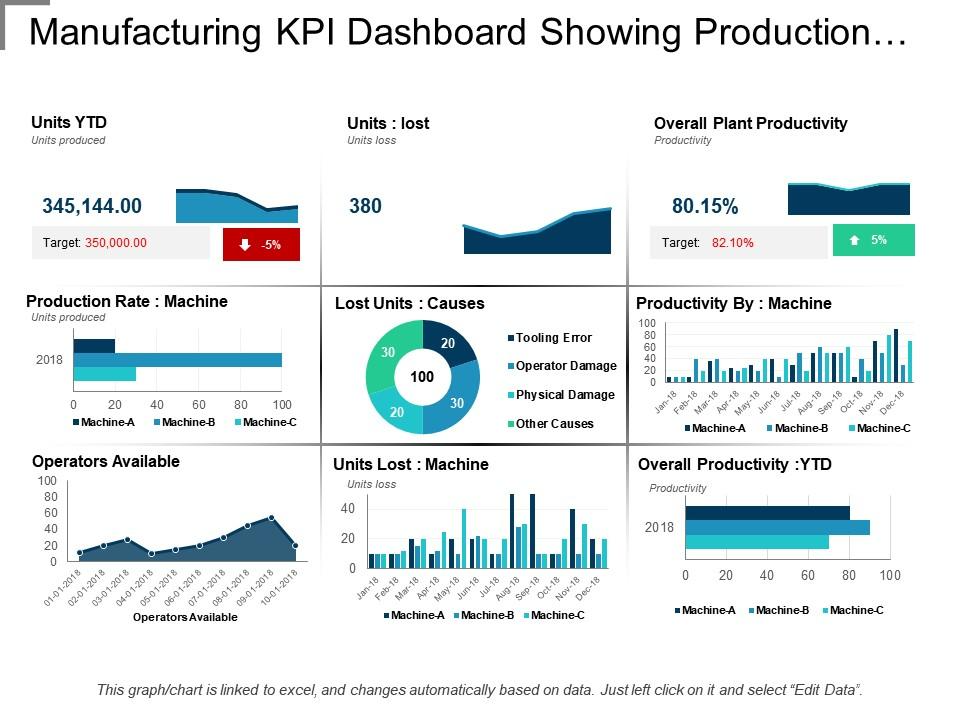
Template 3: Manufacturing KPI Dashboard Showing Production Rate and Lost Units
Incorporate our manufacturing KPI Dashboard PPT Template that shows production rate and wasted units, allowing you to track the productivity levels of a manufacturing process. This slide will assist you in defining metrics to measure, analyze, and optimize production processes in terms of quantity, quality, and cost aspects. Download now!
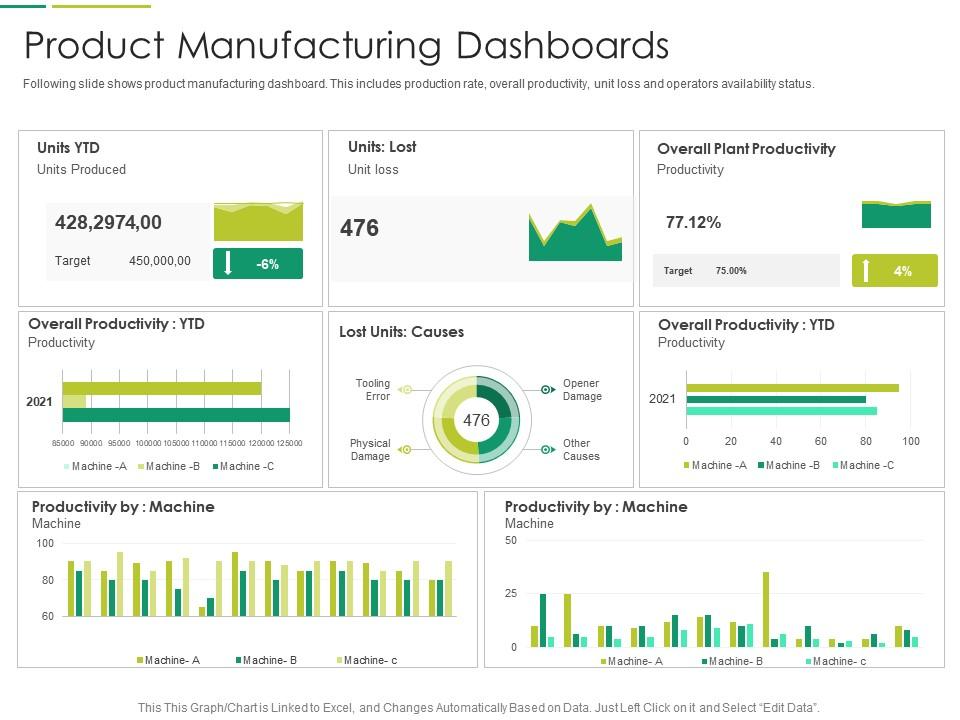
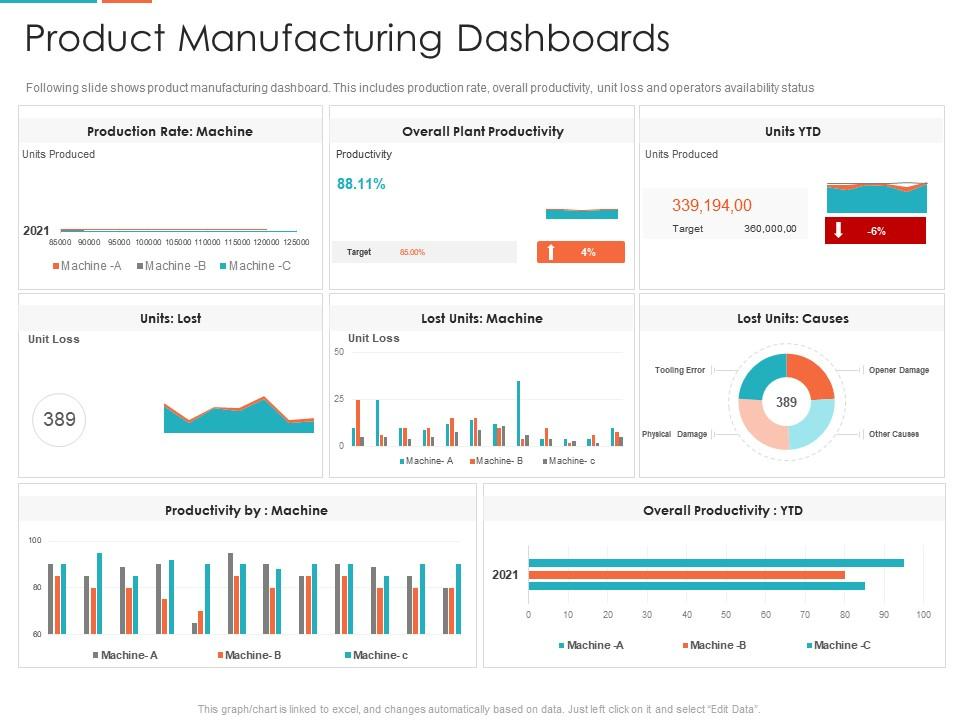
Template 4: Product Manufacturing Dashboards PPT Slide
SlideTeam’s product manufacturing dashboard PPT Layout eliminates the need to spend time gathering and analyzing production data. Everything is right there for you when you need it. This slide includes production rate, overall productivity, unit loss, and operators' availability status. Get your slide instantly!
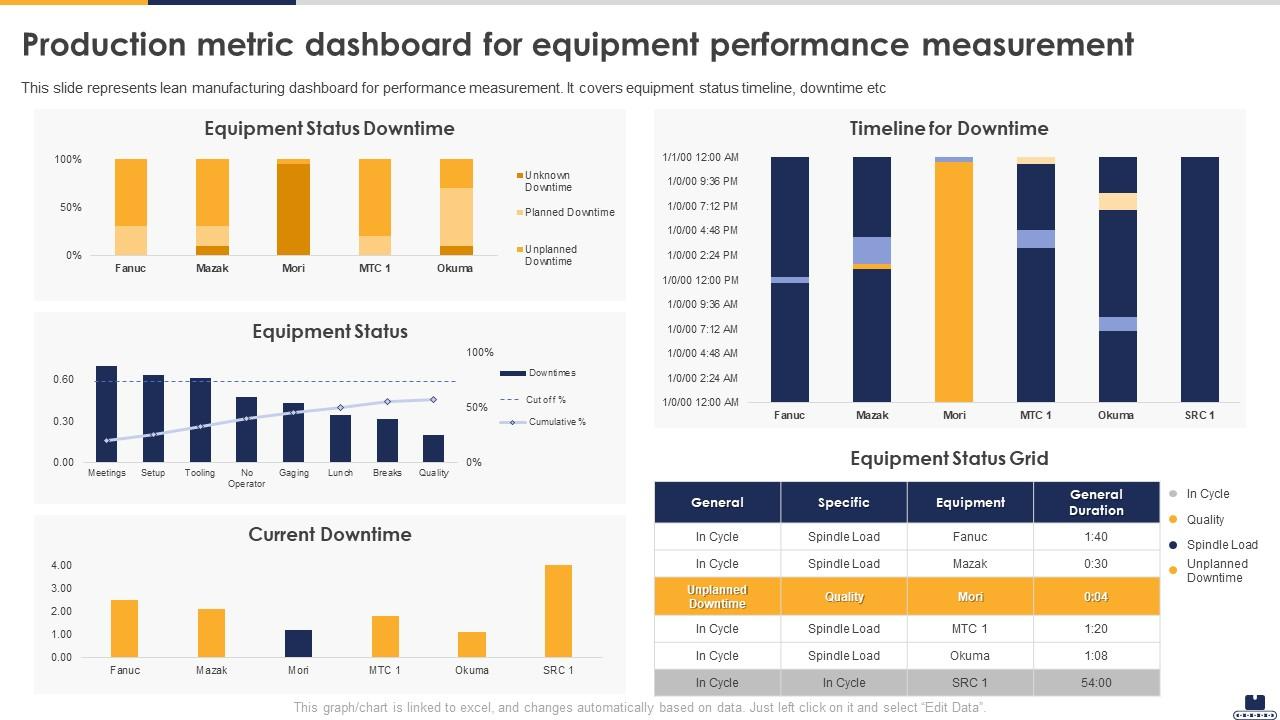
Template 5: Production Metric Dashboard Implementing Lean Production
With our slide, you can easily track the productivity levels of your manufacturing process. This production metric dashboard PPT Template covers equipment status timeline, etc. Use this dashboard for assessing real-time issues and taking corrective measures accordingly. Timeline for downtime is a major advantage that the use of this template provides. Get it right away.
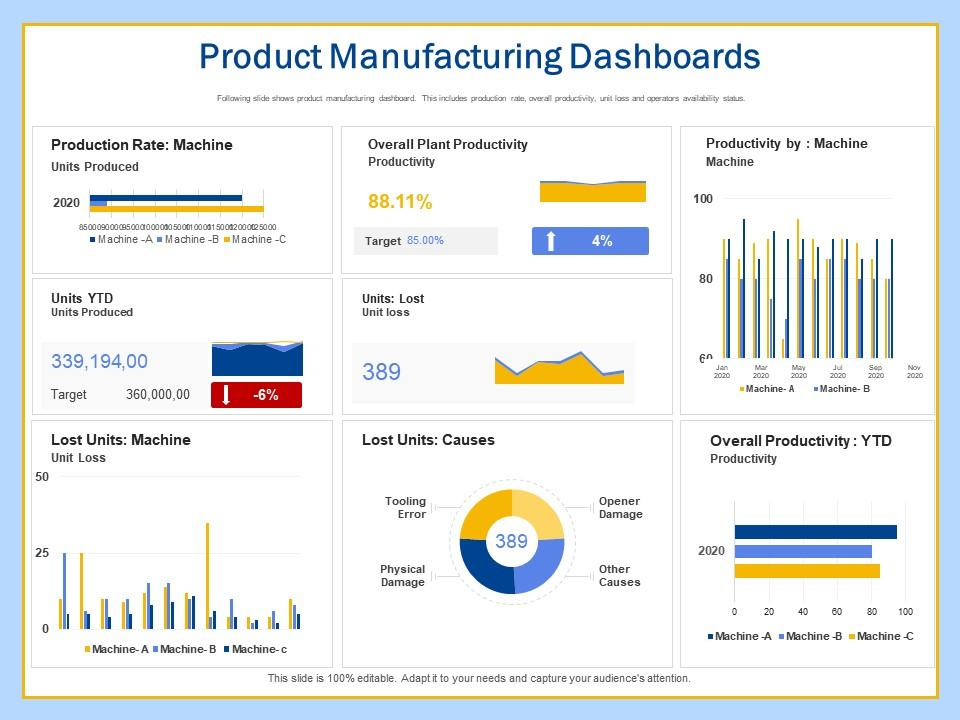
Template 6: Product Manufacturing Dashboards PPT Design
Enhance your business operations with our product manufacturing dashboard PPT Template. This platform allows you to showcase details regarding product rate, overall plant productivity, and so on. Easy to frame solutions when in need, this template helps in numerous ways. Grab this design right now!
Template 7: Manufacturing KPI Dashboard Showing Downtime By Cause
With the ever-growing industries, a production dashboard appears to be essential for businesses to run their manufacturing operations and recognize the value of data. This dashboard template gives you an insight into the company's downtime and its particular causes. Deploy it now and take corrective action.

Template 8: Product Manufacturing Dashboards PPT Layout
Monitor the essential KPIs of production at one central place, a product manufacturing dashboard. Inclusive of parameters such as units lost, causes, etc., this template lends a helping hand in terms of improving the overall quality of your manufacturing process. Get it now!
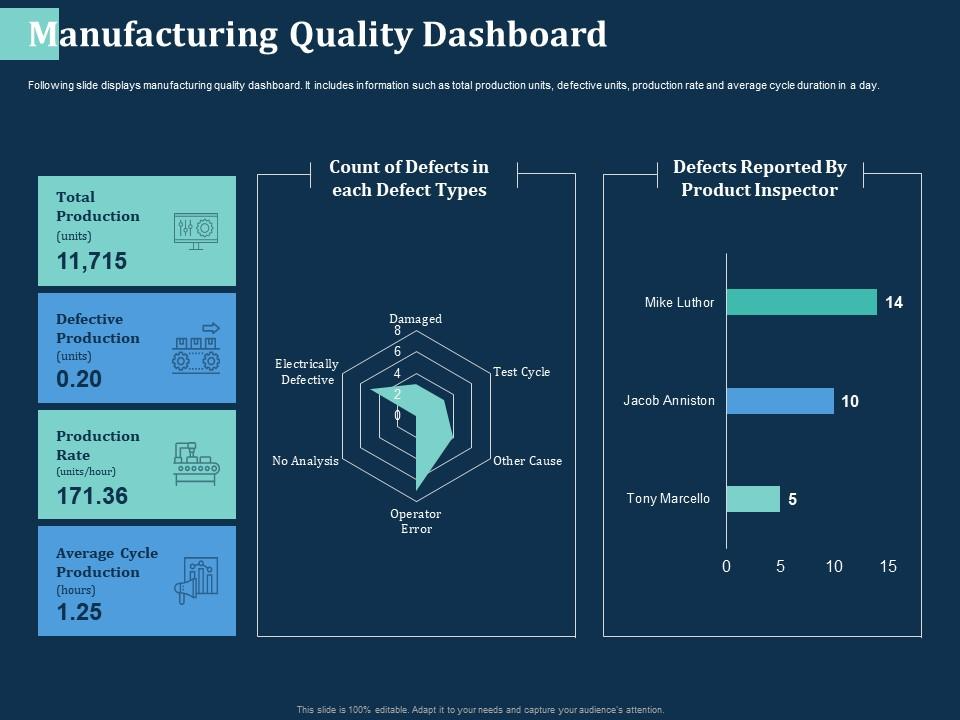
Template 9: Manufacturing Quality Dashboard PPT Template
On a single platform, you can monitor your entire manufacturing performance and quality. This dashboard can assist you in making decisions to optimize processes from a single location. Information such as total production units, defective units, production rate, and average cycle duration in a day is all available in this design. Get it now!
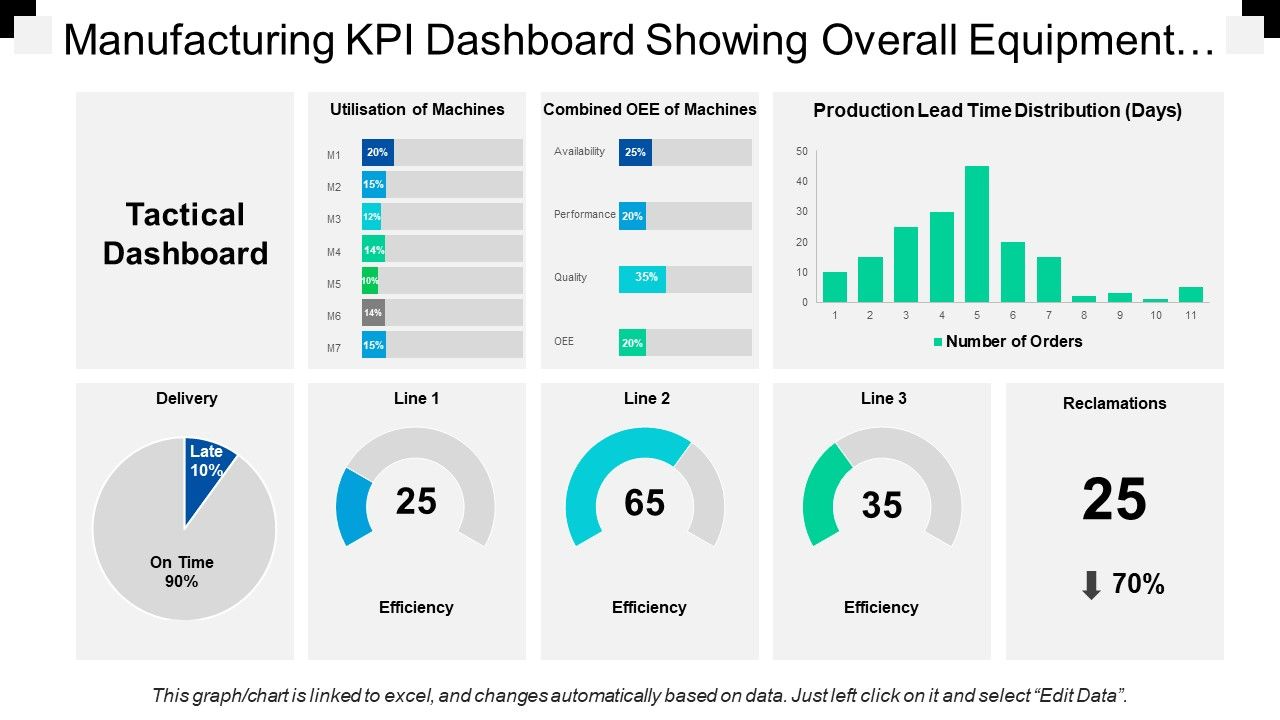
Template 10: Manufacturing Overall Equipment Effectiveness Dashboard
Deploy this dashboard template and get acquainted with how effective and productive your organization’s equipment are. Know the utilization of machines, combined OEE of machines, etc., with this slide. Ensure all your deliveries are on time. Download this slide instantly.
Final Word!
When used correctly, production dashboards can be a valuable analytics tool for lean manufacturers. That is when the dashboard is used to display the most immediately understandable, relevant, and high-priority information that employees can act on. Today's factories are becoming more connected with real-time data collection, management, and analysis. A production dashboard gives users like operators, managers, and support staff a centralized location to easily review this data.
Better decisions result from better information, and a real-time display of the most important information via a digital dashboard means that decisions can be made well and quickly.
Now is the right time for you to make some effective business moves.
P.S.- Try operational dashboards to monitor and assess your company's activities. Read our blog now!
FAQs On Production Dashboard
What is the function of a Dashboard?
Dashboards provide an interface of useful gauges and charts that allow us to understand key performance indicators quickly. Some dashboards even allow you to modify your activities in order to improve performance. Dashboards, in other words, are interactive control centers that highlight all of your essential data and information. Listed below are the few most important functions:
1- Complete account visibility.
2- A method for generating detailed reports and presentations with a single click.
3- The ability to recognize emerging trends
4- Identifying data outliers, correlations, and other patterns quickly.
5- The ability to make better decisions.
What are the steps to create manufacturing dashboards?
Real-time dashboards can help you ensure that you see data in an accurate light and correct inefficiencies. You can also identify areas for optimization and effectively communicate with team members.
If you are creating a dashboard for the first time or looking to improve your organization's reporting, keep the following steps in mind:
1- Determine data requirements- Consider what type of data corresponds with each step of your manufacturing process.
2- Set goals- Look for any non-lean component of the manufacturing process to guide you to specific, measurable, achievable, results-focused, and time-bound goals.
3- Determine key performance indicators (KPIs)- These metrics assist stakeholders in understanding their goals and defining and measuring success.
4- Encourage data literacy- Dashboards are an effective tool for those who understand them.
5- Create the dashboard- A successful design must be both visually appealing and functional.
6- Apply lean manufacturing principles- Both dashboards and lean manufacturing revolve around refining and improving processes.
What are the different types of dashboards?
Dashboards are classified into four types:
- Strategic: Centred on long-term plans and high-level metrics
- Operational: Shorter time frames and operational processes are shown.
- Analytical: Consists of massive amounts of data generated by analysts.
- Tactical: Used by the mid-management to track performance.
What are the benefits of using a dashboard?
A dashboard is a one-page summary of information analysis that is easy to read. It provides a high-level overview of your system. There are numerous benefits to utilizing this tool. Among the most significant advantages are:
- Customizable- Dashboards can be tailored to specific users and expectations.
- All-in-one- At a glance, this tool provides an overall situation report of the desired information.
- Drill into detail- Dashboards are designed to allow users to drill down as far as they need to by simply selecting the desired variable or object.
- Intuitive data presentation- Dashboards are designed to be user-friendly.
- Mobile device compatibility- Most dashboard software is designed to work with any mobile device.


![Top 15 Operational Dashboard Templates to Capture Your Organizational Performance [Free PDF Attached]](https://www.slideteam.net/wp/wp-content/uploads/2022/04/banner-4.png)


