

Product manufacturing dashboards digital transformation of workplace




Try Before you Buy Download Free Sample Product
 Impress Your
 Audience
 100%
100% Editable
 Save Hours
 of Time


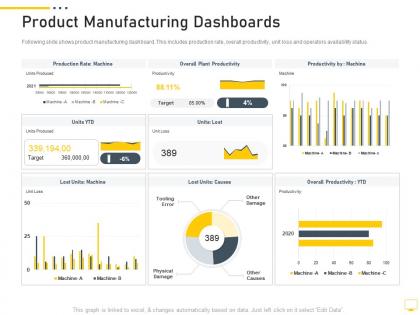
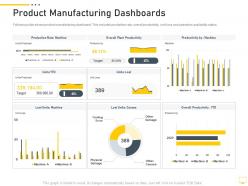
Following slide shows product manufacturing dashboard. This includes production rate, overall productivity, unit loss and operators availability status.
People who downloaded this PowerPoint presentation also viewed the following :
Product manufacturing dashboards digital transformation of workplace with all 2 slides:
Use our Product Manufacturing Dashboards Digital Transformation Of Workplace to effectively help you save your valuable time. They are readymade to fit into any presentation structure.
FAQs for Product manufacturing dashboards digital
Focus on what actually moves the needle - OEE, production volume vs targets, defect rates, and cycle times. Downtime tracking is massive too. I've literally seen entire shifts get saved just by catching equipment problems early through alerts. Inventory levels and cost per unit matter obviously. But here's the thing - don't go overboard with like 20 different metrics. Start with maybe 5-6 that your team will actually check every day. Labor efficiency is good to track too. Once you've got those down, then add more based on what's actually helping you make better decisions. Otherwise you'll just drown in data.
Dude, real-time dashboards are clutch because you catch problems instantly instead of finding out way too late. Machine performance, quality stuff, bottlenecks - you'll see everything as it happens so your team can actually fix things. Honestly beats the hell out of waiting for those end-of-shift reports that nobody reads anyway. The visual trends make it super obvious when something's off, like efficiency tanking before a machine craps out. Oh, and definitely set up alerts for your important metrics. That way the dashboard actually pings you when stuff goes wrong instead of just sitting there looking pretty.
So for manufacturing dashboards, I'd go with Tableau, Power BI, or Grafana. Tableau's amazing for complex stuff but honestly? Pretty expensive and sometimes total overkill. Power BI works great if you're already using Microsoft - way more budget-friendly too. If you've got tons of real-time IoT sensors on the floor, Grafana handles that really well. Oh and QlikSense is decent with big datasets. My buddy at the plant swears by it. First thing though - figure out what data sources you need to pull from, then just try the free trials. See what feels right for your team.
Real-time data from your production line shows exactly where things get stuck. Cycle times, queue lengths, throughput - you'll see it all. When one station has crazy long wait times compared to others, boom, there's your bottleneck. Honestly the visual aspect makes problems so obvious it's almost annoying you didn't spot them before. You need sensors feeding data from each step though, otherwise you're flying blind. Oh and definitely set up alerts when numbers hit certain limits - way better than discovering a mess hours later when it's already screwed up your whole downstream flow.
Think of IoT sensors as your automatic data collectors - they grab real-time info from machines and production lines without anyone having to manually check stuff. Temperature, vibration, energy usage, throughput numbers. All flows straight to your dashboards. Pretty neat how it connects everything from conveyor belts to quality systems, honestly. You get this whole picture of what's happening across your operation. I'd say start with whatever machines are most critical (the ones that make you sweat when they go down), then build out from there. Makes decisions way faster when you can actually see what's going on.
Honestly, dashboards are clutch for lean manufacturing. Real-time data lets you catch waste before it gets out of hand - overproduction, waiting, defects, all that stuff. Set up alerts for equipment going down or quality issues. Way better than constantly walking around checking everything manually (though you still gotta do some of that). Your team can see performance metrics instantly and actually do something about it. I'd start with tracking cycle time, OEE, and defect rates. Makes spotting patterns so much easier when it's all visual like that.
Honestly, predictive analytics is a game-changer for catching quality issues early. Your sensors and historical data basically work together to spot trouble before it hits - equipment wearing down, materials acting weird, processes drifting off track. Way better than finding out after you've already made a bunch of defective parts, you know? Instead of scrambling to fix problems after the fact, you can actually get ahead of them. I'd start by figuring out your worst quality headaches - like the top 3 things that always seem to go wrong. Then dig into what data patterns might've predicted those issues. It's not magic, but it's pretty close.
Focus on inventory turnover, order fulfillment times, and on-time delivery percentages first. Supplier lead times are huge too - honestly, suppliers mess up way more than people expect. Cost per unit and warehouse capacity will catch budget problems before they blow up. Oh, and supplier performance scores! Those tank first when everything's about to go sideways. Real-time dashboards are ideal but daily updates work fine too. Supply chain stuff moves crazy fast though. Start with these basics and build from there - you don't need everything at once.
So you'll want to tailor dashboards based on who's actually using them. Operations managers need the real-time stuff - production metrics, quality scores, bottleneck alerts. Floor supervisors care about equipment status and shift performance. But executives? They want the big picture KPIs like OEE and delivery performance, not whether machine
-
Wonderful templates design to use in business meetings.