
Food Manufacturing Plant Management Dashboard


Try Before you Buy Download Free Sample Product
 Impress Your
 Audience
Editable
of Time


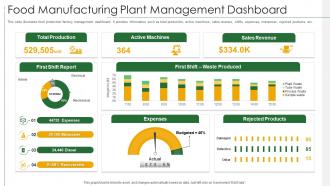
This slide illustrates food production factory management dashboard. It provides information such as total production, active machines, sales revenue, shifts, expenses, manpower, rejected products, etc.
People who downloaded this PowerPoint presentation also viewed the following :
Food Manufacturing Plant Management Dashboard with all 7 slides:
Use our Food Manufacturing Plant Management Dashboard to effectively help you save your valuable time. They are readymade to fit into any presentation structure.


FAQs for Food Manufacturing
Start with OEE - that's your main number combining availability, performance, and quality. Track cycle times and throughput too. Downtime is honestly the worst, so definitely monitor that plus changeover times. Oh, and yield percentages are huge for obvious reasons. Labor efficiency matters a ton, especially right now with everyone struggling to find good workers. Don't sleep on material waste rates either since food costs are brutal. Quality stuff like defect rates and first-pass yield round it out. You can always add more later, but these will get you started.
Dude, you'll catch problems way before they blow up - temperature spikes, equipment going haywire, quality issues happening right now instead of hours later when it's too late. Those visual dashboards actually make sense of all that messy production data (seriously, spreadsheets are the worst). Bottlenecks become obvious, so you can tweak things on the fly. Your whole team sees what's happening across different lines at once. Oh, and set up alerts for the critical stuff - way better than staring at screens all day waiting for something to break.
So basically predictive analytics scans all your manufacturing data looking for weird patterns that usually mean trouble's coming. Temperature spikes, equipment starting to fail, contamination risks - it catches this stuff before it actually becomes a crisis. Way better than scrambling after something goes wrong, you know? Your sensors feed real-time info into these models, and when they spot something sketchy, boom - alert on your dashboard. Then you can jump on it right away. Honestly feels a bit like magic sometimes, having that heads-up about what might break next.
Just ask each team what decisions they're making every day, then build their dashboards around that. Production managers want real-time equipment stuff and throughput numbers. QA needs temp logs and contamination alerts - all that compliance tracking. Finance cares about cost per unit and waste percentages (they couldn't care less about conveyor speeds, honestly). Supply chain folks need inventory levels and how suppliers are performing. Set up role-based access so everyone sees their relevant metrics without all the extra noise. It's way more useful when people aren't drowning in data they don't need.
Start with real-time API connections to your main suppliers and logistics partners. That's honestly where you'll see the biggest impact. Go for the critical stuff first - inventory levels, delivery schedules, quality certs - then build out from there. Don't make my mistake of trying to integrate everything at once though. Total nightmare and you end up drowning in messy data. Stick with standardized formats like EDI or JSON, and set up automated alerts for when things go sideways. The real trick? Make sure your dashboard refreshes often enough to actually help you make decisions, not just look impressive in meetings.
Dashboards are honestly a game-changer for tracking stuff like ingredient usage, batch yields, and spoilage in real-time. Set up alerts when waste hits weird levels - I've seen companies save thousands just from that. Your dashboard should show inventory next to production schedules so you don't overorder (been there). You'll spot patterns too - like is it the equipment acting up or someone messing up the process? Oh, and don't go crazy at first. Track maybe 3-4 waste metrics until your team gets the hang of reading the data, then add more.
Honestly, drag-and-drop widgets are a game changer - your team can customize stuff without bugging IT constantly. Focus on one-click access to the big three: production rates, quality scores, inventory levels. The really good dashboards are almost boring because they're so simple to navigate. Mobile's crucial since you're definitely gonna be checking things while walking around the floor. Oh, and automated alerts save your sanity when things go sideways. Map out what your people look at most during their day - that'll tell you exactly how to arrange everything. Real-time data viz keeps all that complex manufacturing info actually readable.
So IoT sensors will totally change your food manufacturing dashboard. They track temperature, humidity, pressure - basically everything happening on your production line in real time. You can monitor cold storage temps, conveyor speeds, ingredient flow rates. Honestly the level of detail is kind of insane. Connect them to your dashboard and boom - instant alerts when things go wrong, plus you'll see historical trends. Oh, and don't go crazy trying to put sensors everywhere at first. Just hit your most critical spots and build from there.
Definitely focus on your HACCP critical control points and FDA inspection scores first. Temperature monitoring is absolutely critical - I've seen too many places get hammered for cold chain screwups. Track your allergen compliance rates and SQF/BRC audit scores religiously. Recall response times matter more than people think. Also keep tabs on labeling accuracy and supplier verification status since auditors love catching manufacturers on that stuff. Oh, and don't sleep on corrective action closure rates. Set up alerts when things start going south so you're not scrambling later.
Honestly, dashboards are game-changers for getting production and QA on the same page. Both teams see the exact same real-time data - quality metrics, schedules, issues as they pop up. No more playing phone tag or waiting for someone to loop you in via email (which always takes forever). QA catches a defect pattern? Production sees it instantly. Line goes down? QA knows right away and can adjust. The trick is actually showing stuff both teams need - not just pretty graphs that look impressive but don't help anyone decide what to do next.
So you know how your dashboard just shows what already happened? ML flips that around - suddenly you're getting heads up about equipment about to break or quality issues brewing. Pretty cool stuff. Historical data gets crunched to spot patterns you'd never catch, then flags weird stuff before it becomes expensive problems. Energy usage, ingredient timing, all that gets optimized automatically. Honestly feels a bit like magic sometimes. My advice? Pick whatever's driving you crazy right now - equipment downtime, waste, whatever - and start there. That's where you'll see the biggest wins first.
So basically you want to hook up your dashboard to pull from social media APIs, review sites, sales data - all that stuff. Multiple sources give you the full picture. Instagram mentions are gold, plus Google search volumes for ingredients and your own sales trends. Companies tracking hashtags like
-
Design layout is very impressive.
-
Great product with effective design. Helped a lot in our corporate presentations. Easy to edit and stunning visuals.