


Overall Equipment Effectiveness Dashboard For Manufacturing Company




Try Before you Buy Download Free Sample Product
 Impress Your
 Audience
 100%
100% Editable
 Save Hours
 of Time


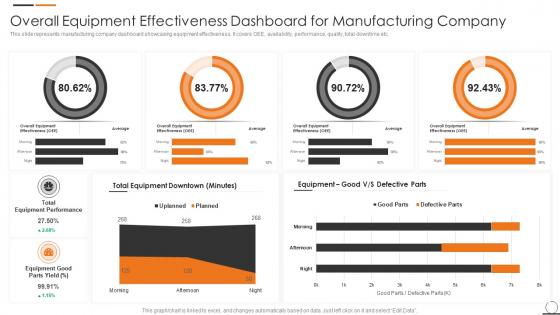
This slide represents manufacturing company dashboard showcasing equipment effectiveness. It covers OEE, availability, performance, quality, total downtime etc.
People who downloaded this PowerPoint presentation also viewed the following :
Overall Equipment Effectiveness Dashboard For Manufacturing Company with all 7 slides:





FAQs for Overall Equipment Effectiveness Dashboard
So OEE is basically your equipment's report card - it shows how well your machines are actually performing vs. perfect production. You've got three pieces: Availability (is it running when it should?), Performance (running at full speed?), and Quality (making good stuff?). Multiply those percentages together and boom, there's your OEE score. Most places shoot for 85% but honestly? 60-70% is way more realistic in a lot of industries - don't beat yourself up if you're there. I'd start by tracking each piece separately first. That way you can actually see where things are going sideways instead of just staring at one big number.
OEE is just Availability × Performance × Quality multiplied together. Break it down: availability is your actual operating time vs planned time, performance compares actual output to what you could theoretically make, and quality is good units vs total units. Each one's a percentage, so your final number will be too. World-class is supposedly 85% or higher - though honestly, that feels pretty ambitious when you're starting out. I'd track each metric separately first since it helps you figure out where you're actually bleeding efficiency. Way easier to fix problems when you know which bucket they're in.
Honestly, it's usually equipment just randomly breaking down that kills your OEE the worst. Material shortages are another pain - machines sitting there doing nothing while you wait for parts. Changeovers between products eat up way more time than they should, especially if your operators aren't smooth with the process yet. Quality problems force you to stop everything mid-run too. Oh, and maintenance that was supposed to take 2 hours but stretches into 6? Yeah, that'll wreck your numbers. I'd start by figuring out which one's hitting you most often and focus there first.
Check your OEE scores across machines and shifts - whoever's consistently scoring lowest is probably your bottleneck. Break it down by the three parts: availability tanking? You've got breakdown issues. Performance lagging? Speed problems. Quality dropping? Well, that one's obvious. Honestly, tracking hourly makes everything way clearer - you'll catch those weird afternoon slowdowns nobody talks about. I'd start with your worst performer and figure out which of the three components is actually screwing you over. Sometimes it's not what you think it is.
Yeah, so OEE gets hammered when you have quality issues or slow production - those are literally two-thirds of what goes into the calculation. Your quality rate tanks below 100% with defects, and performance drops when you're not hitting target speeds. The whole thing multiplies together with availability, which honestly makes the math kind of brutal. Even tiny drops can wreck your overall number. I'd start by figuring out your worst problem areas first. Is it mostly scrap you're dealing with, or cycle times dragging? Then just work through them one by one.
Most plants use SCADA systems and MES platforms to track machine states and production rates. IoT sensors help too. There's specialized OEE software like Vorne XL that turns all this data into dashboards your team can actually read. PLCs feed the raw numbers while digital displays keep operators updated. Here's the thing though - garbage data in means garbage insights out, no matter how slick your software looks. I'd start with your biggest bottleneck machines first. Don't try instrumenting your entire plant right away or you'll go crazy.
Yeah totally! You just need to get creative with how you define the metrics. Call centers can track tickets handled, hospitals measure bed utilization, delivery services count completed routes - that kind of thing. Quality gets weird though - maybe first-call resolution or customer satisfaction? Availability is basically your service uptime, performance is actual vs theoretical throughput. Honestly the hardest part is figuring out what counts as a "defect" in your service. Start by mapping out your service flow like it's a production line. Works pretty well once you wrap your head around it.
Dude, training your people is huge for OEE. It hits all three parts - availability, performance, quality. Good operators know how to run stuff properly, do basic maintenance, spot problems early. You'll get way fewer breakdowns that way. I've literally seen factories where bad training was killing their numbers more than anything else. Plus trained people run machines at the right speeds and catch quality issues before they turn into disasters. Oh, and don't try to fix everything at once - figure out your worst OEE problems first, then train around those specific areas.
Dude, real-time analytics is where it's at for OEE. Instead of finding out about problems days later through those awful spreadsheet reports, you're seeing availability and performance issues the second they happen. Sensors feed data straight from your equipment, so nothing gets missed. What really saves your butt though? Setting up alerts when downtime hits or performance tanks below whatever threshold you pick. Honestly beats the hell out of playing catch-up all the time. I'd focus on your most critical lines first - don't try to do everything at once or you'll go crazy.
So OEE benchmarks are all over the place depending on your industry. Automotive usually hits 60-80%, but food & beverage is lower at 45-65%. Pharma runs higher though - like 65-85% because they can't mess around with downtime on those crazy expensive processes. Most manufacturing sits around 60% overall. Anything above 85% is world-class but honestly pretty tough to maintain long-term. Discrete manufacturing usually beats process industries since there's less changeover headache. You're better off comparing yourself to similar operations in your sector rather than broad industry averages - equipment and production demands vary way too much.
Dude, Lean and Six Sigma are game-changers for OEE. They go after the big three killers - availability, performance, and quality issues. Six Sigma uses actual data to find root causes instead of just guessing what's broken. Meanwhile, Lean cuts waste in changeovers and downtime with stuff like SMED. Honestly? Start with basic 5S first - I've watched plants bump their OEE up 15-20% from that alone. Value stream mapping shows you where the real losses are hiding. The whole structured approach thing actually works because you're measuring and fixing actual bottlenecks, not just throwing solutions at problems.
Data accuracy is going to be your biggest headache - everything's scattered across different systems and manual entry creates tons of errors. Plus operators hate new tracking systems because they think you're spying on them (which... yeah, kinda true). Everyone argues about what counts as "planned" vs actual downtime too. That debate gets heated fast. Start with just one line, get that data clean first, then expand once you've shown the doubters it actually works. Don't try to boil the ocean right away.
You can't just focus on machines and ignore your people - they're totally connected. Sure, your equipment might hit 95% uptime, but if operators don't know what they're doing or just don't care? You'll still get quality problems and slow changeovers. Track the technical stuff like downtime and cycle times, obviously. But also look at whether your team actually has the right skills and gives a damn about the work. When maintenance schedules line up with training and operators feel heard on improvements, that's when OEE actually jumps. Oh, and ask your operators what equipment problems they spot first - they usually know way before the data shows it.
Toyota's probably the best example - they went from 60% to 85%+ OEE on their auto lines using lean manufacturing. Pretty incredible jump. Nestlé boosted their packaging by 15-20 points just by cutting changeover times and fixing those annoying minor stops. Food companies are weirdly good at this stuff for some reason. P&G got solid results too with real-time monitoring on their consumer goods lines. The pattern's always the same though - measure everything first, then go after your biggest problems one by one. Definitely check out Toyota Production System case studies if you can find them.
So here's the thing - OEE shows you exactly where your machines are wasting money instead of just guessing. You'll see if the real problem is breakdowns, slow speeds, or bad parts. Track your current equipment first though! I swear, half the companies I know dropped serious cash on new machines when they just needed better upkeep on what they already had. The data lets you build a solid business case with real numbers instead of going with your gut. You might actually be shocked at what you find once you start measuring.
-
Keep doing the good work guys. Surpass the needs and expectations always!!
-
I am really satisfied with their XYZ products. Used their slides for my business presentations and now I am taking their help for my son's high-school assignments. Super satisfied!!