


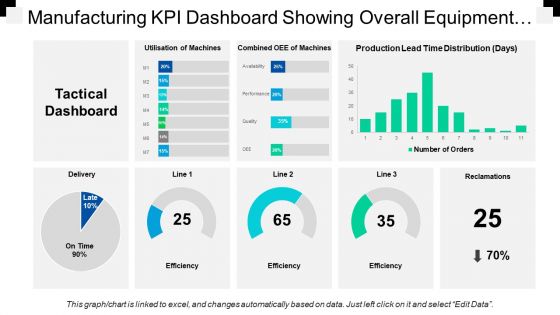
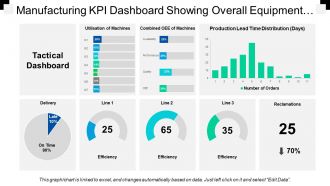
Manufacturing kpi dashboard showing overall equipment effectiveness





Try Before you Buy Download Free Sample Product
 Impress Your
 Audience
 100%
100% Editable
 Save Hours
 of Time


Appreciate good judgement with our Manufacturing Kpi Dashboard Showing Overall Equipment Effectiveness. Applaud instances where errors were averted.
People who downloaded this PowerPoint presentation also viewed the following :
Manufacturing kpi dashboard showing overall equipment effectiveness with all 6 slides:
Cut down inefficiency with our Manufacturing Kpi Dashboard Showing Overall Equipment Effectiveness. Get folks to clean up their act.


FAQs for Manufacturing kpi dashboard showing
So OEE tracks how well your equipment actually performs by mixing three things: availability, performance, and quality. It's like a report card for machines. Most companies assume they're hitting 85% efficiency, but OEE usually reveals it's more like 60% - kind of a reality check, honestly. The cool part? You get real data on what's costing you money. Downtime and defects add up fast. I'd say start with your most important equipment first. You'll probably find some stuff that'll surprise you about where time gets wasted.
So you need three numbers for OEE - availability, performance, and quality. Availability is your actual runtime versus what you planned. Performance compares real output to what the machine could theoretically do. Quality's just good units divided by total units. Multiply all three percentages together and there's your score. Here's the thing though - getting accurate data is way harder than the math part. Don't try to measure everything at once or you'll go crazy. Pick one production line, get that dialed in first, then expand from there. Whatever score ends up lowest tells you exactly what needs fixing.
So OEE breaks down into three parts: Availability, Performance, and Quality. Availability tracks actual runtime vs planned time - breakdowns wreck this metric fast. Performance checks if you're hitting target speeds during production. Quality looks at good parts divided by total output. Here's what's brutal though - they multiply together. Even hitting 90% on all three only gets you 73% overall OEE, which honestly surprised me when I first learned it. My advice? Don't spread yourself thin trying to fix everything. Pick your worst area and hammer away at that first. Way more effective than chasing small gains everywhere.
OEE is like a manufacturing reality check - shows you exactly where you're bleeding time and efficiency. Break it down into availability, performance, and quality losses to spot your biggest bottlenecks. What I really like about it? No BS, just hard numbers. Start with your most critical equipment first, then expand. Use your baseline to set improvement targets and track progress. Here's the thing though - don't just bury it in monthly reports. Bring those numbers to daily huddles and problem-solving sessions. That's where the real magic happens and you'll actually see changes stick.
Look, the biggest screwup I see? Trying to track absolutely everything right out of the gate. You'll drown in numbers and your team will want to murder you. Pick your most critical line first, nail that down, then expand. Don't trust sensors blindly either - they're basically pathological liars half the time. Your operators need to actually get what OEE is or they'll just game the numbers. I learned this the hard way at my last job. Focus on getting solid availability, performance, and quality data for ONE line before going crazy company-wide. Trust me on this one.
Look, OEE and OLE actually work together - they're not competing metrics. OEE tracks your equipment performance (availability, speed, quality stuff), while OLE measures how well you're using your workforce. Here's the thing though - you could have machines humming along at 85% OEE, but if your labor efficiency is garbage, you're still hemorrhaging cash. I've seen it happen way too often. Track both at the same time so you can figure out if bottlenecks are machine problems or people problems. Then you'll know which fire to put out first.
So yeah, training makes a huge difference for OEE - I'm talking like 15-20% improvement in some places I've worked with. Your operators will spot quality problems way earlier when they actually know what to look for. Downtime drops because they're not breaking stuff as much, and they can run closer to those ideal cycle times. All three OEE components get better basically. The trick is don't just do it once and forget about it. Look at where you're bleeding the most points first and train around those specific issues. Honestly, most facilities totally underestimate how much bad training costs them.
Honestly, IoT sensors are game-changers for tracking your equipment. You'll get real-time data on machine performance and downtime instead of waiting for those useless weekly reports. The sensors work 24/7 automatically - no more manual data collection nonsense. Everything feeds straight into your OEE dashboards so you catch problems immediately. Plus the predictive stuff is pretty cool - it'll actually warn you before machines fail and kill your availability numbers. I'd start with your most critical lines first, then just build from there. Way better than flying blind like most places still do.
Honestly, start with your own numbers first. External OEE data is a pain to find since nobody wants to share how they're actually doing. Industry associations might have some benchmarks, or maybe check if consulting firms publish anything for your sector. Trade mags sometimes drop studies too, though half the time they're pretty surface-level. Just make sure you're comparing similar setups - same equipment type, production environment, calculation methods. Otherwise you're basically guessing. Don't stress about hitting some perfect industry average though. Get your baseline down, then aim for 2-5% improvements each month. That's way more realistic than chasing random numbers.
Yeah, downtime absolutely murders your OEE - it's one of those three main pieces (availability, performance, quality) so when one tanks, everything does. Those little 5-minute breakdowns? They add up crazy fast and can easily drop your score by 10+ points. What's worked for me is getting predictive maintenance going so you catch stuff before it breaks. Quick changeovers help too - SMED if you're into that whole thing. Keep spare parts close by and train your operators on basic fixes so they're not just standing around waiting. Start with whatever breaks most often and work from there.
Look, OEE and TPM work together really well. TPM tackles the exact same problems that tank your OEE scores. You get your operators doing basic maintenance stuff - honestly, that's usually the fastest way to see results. Preventive maintenance cuts down on random breakdowns, which boosts your availability numbers. Better equipment condition means fewer performance issues too. Plus you'll get more stable processes, so quality improves. I've worked with facilities that went from like 60% OEE to over 85% once they got their TPM program dialed in. Worth trying the operator maintenance angle first.
Honestly, you've got to speak their language. Executives? Hit them with the money talk - show how OEE boosts profits and beats competitors. Middle managers need operational stuff they can actually control. Frontline workers though, that's where you make it personal. Connect it to what they do every day, show them their work matters. Most companies just slap numbers on screens and act shocked when nobody gives a damn. Use visuals instead, do regular team huddles, celebrate the wins. Oh, and make it feel like everyone's part of the same story rather than just tracking another boring metric.
Yeah, OEE's main problem is it only looks at equipment - you could hit 100% making stuff nobody wants, which is pretty pointless. Also doesn't catch quality issues beyond basic pass/fail, totally ignores energy costs, and honestly? People will game it by cherry-picking easy jobs. For batch or custom work, it's basically worthless. What I'd do is combine it with actual financial metrics like cost per unit. Track quality measures your customers actually care about too. OEE works best when it's part of throughput accounting, not flying solo. Just don't let your team think it's some magic bullet - it's one decent tool among many.
Honestly, dashboards beat the hell out of staring at endless spreadsheet rows. You'll spot trends instantly and see which machines are dragging you down. Color alerts help your team figure out what to tackle first - way better than hunting through data. Here's the thing though: stick those displays right on the shop floor where everyone walks by. People actually start caring about the numbers when they can't avoid seeing them. I'd start simple - just show your 3 worst machines and their OEE scores in real-time. Gets conversations going.
So OEE measurement is changing pretty fast. Predictive analytics are becoming huge - you can actually spot equipment failures before they happen instead of just reacting. IoT sensors are dirt cheap now, which means real-time data from everything instead of someone walking around with a clipboard. Digital twins let you test scenarios without breaking actual equipment (pretty cool honestly). Edge computing processes stuff right on the factory floor, so no delays. Oh, and sustainability metrics matter as much as efficiency now. I'd start playing with predictive tools soon - everyone's moving that direction.
-
Content of slide is easy to understand and edit.
-
Very unique and reliable designs.