


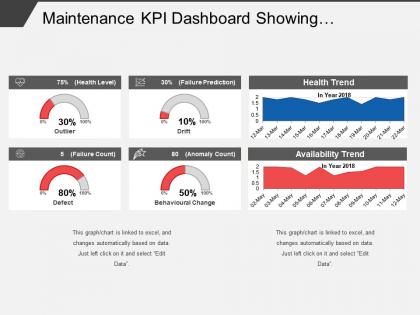
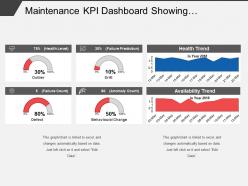
Maintenance kpi dashboard showing preventive maintenance




Try Before you Buy Download Free Sample Product
 Impress Your
 Audience
 100%
100% Editable
 Save Hours
 of Time


Our Maintenance Kpi Dashboard Showing Preventive Maintenance make conditions favorable. People choose to follow your advice.
People who downloaded this PowerPoint presentation also viewed the following :
Maintenance kpi dashboard showing preventive maintenance with all 6 slides:
Our Maintenance Kpi Dashboard Showing Preventive Maintenance get them dancing with glee. Their excitement will know no bounds.


FAQs for Maintenance kpi dashboard
You'll definitely want uptime/downtime percentages and MTBF - those are like the bread and butter metrics. Track your preventive vs corrective maintenance ratio too. Compliance rates for scheduled tasks matter a ton, plus maintenance costs per asset and how fast you're closing work orders. Honestly, spare parts inventory turnover is huge because nobody wants expensive parts just sitting there collecting dust. If you're in manufacturing, OEE is a no-brainer addition. Start with these basics and see what your bosses actually care about - you can always layer on more specific stuff later. Sometimes they obsess over the weirdest metrics anyway.
For your KPI dashboard, track maintenance frequency stuff like mean time between failures and scheduled vs unscheduled work orders. Break everything down by type - preventive, corrective, emergency repairs. Trends over time matter way more than just current numbers (learned that the hard way). I'd also monitor completion rates for scheduled maintenance and see how different equipment performs. Set up alerts when frequencies go off target. Oh, and review weekly with your team - you'll catch problems before they blow up. Visual widgets help people actually understand what's happening instead of drowning in spreadsheets.
Honestly, downtime tracking is probably the most important KPI you can focus on for preventive maintenance. Track both the planned stuff (your scheduled maintenance) and unplanned breakdowns - those are the ones that'll kill your budget. The trick is finding that sweet spot where you're preventing failures without going overboard on maintenance. I've worked with teams who got so caught up in minor tweaks they totally missed obvious downtime patterns staring them in the face. Look at your trends over a few months and see how they match up with your maintenance schedule. That's where you'll find the real insights for tweaking your PM program.
So predictive analytics basically flips your maintenance dashboard from "oh crap, it broke" to actually seeing failures coming. You're forecasting equipment issues before they happen instead of just logging what already went wrong. Pretty neat stuff, honestly. Your maintenance schedule gets way smarter because it's based on real equipment condition, not just random time intervals. You'll spot problems earlier and dodge those surprise breakdowns that kill your budget. The trick is feeding sensor data and old failure records into your current dashboard - then boom, you've got predictive insights rolling in.
Honestly, start with getting your team to log stuff the same way every time - templates help tons with this. Set up validation checks so you catch mistakes right when they happen, not three weeks later when you're scrambling. Regular audits are boring but necessary - just cross-check your KPIs against actual work orders. The biggest thing though? Train your techs on WHY this matters. Bad data = crappy scheduling decisions, and they'll get it once you show them that connection. Oh, and automate whatever you can because people make mistakes. I learned this the hard way at my last job.
Honestly, focus on the metrics that actually matter - uptime percentage and mean time between failures will tell you everything. Check your planned vs unplanned maintenance ratio too. Are your techs even doing the scheduled work? That compliance rate is huge. I got a bit obsessed with tracking unplanned downtime trends because watching those numbers drop is weirdly addictive lol. Cost per maintenance hour rounds out the essentials. Monthly dashboards work great for spotting which equipment's being a pain. These will show you real quick if your PM program's worth the effort or not.
Honestly, gauge charts are your best friend for stuff like equipment uptime and maintenance completion rates - you can see instantly if things are going south. I'd use line charts to track trends like failure rates or costs over time. Bar charts work well when you're comparing different equipment or departments. Heat maps are actually pretty cool for maintenance schedules, though most people don't think of them first. Don't go overboard though - stick to maybe 4-6 key metrics max. Your team shouldn't need a magnifying glass to figure out what's happening.
Look, different people in your company need different maintenance data to make good calls. Techs can prioritize repairs using downtime numbers. Supervisors watch PM compliance rates to tweak schedules. Management geeks out over cost-per-hour trends for budgeting - honestly, they eat that stuff up. The C-suite spots equipment effectiveness patterns that influence big spending decisions. Really though, it's about getting the right metrics to the right people when they need them. Map out which KPIs actually matter to each level first, then you're golden.
Dude, training your operators is like the cheat code for maintenance KPIs. They'll spot problems during routine checks before things blow up into major disasters. Your unplanned downdowns drop. Repair times get shorter. OEE goes up across the board - it's honestly pretty wild how much difference it makes. Plus they knock out PM tasks way faster when they actually know what they're doing. My old plant manager used to say "train once, benefit forever" which sounds cheesy but it's true. Track your training completion rates next to other metrics and you'll see the connection yourself.
Start with trade associations and consulting firms - they usually publish KPI ranges for different sectors. Look for stuff like MTBF, planned vs unplanned maintenance ratios, cost per unit. Getting actual numbers is honestly a pain because companies guard this data like it's top secret or something. Try networking at conferences too, or hop into some online maintenance communities. People are way more open about sharing there. Oh, and once you've got benchmarks, color-code your dashboard so the problem areas jump out. Makes it super obvious where you're falling behind industry averages.
So for PM dashboards, I'd probably go with Power BI or Tableau first - they connect really well to most CMMS platforms and can handle all the messy maintenance data. Google Data Studio is decent if budget's tight, though it's pretty basic for anything complex. I've seen people try to make Excel work but honestly that becomes a nightmare once you need real-time updates. Oh, and definitely figure out your key KPIs first before you pick anything. Makes the whole process way easier. What maintenance software are you guys running? That'll help narrow down which tool plays nicest with your setup.
Honestly, stop throwing random metrics at people and start telling them what they actually want to hear. Executives? Show how preventive maintenance saves cash. Operations folks care about less downtime. Technicians want to see how this makes their day easier. Skip the spreadsheets - nobody's got time for that. Clean visuals with simple colors work way better. Highlight both wins and problem areas so it doesn't look like you're hiding anything. The real trick is setting up regular meetings where you walk through everything together. People engage when they're involved, not just staring at pretty charts on their own.
Honestly, the biggest mistake is trying to track everything at once. You'll drown in dashboards and won't know what matters. Start with maybe 5-7 KPIs that actually help you make decisions - stuff like MTBF, planned vs unplanned downtime, schedule compliance. Don't just grab whatever data's easiest to pull (guilty as charged here). Your metrics need to match business goals, not just maintenance ones. Get your techs involved early too - they'll catch things you'd never see from behind a desk. Focus on metrics that tell a cohesive story instead of random disconnected numbers.
Check your KPI data weekly at least - that's the bare minimum. Monthly deep dives are great for spotting trends too. Honestly, daily monitoring is even better if you've got the time because catching problems early will save your sanity later. Most places do fine with weekly though, especially if your operation isn't super complex. The dashboard should update itself automatically (hopefully yours does that already). Just put a weekly meeting on your calendar and actually stick to it - I've seen too many people skip these then wonder why everything's falling apart.
Dude, cross-department collaboration is a game changer for your maintenance KPIs. Those data silos are killing your tracking ability right now. Getting ops, maintenance, procurement, and finance to actually communicate gives you so much better visibility into equipment performance and parts availability. Operations can warn you about production schedules too, which helps with planning maintenance windows. The real magic happens when everyone's using the same dashboard and metrics - though honestly, getting people to look at the same numbers is harder than it sounds. Start with weekly meetings where you all review the KPI dashboard together.
-
Designs have enough space to add content.
-
I discovered this website through a google search, the services matched my needs perfectly and the pricing was very reasonable. I was thrilled with the product and the customer service. I will definitely use their slides again for my presentations and recommend them to other colleagues.