


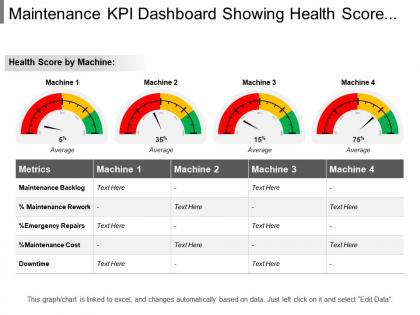
Maintenance kpi dashboard showing health score by machine




Try Before you Buy Download Free Sample Product
 Impress Your
 Audience
 100%
100% Editable
 Save Hours
 of Time


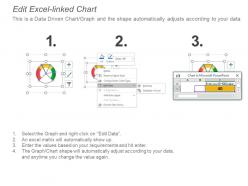
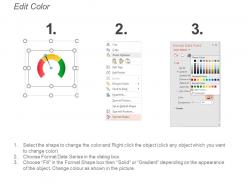
Maintenance Kpi Dashboard Showing Health Score By Machine Display accurate data to enhance the work order or perform a presentation with precision by the help of this maintenance KPI dashboard showing health score by machine to keep up everything at pace. This maintenance key performance indicator PPT slide shows the level of achievements in meeting the objectives; observe the rate of progress being made, and to highlight problem areas. This excel linked maintenance KPI dashboard PPT slide provides inputs to make decisions and is helpful in defining business process in order to deliver the desired result. Our maintenance key performance indicators PPT slide will help maintenance professionals to track the KPIs they need or to customize a dashboard to display the vital information such as work orders, scheduled, completed and past due. This maintenance dashboard PowerPoint deck can be helpful for managers to know when work was completed and their preventive maintenance program is working to record time started and completed in the system. Our Maintenance Kpi Dashboard Showing Health Score By Machine are given to excellence. That is their default characteristic.
People who downloaded this PowerPoint presentation also viewed the following :
Maintenance kpi dashboard showing health score by machine with all 6 slides:
Our Maintenance Kpi Dashboard Showing Health Score By Machine are artistically fashioned. Be assured of exceptional handiwork.

FAQs for Maintenance kpi dashboard showing health
So I'd start with MTBF and MTTR - basically how often stuff breaks vs how fast you fix it. MTTR is honestly more important sometimes because shit's gonna break anyway, right? Then track your overall equipment availability percentage since that's what actually hits your bottom line. Oh, and definitely watch your planned vs unplanned downtime ratios. If you're always in firefighting mode, that ratio will tell the whole story. These four metrics will give you everything you need to make smart maintenance calls without drowning in data.
Honestly, most people overthink this. Figure out what actually drives your business first - is it cost savings, safety, keeping things running, or making equipment last longer? Pick KPIs that track those specific things instead of whatever generic metrics everyone else is measuring. Like if you're in manufacturing and downtime is killing you, focus on MTBF and whether maintenance is happening on schedule. Critical infrastructure? Safety probably comes first. The real trick is being brutally honest about what actually affects your bottom line (not what makes pretty dashboards). Then build everything around that. Make sure each KPI connects back to an actual business goal you can defend.
So predictive maintenance totally flips your KPIs on their head. You stop just measuring how fast you fix broken stuff and start tracking things like mean time between failures and equipment degradation rates. Your OEE numbers get way more reliable since you're actually preventing downtime instead of scrambling to react to it. Honestly, it's like having a heads-up before things go sideways. I'd say start with whatever equipment failures hit your budget the hardest – that's where you'll see the biggest wins first. Makes the whole approach feel less overwhelming too.
Honestly, join some industry groups where people actually share real data - not the polished garbage in public reports. Your trade association probably has benchmarking services, or check out SMRP if you're into that. Comparing your pharma plant to someone's steel mill is pointless though. Find a consultant who works with similar facilities - they've got the real numbers. Focus on apples-to-apples stuff: same equipment, similar conditions, that whole deal. Don't go crazy at first. Pick 2-3 basics like OEE or maintenance cost per unit, then expand from there once you've got your feet wet.
So reactive KPIs are all about damage control - downtime costs, repair times, emergency calls. Basically measuring how good you are at firefighting (spoiler: nobody wants to be good at that). Proactive ones? Completely different story. You're tracking planned maintenance rates, equipment health scores, predictive stuff. Way smarter approach. Here's the thing - reactive metrics just show you how much everything sucks right now. Proactive metrics actually help prevent the suckiness from happening. Honestly, I'd focus way more on building up those proactive dashboards. Your future self will thank you when you're not constantly scrambling to fix broken equipment.
Honestly, maintenance KPIs are like having a good radar system - they show you what's actually broken before it costs you big money. Track stuff like equipment uptime and how long repairs take, and you'll catch problems early. I always tell people to start small though. Pick maybe 3-4 metrics that actually matter to YOUR operation, not just whatever sounds impressive. It's tempting to measure everything, but that gets messy fast. Focus on what aligns with your goals first. You can always add more later once you've got the basics down.
So I'd definitely check out CMMS platforms - Fiix and UpKeep are solid choices. They pull data straight from your work orders and automatically calculate availability, MTTR, all that good stuff. Most connect to IoT sensors too, which is honestly a game changer for tracking equipment without constantly inputting data manually. SAP's maintenance modules are pretty robust if you're already using their ERP system. Power BI works well for smaller setups - just connect it to whatever databases you've got. Oh, and whatever you pick, make sure it integrates with your current systems. Trust me, double data entry is the worst.
So basically, good maintenance KPIs are like having a crystal ball for safety issues. You're tracking stuff like failure rates and completion percentages, which gives you a heads up before things go sideways. Reactive maintenance is honestly a nightmare - your team's stressed, equipment's breaking at random times, and that's prime accident territory. Way better to spot problems early and fix them when you can actually plan it out safely. I'd say start with tracking your maintenance completion rates this month. You'll probably notice they line up pretty well with when safety incidents happen. It's kind of eye-opening once you see the connection.
MTBF is like a report card for your equipment - shows how long stuff runs before it craps out. Higher numbers mean more reliable gear, which keeps downtime low and your ops team happy. You can predict failures better and actually plan maintenance instead of just reacting to breakdowns all the time. It's also great for comparing different models when you're shopping around. Honestly, tracking this for your most critical assets first is the way to go. You'll spot your troublemakers pretty fast and know where to focus your attention.
Look, you can't just track MTBF and wrench time for the sake of it - that data needs to drive actual changes. Pick maybe 3-5 metrics max and really dig into what they're telling you. When something's off, hunt down the root cause instead of just shrugging it off. Your whole team should get how their daily stuff connects to these numbers, otherwise what's the point? Review everything regularly and don't be afraid to tweak your targets as you go. Honestly, I've watched so many maintenance teams drown in spreadsheets but never actually fix anything!
Your CMMS has most of what you need - work orders, asset histories, all that stuff. Pull cost data from your ERP too. Look, I know Excel is still everywhere (guilty as charged), but don't build your KPIs around it if you can help it. Too many things go wrong. IoT sensors are gold for real-time data. The tricky part? Getting everything to actually talk to each other. Dashboards that auto-pull from multiple systems will save you tons of headaches. Integration's annoying but worth it.
Track your maintenance KPIs for at least three months - they're basically your ammunition when budget season hits. Look at stuff like downtime costs, labor hours per piece of equipment, and how fast you're burning through parts inventory. This data shows exactly where money's going and where you're bleeding cash. Plus you'll catch patterns, like that one machine that's always breaking down (we all have one). Short bursts work better than long explanations with leadership. Once you've got that baseline, you can actually justify next year's budget instead of just guessing what you'll need.
Honestly, tracking just one type of KPI is asking for trouble. You'll miss huge blind spots that come back to haunt you. Say you only watch costs - suddenly quality and safety take a nosedive. Or maybe you obsess over uptime and end up burning cash on band-aid solutions instead of fixing the real problems. Short bursts work better than long sentences sometimes. Think of it like driving with your eyes glued to the speedometer - kinda defeats the purpose, right? You need the whole story, not just one chapter. Mix leading and lagging indicators across cost, quality, and performance. That's how you actually see what's happening with your maintenance program.
Your frontline team sees what's really going wrong daily, so get them involved in picking and tracking KPIs. Otherwise they'll just think it's more BS from upstairs. Honestly, technicians catch data problems and suggest way better metrics than what management dreams up. I've watched this totally sink programs when people skip this step. Start by having them help choose what actually matters to measure. Then make sure they can see how their work moves the needle - that part's huge for buy-in.
Know your audience first - executives want those big picture dashboards with cost savings and OEE metrics. Don't bog them down with details. Operations managers though? They actually want the granular stuff and automated alerts when things go sideways. Monthly review meetings work great for walking through trends. Oh, and visual storytelling is huge - seriously, nobody wants to stare at spreadsheets anymore. Charts and graphs win every time. The whole point is making data actionable, so always throw in your recommendations or next steps when you present results.
-
Wonderful templates design to use in business meetings.
-
Very unique and reliable designs.