


Maintenance Dashboard With Schedule Compliance




Try Before you Buy Download Free Sample Product
 Impress Your
 Audience
 100%
100% Editable
 Save Hours
 of Time


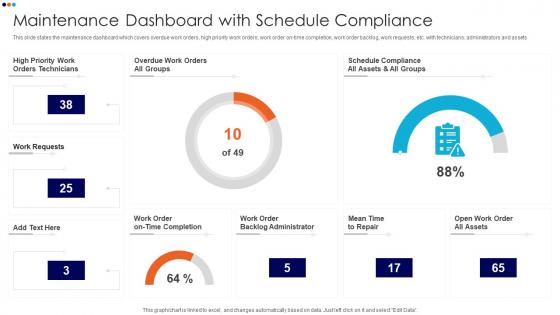
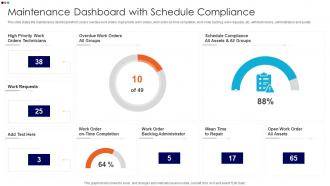
This slide states the maintenance dashboard which covers overdue work orders, high priority work orders, work order on time completion, work order backlog, work requests, etc. with technicians, administrators and assets.
People who downloaded this PowerPoint presentation also viewed the following :
Maintenance Dashboard With Schedule Compliance with all 7 slides:
Use our Maintenance Dashboard With Schedule Compliance to effectively help you save your valuable time. They are readymade to fit into any presentation structure.





FAQs for Maintenance Dashboard
For your maintenance dashboard, focus on these key ones: equipment uptime/downtime percentages, mean time to repair (MTTR), and planned vs unplanned maintenance ratios. Work order completion rates are crucial too. I always add cost per maintenance hour because, honestly, who isn't watching their budget these days? These five metrics give you everything you need to see what's actually happening. Don't go crazy adding a bunch of others right away - I've seen teams get overwhelmed and stop using dashboards entirely. Start simple. Once everyone's comfortable checking it regularly, then you can think about expanding.
So basically real-time data turns your maintenance dashboard from looking backwards to actually seeing what's happening now. Your sensors and equipment logs feed straight in, so you catch problems while they're still small instead of getting those awful 3am calls. I honestly think this is one of the best upgrades you can make. Teams can prioritize based on current conditions rather than yesterday's data. Start with your most critical stuff first - you don't have to do everything at once. Way better than playing catch-up all the time.
Put your most critical stuff right at the top - alerts, system status, key metrics. Users need to see that immediately. Color coding works great: red for emergencies, yellow for warnings, green when everything's running smooth. But don't go overboard with colors or it'll look like a rainbow exploded. Group similar functions together and make search/filtering super easy to find. Honestly? Test it with the actual maintenance crew first - they catch things you'd never notice. I learned that the hard way on my last project. Keep the layout simple initially, then build from there.
So instead of waiting for stuff to break, you can actually predict when it'll need fixing using all that sensor data and usage patterns. The dashboard crunches historical failures and tells you when components are probably gonna fail - which honestly feels like cheating but in a good way. Your maintenance windows become way more strategic since you're working with actual data instead of some random calendar schedule. Plus you can time downtime for slow periods and dodge those surprise breakdowns that always happen at the worst moments. I'd start with your most critical equipment first, then expand from there.
Dude, mobile is everything for maintenance dashboards. Your techs are crawling around equipment, not chained to desks. They need to pull up work orders and update stuff on the spot - waiting until they're back at a computer kills your real-time data. Nobody's hauling a laptop around just to check something quick, that's ridiculous. The trick is making sure it actually works on phones, not just shrinks down to fit. I've seen so many "mobile-friendly" dashboards that are basically unusable with your thumbs. Test it with your actual team first - if they won't use it, what's the point?
Honestly? Daily updates are usually enough for most maintenance stuff. Real-time is better if you've got critical equipment that can't go down. I've watched teams mess up because they were looking at old data - not fun. For basic preventive maintenance, once a day works fine. But compliance-heavy industries or high-priority assets? You'll want hourly refreshes. The trick is matching your update frequency to how often you actually make decisions. Like, why refresh every five minutes if your schedules only change weekly? Automate the data pulls so you're not doing it manually all the time.
Don't cram everything onto one screen - seriously, I've worked with teams that put like 25 charts up there and nobody uses any of it. Pick maybe 5-7 metrics that actually help people make decisions, not just the ones that look cool in meetings. Vanity metrics are tempting but useless. Make sure your data updates regularly because stale numbers kill credibility fast. Oh, and definitely test it with a few users first - what makes sense to you might be confusing to everyone else. Simple beats comprehensive every time.
So these dashboards basically save your butt during inspections - everything's in one place instead of hunting through random files. You can see who serviced what, when parts got swapped out, all that documentation stuff regulators want. Plus they'll ping you before compliance deadlines hit, which honestly beats trying to remember everything manually. Figure out what regulations you're dealing with first, then set up those automatic reminders. Trust me, it beats scrambling when an inspector shows up unannounced. Way better than the old spreadsheet nightmare.
Start with KPI cards showing uptime and overdue work orders - you need that instant status check. Time-series charts are perfect for tracking equipment performance trends and maintenance costs. Heat maps actually work really well for spotting which assets need attention (I was skeptical at first but they're solid). Gantt charts help with scheduling, though they get cluttered fast. Bar charts comparing costs by equipment type are useful too. Honestly, stick to 3-4 key visualizations max. Don't try cramming everything on one screen or it becomes useless.
Honestly, just talk to users constantly throughout the whole thing. Start with interviews about their daily headaches, then build prototypes and test with real maintenance teams. Those guys don't sugarcoat anything - they'll tell you exactly what's broken, which is gold. After each version, do feedback sessions and watch your analytics to see where people bail out. Oh, and definitely build a feedback button right into the dashboard itself. Monthly check-ins work great too. The trick is making it ongoing instead of just asking once at the end.
So basically IoT sensors hook up to your equipment and pump live data straight to your dashboard - temperature, vibrations, all that stuff. You'll actually know what's happening without walking around checking everything manually (which let's be honest, never gets done enough anyway). The cool part is you get alerts before things break, not after. Plus it tracks maintenance history automatically and you can spot weird patterns across different machines. I'd start small though - maybe just your most critical equipment first to see if it's worth the hassle. Way better than playing the guessing game.
So basically, maintenance dashboards give everyone a real-time view of what's happening. Your maintenance crew updates equipment status, then operations instantly knows about production delays and procurement sees what parts they need to order. Finance can track costs without constantly asking for reports - honestly such a time saver. Non-technical people actually understand what's going on because everything's visual. Oh, and set up automated alerts so the right people get pinged when something breaks. Way better than those ridiculous email threads that go on forever.
Start with role-based access - only give people what they need for their actual jobs. Multi-factor authentication is a must because passwords by themselves are basically useless now. Encrypt everything, both stored data and anything moving between systems. Oh, and set up activity logs so you can see who's poking around in there. Regular security audits matter too - I'd say quarterly reviews at minimum. My old boss used to say "maintenance data is business data" and honestly, he wasn't wrong. Layer your protections and don't get lazy about updating them.
Look at your dashboard and find the 3 biggest equipment failure patterns first. That's your goldmine right there. You can spot seasonal trends, see which machines are constantly giving you trouble, and figure out if your current maintenance timing actually works. Once you've got that data, you can plan ahead instead of scrambling when stuff breaks. Honestly, reactive maintenance is such a money pit. The timing thing takes practice but when you get it right - way fewer headaches, better budgets, less downtime. It's like having a crystal ball but actually useful.
Honestly, I'd start with figuring out what data you can actually get from your CMMS first - saves you headaches later. Power BI and Tableau are pretty user-friendly if you want that drag-and-drop stuff without learning code. Grafana's my personal favorite though, since it's free and you can make it do basically anything, but yeah the setup takes some patience. Google Data Studio works fine for simple stuff too. Really depends how fancy you want to get and whether you're comfortable getting your hands dirty with the technical side. Most of these play nice with APIs if your system has them.
-
Huge collection of high-quality templates. Worth each penny.
-
If you have visited their site and failed to find the products, try reaching the customer service because it will be the case that you didn't use the search bar well.