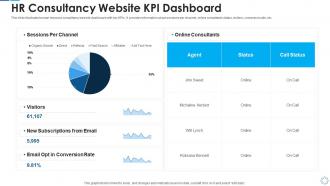
Website Analytics KPI Dashboard, Metrics PPT Templates
-
 Digital Marketing KPI Dashboard Snapshot With Engagement Rate
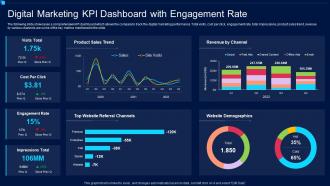
The following slide showcases a comprehensive KPI dashboard which allows the company to track the digital marketing performance. Total visits, cost per click, engagement rate, total impressions, product sales trend, revenue by various channels are some of the key metrics mentioned in the slide. Introducing our Digital Marketing KPI Dashboard Snapshot With Engagement Rate set of slides. The topics discussed in these slides are Product Sales Trend, Revenue By Channel, Top Website Referral Channels, Website Demographics, Engagement Rate, Impressions Total. This is an immediately available PowerPoint presentation that can be conveniently customized. Download it and convince your audience.
-
 Website Statistics Powerpoint Ppt Template Bundles
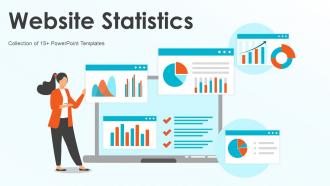
Engage buyer personas and boost brand awareness by pitching yourself using this prefabricated set. This Website Statistics Powerpoint Ppt Template Bundles is a great tool to connect with your audience as it contains high-quality content and graphics. This helps in conveying your thoughts in a well-structured manner. It also helps you attain a competitive advantage because of its unique design and aesthetics. In addition to this, you can use this PPT design to portray information and educate your audience on various topics. With sixteen slides, this is a great design to use for your upcoming presentations. Not only is it cost-effective but also easily pliable depending on your needs and requirements. As such color, font, or any other design component can be altered. It is also available for immediate download in different formats such as PNG, JPG, etc. So, without any further ado, download it now.
-
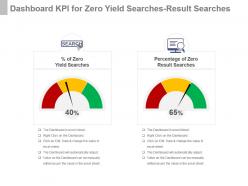 Dashboard Snapshot kpi for zero yield searches result searches presentation slide
Presenting dashboard snapshot kpi for zero yield searches result searches presentation slide. This presentation slide shows two Key Performance Indicators or KPIs in a Dashboard style design. The first KPI that can be shown is Percentage of Zero Yield Searches. The second KPI is Percentage of Zero Result Searches. These KPI Powerpoint graphics are all data driven, and the shape automatically adjusts according to your data. Just right click on the KPI graphic, enter the right value and the shape will adjust automatically. Make a visual impact with our KPI slides.
-
 Website Analytics Report Powerpoint Ppt Template Bundles
If you require a professional template with great design,then this Website Analytics Report Powerpoint Ppt Template Bundles is an ideal fit for you. Deploy it to enthrall your audience and increase your presentation threshold with the right graphics,images,and structure. Portray your ideas and vision using twelve slides included in this complete deck. This template is suitable for expert discussion meetings presenting your views on the topic. With a variety of slides having the same thematic representation,this template can be regarded as a complete package. It employs some of the best design practices,so everything is well-structured. Not only this,it responds to all your needs and requirements by quickly adapting itself to the changes you make. This PPT slideshow is available for immediate download in PNG,JPG,and PDF formats,further enhancing its usability. Grab it by clicking the download button.
-
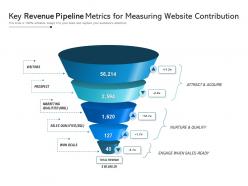 Key Revenue Pipeline Metrics For Measuring Website Contribution
Presenting this set of slides with name Key Revenue Pipeline Metrics For Measuring Website ContributionKey Revenue Pipeline Metrics For Measuring Website Contribution. This is a five stage process. The stages in this process are Key Revenue, Pipeline Metrics, Measuring Website, Contribution. This is a completely editable PowerPoint presentation and is available for immediate download. Download now and impress your audience.
-
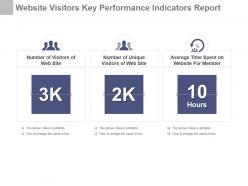 Website visitors key performance indicators report ppt slide
Presenting website visitors key performance indicators report ppt slide. This presentation slide shows three Key Performance Indicators or KPIs in a Dashboard style design. The first KPI that can be shown is Number of Visitors of Web Site. The second KPI is Number of Unique Visitors of Web Site and the third is Average Time Spent on Website For Member. These KPI Powerpoint graphics are all data driven, and the shape automatically adjusts according to your data. Just right click on the KPI graphic, enter the right value and the shape will adjust automatically. Make a visual impact with our KPI slides.
-
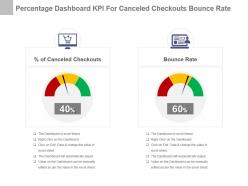 Percentage dashboard snapshot kpi for canceled checkouts bounce rate powerpoint slide
Presenting percentage dashboard snapshot kpi for canceled checkouts bounce rate powerpoint slide. This presentation slide shows two Key Performance Indicators or KPIs in a Dashboard style design. The first KPI that can be shown is Percentage of Canceled Checkouts. The second KPI is Bounce Rate. These KPI Powerpoint graphics are all data driven, and the shape automatically adjusts according to your data. Just right click on the KPI graphic, enter the right value and the shape will adjust automatically. Make a visual impact with our KPI slides.
-
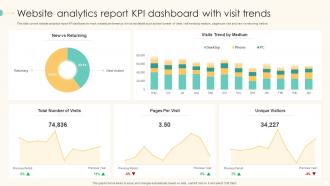
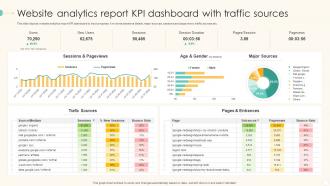
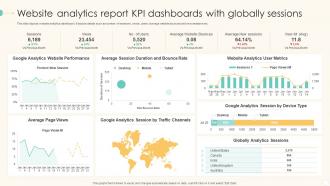
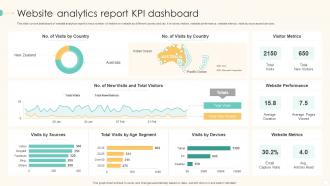 Website Analytics Report KPI Dashboard Snapshot
Introducing our Website Analytics Report KPI Dashboard Snapshot set of slides. The topics discussed in these slides are Website Analytics Report, KPI Dashboard Snapshot. This is an immediately available PowerPoint presentation that can be conveniently customized. Download it and convince your audience.
-
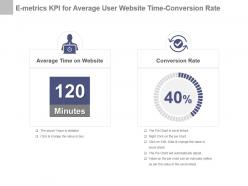 E metrics kpi for average user website time conversion rate powerpoint slide
Presenting e metrics kpi for average user website time conversion rate powerpoint slide. This presentation slide shows two Key Performance Indicators or KPIs in a Dashboard style design. The first KPI that can be shown is Average Time on Website. The second KPI is Conversion Rate. These KPI Powerpoint graphics are all data driven, and the shape automatically adjusts according to your data. Just right click on the KPI graphic, enter the right value and the shape will adjust automatically. Make a visual impact with our KPI slides.
-
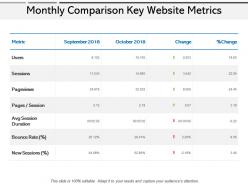 Monthly comparison key website metrics
Presenting this set of slides with name - Monthly Comparison Key Website Metrics. This is a three stages process. The stages in this process are Monthly Comparison, Monthly Compare, 30 Days Comparison.
-
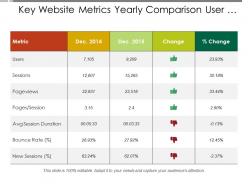 Key website metrics yearly comparison user session and bounce rate
Presenting this set of slides with name - Key Website Metrics Yearly Comparison User Session And Bounce Rate. This is a four stage process. The stages in this process are Differentiation, Comparison, Compare.
-
 4 Week Roadmap For Website Statistics Improvement
This slide showcases roadmap for website statistics improvement that can help to decide the weekly milestones to enhance the website performance metrics and visitors experience. Its key steps are - measure website statistics, leverage strategies, measure progress and review progress regularly. Presenting our set of slides with name 4 Week Roadmap For Website Statistics Improvement. This exhibits information on four stages of the process. This is an easy-to-edit and innovatively designed PowerPoint template. So download immediately and highlight information on Leverage Strategiesreview Progress Regularly, Measure Progress, Website Statistics.
-
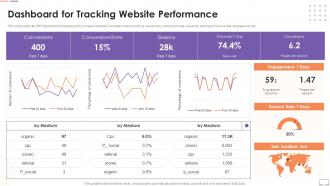 Dashboard For Tracking Website Performance Customer Touchpoint Guide To Improve User Experience
This slide covers the KPI dashboard for analyzing the company website. It includes metrics such as conversions, conversion rate, sessions, stickiness, bounce rate, engagement, etc. Present the topic in a bit more detail with this Dashboard For Tracking Website Performance Customer Touchpoint Guide To Improve User Experience. Use it as a tool for discussion and navigation on Performance, Dashboard, Conversions. This template is free to edit as deemed fit for your organization. Therefore download it now.
-
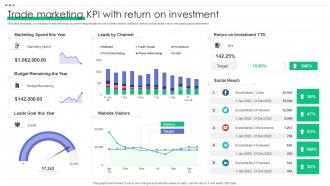 Trade Marketing KPI With Return On Investment
This slide templates covers about trade marketing key performing indicators with website visitors, leads by channel, social media reach with yearly goal achievement. Presenting our well structured Trade Marketing KPI With Return On Investment. The topics discussed in this slide are Marketing Spend, Return Investment YTD, Budget Remaining Year. This is an instantly available PowerPoint presentation that can be edited conveniently. Download it right away and captivate your audience.
-
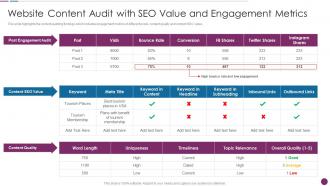 F414 Website Content Audit With Seo Value And Engagement Procedure To Perform Digital Marketing Audit
This slide highlights the content auditing findings which includes engagement metrics of different posts, content quality and content SEO value. Present the topic in a bit more detail with this F414 Website Content Audit With Seo Value And Engagement Procedure To Perform Digital Marketing Audit. Use it as a tool for discussion and navigation on Post Engagement Audit, Content Seo Value, Content Quality. This template is free to edit as deemed fit for your organization. Therefore download it now.
-
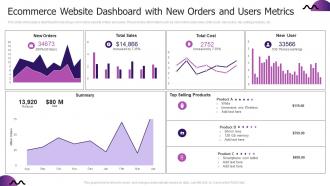 Ecommerce Website Dashboard With New Orders And Users Metrics
This slide showcases a dashboard for tracking e commerce website orders and users. This provides information such as new orders, total sales, total costs, new users, top-selling products, etc. Introducing our Ecommerce Website Dashboard With New Orders And Users Metrics set of slides. The topics discussed in these slides are Ecommerce Website Dashboard, New Orders, Users Metrics. This is an immediately available PowerPoint presentation that can be conveniently customized. Download it and convince your audience.
-
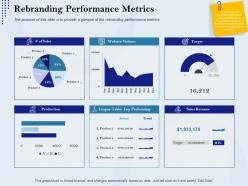 Rebranding performance metrics rebranding approach ppt pictures
The purpose of this slide is to provide a glimpse of the rebranding performance metrics.Deliver an outstanding presentation on the topic using this Rebranding Performance Metrics Rebranding Approach Ppt Pictures. Dispense information and present a thorough explanation of Website Visitors, Target, Sales Revenue, League Table Top Performing, Production using the slides given. This template can be altered and personalized to fit your needs. It is also available for immediate download. So grab it now.
-
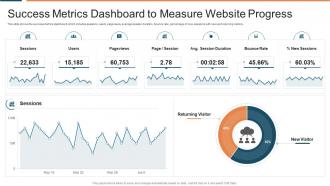 Success metrics dashboard to measure website progress
Presenting our well structured Success Metrics Dashboard To Measure Website Progress. The topics discussed in this slide are Success Metrics Dashboard To Measure Website Progress. This is an instantly available PowerPoint presentation that can be edited conveniently. Download it right away and captivate your audience.
-
 Digital Marketing Metrics To Monitor Sales Effectiveness Digital Automation To Streamline Sales Operations
This slide focuses on digital marketing metrics to monitor sales effectiveness which covers total visits and impressions, cost per click, engagement rate, website demographics, quarterly product sales, etc. Present the topic in a bit more detail with this Digital Marketing Metrics To Monitor Sales Effectiveness Digital Automation To Streamline Sales Operations. Use it as a tool for discussion and navigation on Marketing, Effectiveness, Demographics. This template is free to edit as deemed fit for your organization. Therefore download it now.
-
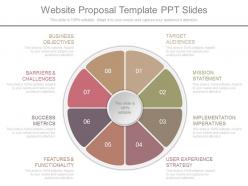 One website proposal template ppt slides
Presenting one website proposal template ppt slides. This is a website proposal template ppt slides. This is a eight stage process. The stages in this process are target audiences, mission statement, implementation imperatives, user experience strategy, feature and functionality, success metrics, barriers and challenges, business objectives.
-
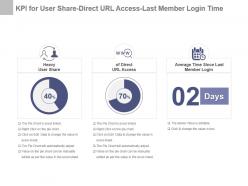 Kpi for user share direct url access last member login time powerpoint slide
Presenting kpi for user share direct url access last member login time powerpoint slide. This presentation slide shows three Key Performance Indicators or KPIs in a Dashboard style design. The first KPI that can be shown is Heavy User Share. The second KPI is of Direct URL Access and the third is Average Time Since Last Member Login. These KPI Powerpoint graphics are all data driven, and the shape automatically adjusts according to your data. Just right click on the KPI graphic, enter the right value and the shape will adjust automatically. Make a visual impact with our KPI slides.
-
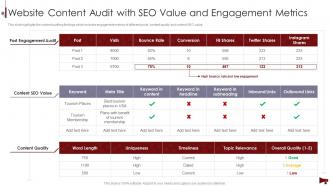 Digital Marketing Audit Of Website Website Content Audit With SEO Value And Engagement Metrics
This slide highlights the content auditing findings which includes engagement metrics of different posts, content quality and content SEO value. Present the topic in a bit more detail with this Digital Marketing Audit Of Website Website Content Audit With SEO Value And Engagement Metrics. Use it as a tool for discussion and navigation on Post Engagement Audit, Content SEO Value, Content Quality. This template is free to edit as deemed fit for your organization. Therefore download it now.
-
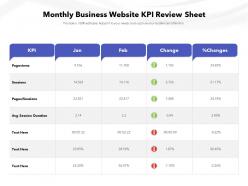
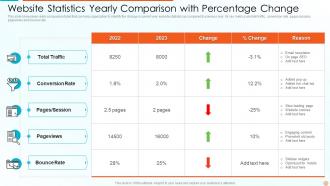 Website Statistics Yearly Comparison With Percentage Change
This slide showcases yearly comparison table that can help organization to identify the change in current year website statistics as compared to previous year. Its key metrics are total traffic, conversion rate, pages or session, pageviews and bounce rate Introducing our Website Statistics Yearly Comparison With Percentage Change set of slides. The topics discussed in these slides are Statistics, Comparison, Percentage. This is an immediately available PowerPoint presentation that can be conveniently customized. Download it and convince your audience.
-
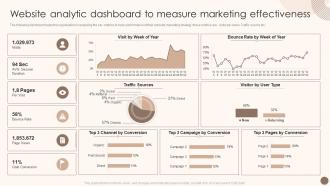 Utilizing Marketing Strategy To Optimize Website Analytic Dashboard To Measure Marketing
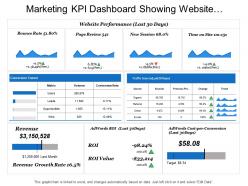
The following dashboard helps the organization in analyzing the key metrics to track performance of their website marketing strategy, these metrics are visits per week. Traffic source etc. Present the topic in a bit more detail with this Utilizing Marketing Strategy To Optimize Website Analytic Dashboard To Measure Marketing. Use it as a tool for discussion and navigation on Bounce Rate, Traffic Sources, Goal Conversion. This template is free to edit as deemed fit for your organization. Therefore download it now.
-
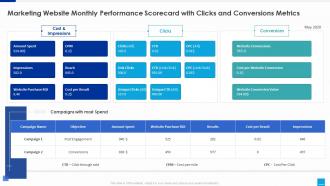 Marketing website marketing website monthly performance scorecard clicks conversions metrics
Present the topic in a bit more detail with this Marketing Website Marketing Website Monthly Performance Scorecard Clicks Conversions Metrics. Use it as a tool for discussion and navigation on Performance, Scorecard, Conversions. This template is free to edit as deemed fit for your organization. Therefore download it now.
-
 Social media marketing kpi for product ideas people feedback powerpoint slide
Presenting social media marketing kpi for product ideas people feedback powerpoint slide. This presentation slide shows three Key Performance Indicators or KPIs in a Dashboard style design. The first KPI that can be shown is Number of Product Ideas Submitted to Brand in an Open Online Forum. The second KPI is Number of People That Submitted Product Ideas Brand in an Open Online Forum and the third is Number of People That Provided Feedback on Brand Website. These KPI Powerpoint graphics are all data driven, and the shape automatically adjusts according to your data. Just right click on the KPI graphic, enter the right value and the shape will adjust automatically. Make a visual impact with our KPI slides.
-
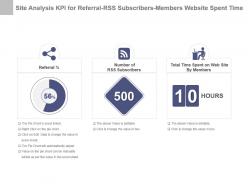 Site analysis kpi for referral rss subscribers members website spent time ppt slide
Presenting site analysis kpi for referral rss subscribers members website spent time ppt slide. This presentation slide shows three Key Performance Indicators or KPIs in a Dashboard style design. The first KPI that can be shown is Referral Percentage. The second KPI is Number of RSS Subscribers and the third is Total Time Spent on Web Site By Members. These KPI Powerpoint graphics are all data driven, and the shape automatically adjusts according to your data. Just right click on the KPI graphic, enter the right value and the shape will adjust automatically. Make a visual impact with our KPI slides.
-
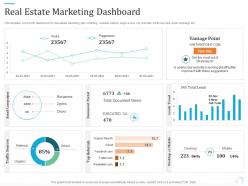 Real estate marketing dashboard marketing plan for real estate project
This template covers KPI dashboard for real estate marketing plan including website visitors, page review, top referrals, traffic sources, email campaign etc. Present the topic in a bit more detail with this Real Estate Marketing Dashboard Marketing Plan For Real Estate Project. Use it as a tool for discussion and navigation on Real Estate Marketing Dashboard. This template is free to edit as deemed fit for your organization. Therefore download it now.
-
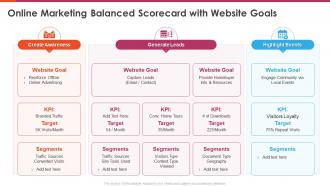 Marketing balanced scorecard online marketing balanced scorecard with website goals
Present the topic in a bit more detail with this Marketing Balanced Scorecard Online Marketing Balanced Scorecard With Website Goals. Use it as a tool for discussion and navigation on Create Awareness, Generate Leads, Highlight Events, Goal, Kpi, Target, Segments. This template is free to edit as deemed fit for your organization. Therefore download it now.
-
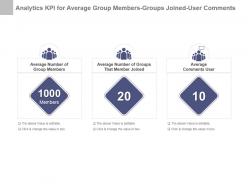 Analytics kpi for average group members groups joined user comments powerpoint slide
Presenting analytics kpi for average group members groups joined user comments powerpoint slide. This presentation slide shows three Key Performance Indicators or KPIs in a Dashboard style design. The first KPI that can be shown is Average Number of Group Members. The second KPI is Average Number of Groups That Member Joined and the third is Average Comments User. These KPI Powerpoint graphics are all data driven, and the shape automatically adjusts according to your data. Just right click on the KPI graphic, enter the right value and the shape will adjust automatically. Make a visual impact with our KPI slides.
-
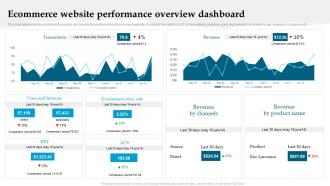 Ecommerce Website Performance Overview Dashboard Analyzing And Implementing Management System
This slide represents the dashboard to analyze and monitor the performance of ecommerce website. It includes key metrics such as transactions, revenue, users and sessions, ecommerce rate, revenue by channels etc. Present the topic in a bit more detail with this Ecommerce Website Performance Overview Dashboard Analyzing And Implementing Management System. Use it as a tool for discussion and navigation on Performance, Overview, Dashboard. This template is free to edit as deemed fit for your organization. Therefore download it now.
-
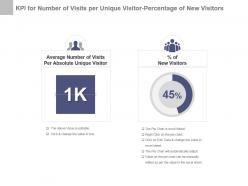 Kpi for number of visits per unique visitor percentage of new visitors ppt slide
Presenting kpi for number of visits per unique visitor percentage of new visitors ppt slide. This presentation slide shows two Key Performance Indicators or KPIs in a Dashboard style design. The first KPI that can be shown is Average Number of Visits Per Absolute Unique Visitor. The second KPI is Percentage of New Visitors. These KPI Powerpoint graphics are all data driven, and the shape automatically adjusts according to your data. Just right click on the KPI graphic, enter the right value and the shape will adjust automatically. Make a visual impact with our KPI slides.
-
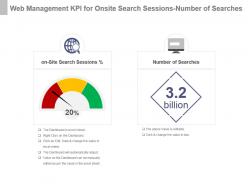 Web management kpi for onsite search sessions number of searches powerpoint slide
Presenting web management kpi for onsite search sessions number of searches powerpoint slide. This presentation slide shows two Key Performance Indicators or KPIs in a Dashboard style design. The first KPI that can be shown is On Site Search Sessions Percentage. The second KPI is Number of Searches. These KPI Powerpoint graphics are all data driven, and the shape automatically adjusts according to your data. Just right click on the KPI graphic, enter the right value and the shape will adjust automatically. Make a visual impact with our KPI slides.
-
 Website metrics icon ppt diagrams
Introducing website metrics PPT diagram. This PowerPoint configuration is versatile with all programming's activities and Google Slides. This Presentation slide can likewise be essentially exportable into PDF or JPG document plans. This PPT image can be shown in a bigger screen proportion with an unaffected high goals. All the PPT design highlights or features of this Presentation graphic like text, image, font size, intensity etc. is completely changeable.
-
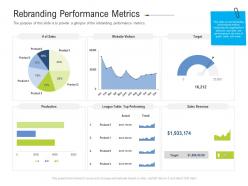 Rebranding performance metrics brand upgradation ppt inspiration
The purpose of this slide is to provide a glimpse of the rebranding performance metrics.Deliver an outstanding presentation on the topic using this Rebranding Performance Metrics Brand Upgradation Ppt Inspiration. Dispense information and present a thorough explanation of League Table Top Performing, Website Visitors, Production using the slides given. This template can be altered and personalized to fit your needs. It is also available for immediate download. So grab it now.
-
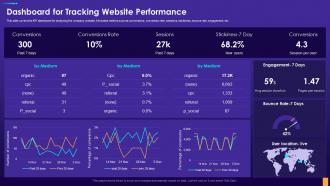 Dashboard For Tracking Website Performance Digital Consumer Touchpoint Strategy
This slide covers the KPI dashboard for analyzing the company website. It includes metrics such as conversions, conversion rate, sessions, stickiness, bounce rate, engagement, etc. Deliver an outstanding presentation on the topic using this Dashboard For Tracking Website Performance Digital Consumer Touchpoint Strategy. Dispense information and present a thorough explanation of Dashboard For Tracking, Website Performance using the slides given. This template can be altered and personalized to fit your needs. It is also available for immediate download. So grab it now.
-
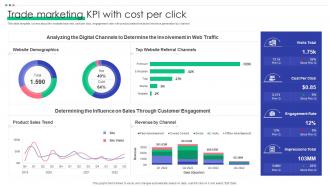 Trade Marketing KPI With Cost Per Click
This slide template covers about the website total visit, cost per click, engagement rate with product sales trends and revenue generation by channel. Presenting our well structured Trade Marketing KPI With Cost Per Click. The topics discussed in this slide are Product Sales Trend, Website Demographics, Customer Engagement. This is an instantly available PowerPoint presentation that can be edited conveniently. Download it right away and captivate your audience.
-
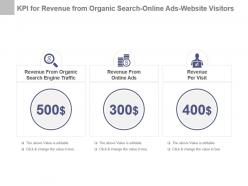 Kpi for revenue from organic search online ads website visitors presentation slide
Presenting kpi for revenue from organic search online ads website visitors presentation slide. This presentation slide shows three Key Performance Indicators or KPIs in a Dashboard style design. The first KPI that can be shown is Revenue From Organic Search Engine Traffic. The second KPI is Revenue From Online Ads and the third is Revenue Per Visit. These KPI Powerpoint graphics are all data driven, and the shape automatically adjusts according to your data. Just right click on the KPI graphic, enter the right value and the shape will adjust automatically. Make a visual impact with our KPI slides.
-
 Digital Marketing Audit Of Website Planning For Web Analytics Audit
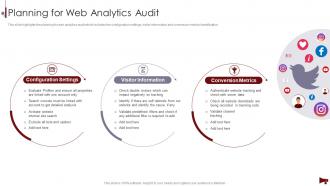
This slide highlights the planning for web analytics audit which includes the configuration settings, visitor information and conversion metrics identification. Introducing Digital Marketing Audit Of Website Planning For Web Analytics Audit to increase your presentation threshold. Encompassed with three stages, this template is a great option to educate and entice your audience. Dispence information on Configuration Settings, Visitor Information, Conversion Metrics, using this template. Grab it now to reap its full benefits.
-
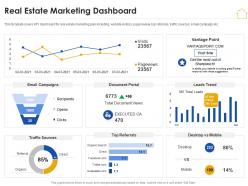 Real estate marketing dashboard real estate marketing plan ppt topics
This template covers KPI dashboard for real estate marketing plan including website visitors, page review, top referrals, traffic sources, email campaign etc. Deliver an outstanding presentation on the topic using this Real Estate Marketing Dashboard Real Estate Marketing Plan Ppt Topics. Dispense information and present a thorough explanation of Real Estate Marketing Dashboard using the slides given. This template can be altered and personalized to fit your needs. It is also available for immediate download. So grab it now.
-
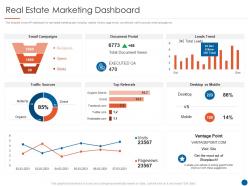 Real estate marketing dashboard real estate listing marketing plan ppt microsoft
This template covers KPI dashboard for real estate marketing plan including website visitors, page review, top referrals, traffic sources, email campaign etc. Deliver an outstanding presentation on the topic using this Real Estate Marketing Dashboard Real Estate Listing Marketing Plan Ppt Microsoft. Dispense information and present a thorough explanation of Real Estate Marketing Dashboard using the slides given. This template can be altered and personalized to fit your needs. It is also available for immediate download. So grab it now.
-
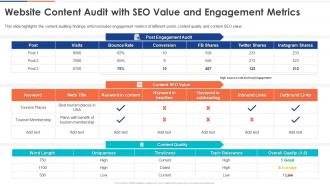 Website Content Audit Digital Audit To Evaluate Brand Ppt Mockup
This slide highlights the content auditing findings which includes engagement metrics of different posts, content quality and content SEO value. Deliver an outstanding presentation on the topic using this Website Content Audit Digital Audit To Evaluate Brand Ppt Mockup. Dispense information and present a thorough explanation of Website Content Audit With SEO Value And Engagement Metrics using the slides given. This template can be altered and personalized to fit your needs. It is also available for immediate download. So grab it now.
-
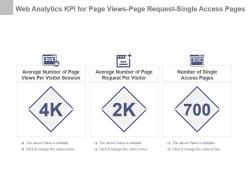 Web analytics kpi for page views page request single access pages presentation slide
Presenting web analytics kpi for page views page request single access pages presentation slide. This presentation slide shows three Key Performance Indicators or KPIs in a Dashboard style design. The first KPI that can be shown is Average Number of Page Views Per Visitor Session. The second KPI is Average Number of Page Request Per Visitor and the third is Number of Single Access Pages. These KPI Powerpoint graphics are all data driven, and the shape automatically adjusts according to your data. Just right click on the KPI graphic, enter the right value and the shape will adjust automatically. Make a visual impact with our KPI slides.
-
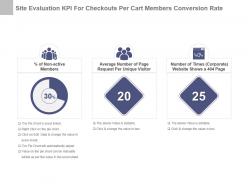 Site evaluation kpi for checkouts per cart members conversion rate presentation slide
Presenting site evaluation kpi for checkouts per cart members conversion rate presentation slide. This presentation slide shows three Key Performance Indicators or KPIs in a Dashboard style design. The first KPI that can be shown is Percentage of Non active Members. The second KPI is Average Number of Page Request Per Unique Visitor and the third is Number of Times Corporate Website Shows a 404 Page. These KPI Powerpoint graphics are all data driven, and the shape automatically adjusts according to your data. Just right click on the KPI graphic, enter the right value and the shape will adjust automatically. Make a visual impact with our KPI slides.
-
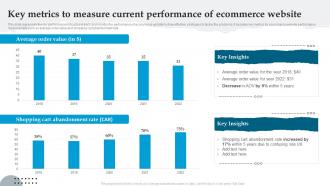 Key Metrics To Measure Current Performance Of Ecommerce Website Analyzing And Implementing Management
This slide represents the key performance indicators to track and monitor the performance of ecommerce website to draw effective strategies to tackle the problems. It includes key metrics for ecommerce website performance measurement such as average order value and shopping cart abandonment rate. Present the topic in a bit more detail with this Key Metrics To Measure Current Performance Of Ecommerce Website Analyzing And Implementing Management. Use it as a tool for discussion and navigation on Measure, Performance, Ecommerce. This template is free to edit as deemed fit for your organization. Therefore download it now.
-
 Social Media Content Marketing Playbook Web Performance Measurement Metrics
Mentioned slide shows the major key performance indicators used by organizations to measure their website performance. Metrics covered are related to organic traffic, inbound leads, bounce rate. Present the topic in a bit more detail with this Social Media Content Marketing Playbook Web Performance Measurement Metrics. Use it as a tool for discussion and navigation on Performance, Measurement, Organizations. This template is free to edit as deemed fit for your organization. Therefore download it now.
-
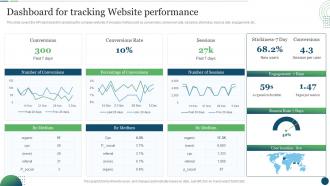 F559 Dashboard For Tracking Website Performance Customer Touchpoint Plan To Enhance Buyer Journey
This slide covers the KPI dashboard for analyzing the company website. It includes metrics such as conversions, conversion rate, sessions, stickiness, bounce rate, engagement, etc. Deliver an outstanding presentation on the topic using this F559 Dashboard For Tracking Website Performance Customer Touchpoint Plan To Enhance Buyer Journey. Dispense information and present a thorough explanation of Performance, Engagement, Conversions using the slides given. This template can be altered and personalized to fit your needs. It is also available for immediate download. So grab it now.
-
 Site review kpi for non active members page request 404 page time powerpoint slide
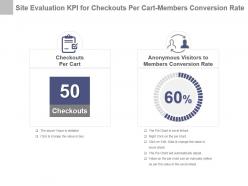
Presenting site review kpi for non active members page request 404 page time powerpoint slide. This presentation slide shows two Key Performance Indicators or KPIs in a Dashboard style design. The first KPI that can be shown is Checkouts Per Cart. The second KPI is Anonymous Visitors to Members Conversion Rate. These KPI Powerpoint graphics are all data driven, and the shape automatically adjusts according to your data. Just right click on the KPI graphic, enter the right value and the shape will adjust automatically. Make a visual impact with our KPI slides.
-
 Dashboard For Tracking Website Performance Customer Journey Touchpoint Mapping Strategy
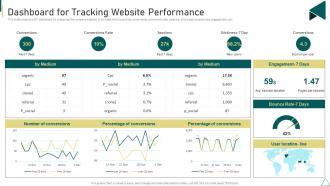
This slide covers the KPI dashboard for analyzing the company website. It includes metrics such as conversions, conversion rate, sessions, stickiness, bounce rate, engagement, etc. Present the topic in a bit more detail with this Dashboard For Tracking Website Performance Customer Journey Touchpoint Mapping Strategy. Use it as a tool for discussion and navigation on Dashboard For Tracking, Website Performance. This template is free to edit as deemed fit for your organization. Therefore download it now.
-
 Content Auditing Process For Website Visibility Improvement
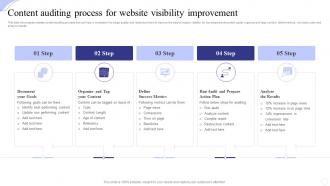
This slide showcases website content auditing process that can help in evaluation the blogs quality and restucture them to improve the search engine visibility. Its key steps are document goals, organize and tage content, define metrics, rum action plan and analyze results. Introducing our premium set of slides with Content Auditing Process For Website Visibility Improvement. Elucidate the five stages and present information using this PPT slide. This is a completely adaptable PowerPoint template design that can be used to interpret topics like Goals, Success Metrics, Action Plan, Analyze Results. So download instantly and tailor it with your information.
-
 Optimizing Mobile SEO SEO Reporting Dashboard To Evaluate Website Rank Ppt Template
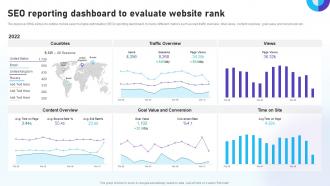
The purpose of this slide is to outline mobile search engine optimization SEO reporting dashboard. It covers different metrics such as web traffic overview, total views, content overview, goal value and conversion etc. Deliver an outstanding presentation on the topic using this Optimizing Mobile SEO SEO Reporting Dashboard To Evaluate Website Rank Ppt Template. Dispense information and present a thorough explanation of Content Overview, Traffic Overview, Goal Value And Conversion using the slides given. This template can be altered and personalized to fit your needs. It is also available for immediate download. So grab it now.
-
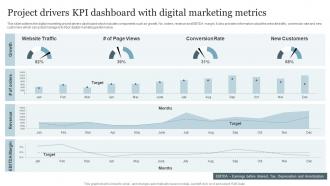 Project Drivers KPI Dashboard With Digital Marketing Metrics
This slide outlines the digital marketing project drivers dashboard which includes components such as growth, No. orders, revenue and EBITDA margin. It also provides information about the website traffic, conversion rate and new customers which can assist managers to track digital marketing performance. Introducing our Project Drivers KPI Dashboard With Digital Marketing Metrics set of slides. The topics discussed in these slides are Growth, Revenue, Conversion Rate, New Customers. This is an immediately available PowerPoint presentation that can be conveniently customized. Download it and convince your audience.
-
 Enterprise Website Report With Major Metrics
Presenting our set of slides with name Enterprise Website Report With Major Metrics. This exhibits information on three stages of the process. This is an easy-to-edit and innovatively designed PowerPoint template. So download immediately and highlight information on Enterprise Website Report, Major Metrics.
-
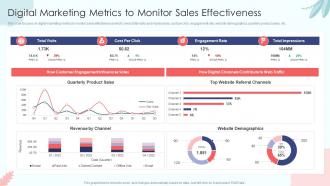 Digital Marketing Metrics To Monitor Sales Effectiveness Sales Process Automation To Improve Sales
This slide focuses on digital marketing metrics to monitor sales effectiveness which covers total visits and impressions, cost per click, engagement rate, website demographics, quarterly product sales, etc. Present the topic in a bit more detail with this Digital Marketing Metrics To Monitor Sales Effectiveness Sales Process Automation To Improve Sales. Use it as a tool for discussion and navigation on Effectiveness, Marketing, Metrics. This template is free to edit as deemed fit for your organization. Therefore download it now.


