Apple and Samsung are competitors in the electronics industry. While this dynamic brings us cutting-edge smartphones, the companies also engage in cooperative tactics behind the scenes, including in the supply chain, patent agreements, etc. Given Samsung’s domination in manufacturing and semiconductors, Apple uses its expertise and facilities to make or assemble parts for its devices like the iPhone or iPad. Even after several legal disputes, the two companies have entered into patent agreements to share intellectual property that serves them both. This is B2B (business to business) at its finest when the consumer is another business.
Wish to track your important sales metrics and showcase your progress to management? Click here for our blog, replete with pre-made templates!
Such agreements for procurement and patents require all parties to stay on top of the key metrics that help run B2B in a seamless manner. These include campaigns being run, interaction breakdown by device, click-through rate (CTR) and impressions, deals won and lost, expected income and ad revenue, demos delivered, etc. Keeping track of these KPIs and presenting them to stakeholders is done best with the use of PowerPoint Presentations, and these are delivered with ease using SlideTeam’s readymade templates.
B2B Metrics Presentation Templates
Creating a new presentation from scratch for each meeting or department is a time-consuming activity, and time is money. This is where SlideTeam comes in with its content-ready and 100% editable slides that do the work for you. This means you get a starting point, a solid framework, and the flexibility to tailor the slides to your needs. So, no more starting from scratch!
Are you a sales rep who needs to deliver his performance numbers often? Then click here because we have the perfect dashboard templates for you that will reduce your workload by half!
You will use eye-catching charts, graphs, and tables to deliver data in an easy-to-understand format that helps the audience follow your presentation. The slides within this blog enable you to deliver information on how well the B2B connections are working and where the company is in the project.
Let us tour these templates and see what they have to offer.
Template 1: Marketing Campaign Dashboard for B2B Marketers
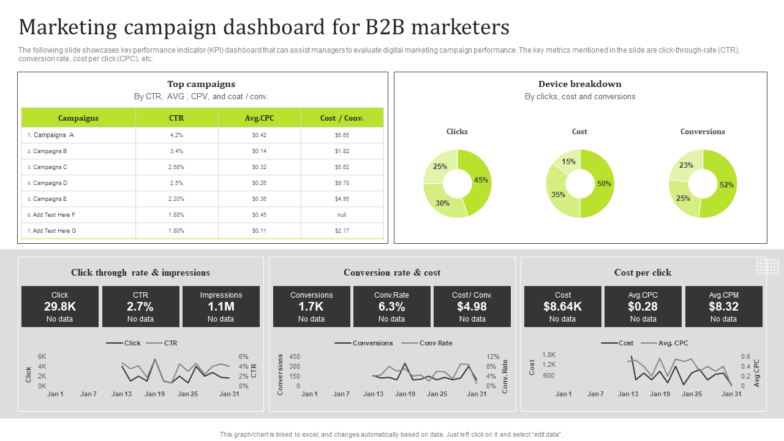
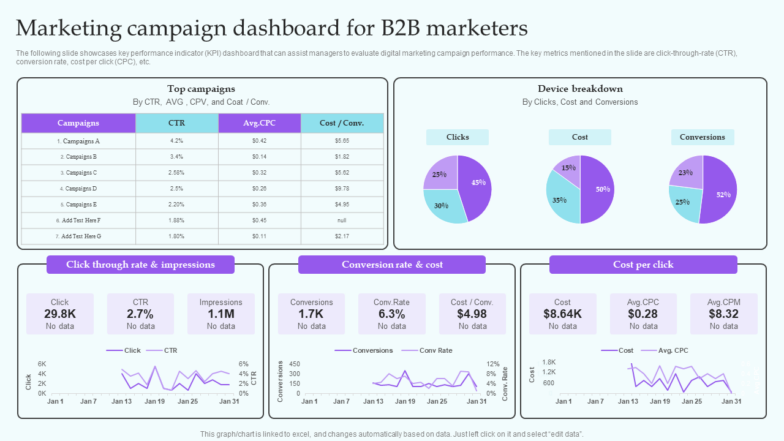
Track and deliver the key performance indicators (KPIs) for your B2B marketing campaigns. The layout uses a table to present a list of the campaigns and their details, like the CTR, average CPC (cost per click), and the cost-to-conversion ratio. Showcase your source of clicks, cost, and conversions by device such as smartphones, computers, gaming consoles, etc. Graph the KPIs against time at the bottom of the layout to showcase and compare metrics like CTR and impressions, conversion rate and cost, and CPC. Download this slide now from the link below.
Template 2: B2B Marketing KPI Analysis Dashboard
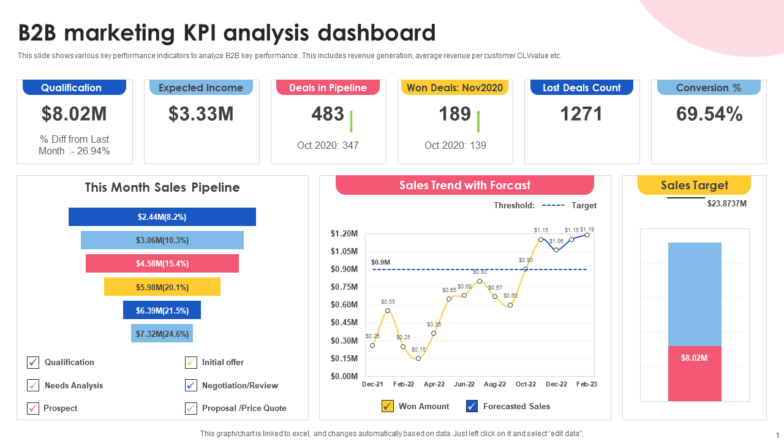
Conduct a marketing analysis on your B2B marketing projects with this PPT Slide. Deliver metrics such as qualification amount and expected income, deals within pipelines, the number of deals won and lost, and the conversion rate. This gives stakeholders a good idea of your strategy’s performance. Present a color-coded monthly sales pipeline with a neat legend at the bottom. Use charts and graphs to present your sales forecast for the year and the total sales target. Download this template now to boost your presentation with numbers and visuals.
Template 3: B2B Marketing Dashboard with Total Deals
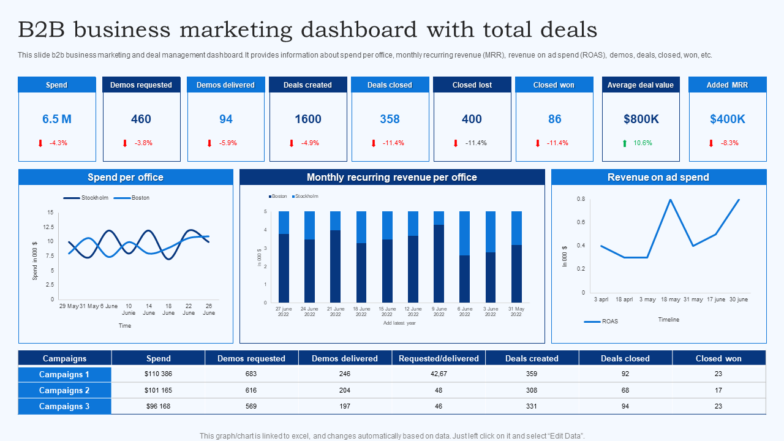
Showcase how well you’ve managed B2B deals with this template. Present KPIs such as money spent so far, demos requested/delivered/created/closed, the number of closed deals that were won and lost, as well as the average deal value and added monthly recurring revenue (MRR) in numbers and percentage change since the previous year. Use the graphs to showcase spending for each office, MRR per office, and the revenue gained vs the ad spending. Finish off with a table at the bottom on the marketing campaigns and their information. Grab this slide now.
Template 4: Determine B2B Account Management Dashboard
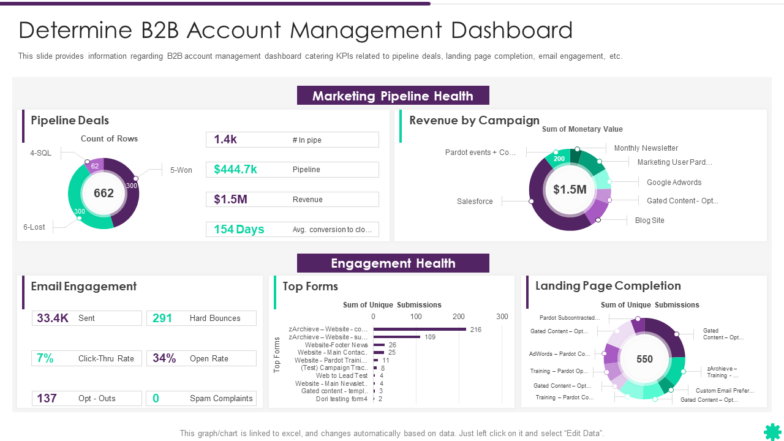
Manage the B2B accounts for your business with accuracy and precision with this appealing PPT Layout. The slide is divided horizontally into two parts: marketing pipeline health and engagement health. In the former, deliver KPIs like pipeline deals (in the pipeline, revenue, conversion to CPC ratio, etc.) and the revenue campaign using pie charts (everyone's favorite visual aid). In the latter half of the layout, the data is presented as gained from email engagement, top forms submitted, and loading page completion information. All routes lead to this template’s download.
Template 5: B2B Lead Generation Dashboard with Metrics
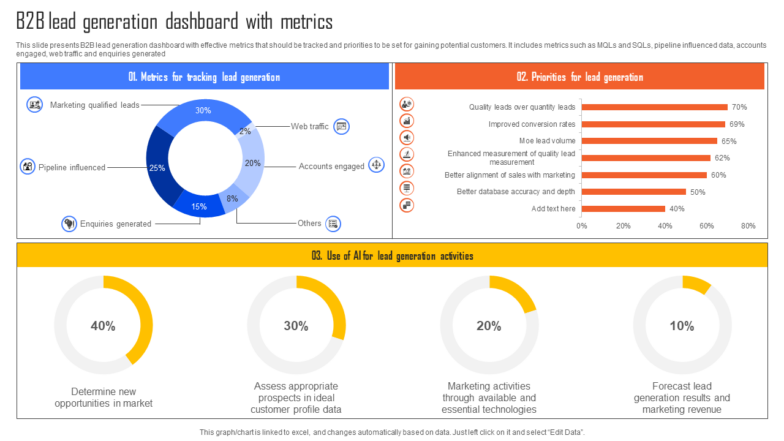
No leads, no sales. Showcase your lead generation strategies and their outcomes with this PPT Slide. Beginning with the metrics that track this, the layout presents the priorities and use of AI in lead generation. The metrics include marketing qualifying leads, pipeline influence, inquiries generated, etc. The priorities focus on quality vs quantity in leads, conversion rate improvement, aligning sales with marketing, etc. The use of AI enables you to determine new opportunities, assess prospects, execute marketing activities, and make lead forecasts. Download this slide now to optimize the lead-to-client pipeline at the start.
Template 6: Effective B2B Demand Generation Plan Dashboard
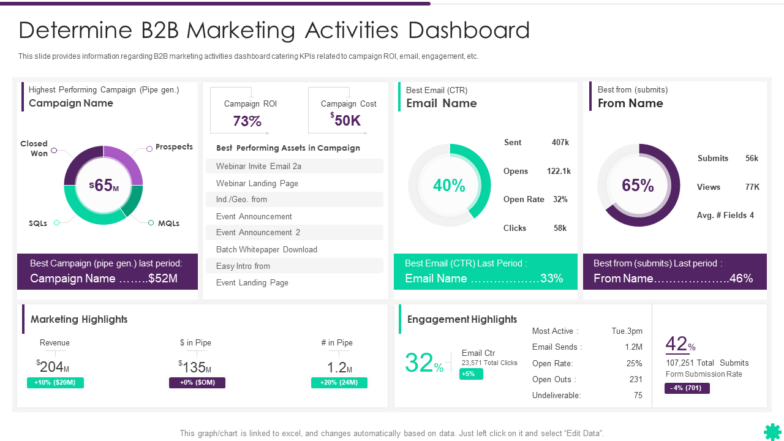
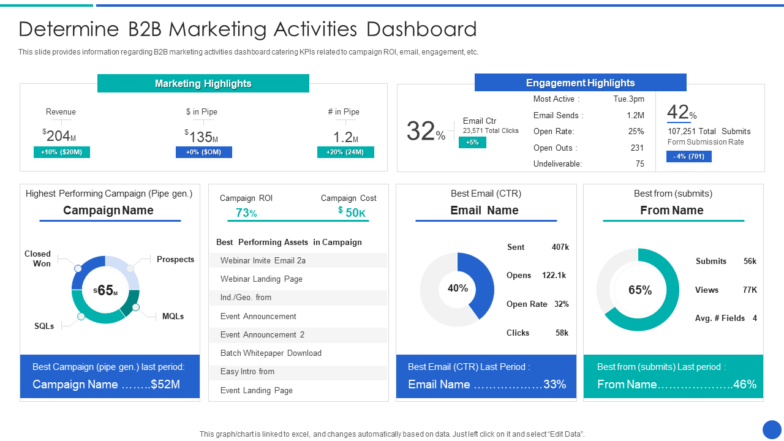
As touched upon in the previous template, this PPT Slide will help you with the marketing activities that B2B involves. Showcase information on the marketing campaigns (current and previous) and their ROI. Present the CTR for each email category (sent, opened, etc.) and form submissions. Deliver the highlights for the marketing and engagement activities to stakeholders as well. Download this PPT Slide to showcase the progress and efficiency of your marketing campaigns in engaging other businesses as clients.
Template 7: Marketing Campaign Dashboard for B2B Marketers (IT Industry Market Analysis Trends)
A strong sales department is a sign of a healthy bottom line. Use this PPT Template to keep accurate and precise track of your sales team and their performance and optimize their sales process. From the best performers by the number of leads, revenue, and pace of revenue, this layout breaks down the revenue collected and leads generated by the region. This provides a comprehensive overview of the lead generation-to-client pipeline and allows management to find improvement areas. Download now.
Template 8: B2B Sales Representative Insights Dashboard
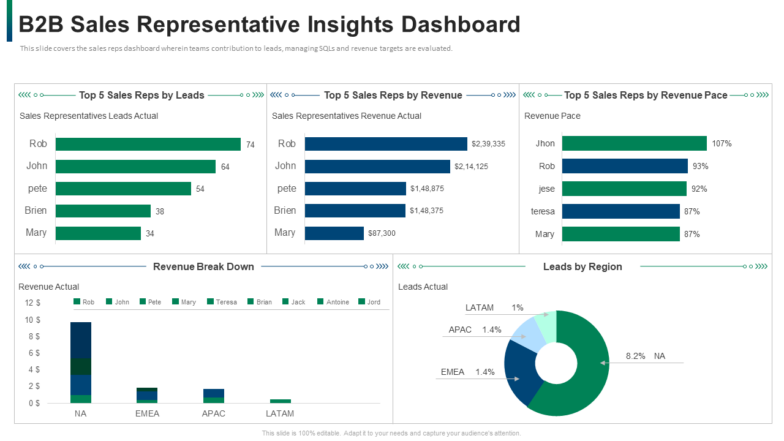
Sales is a game of numbers, and this dashboard is a quick reference to the gameplay. Showcase the best sales reps to stakeholders by leads, revenue, and revenue pace. This allows you to find the best performers and their sales techniques that can be applied to the entire department. Present the revenue breakdown and leads by region to find areas of improvement for your business. The layout uses eye-catching charts to present this data to ensure the audience pays attention and can follow along. Grab it now.
Template 9: Determine B2B Marketing Demystifying Sales Enablement for Business Buyers
Use this PPT Theme to present the marketing strategies you implemented and how they panned out. Showcase data on the marketing and engagement highlights, division of campaigns launched and their performance with the cost and ROI, email marketing results, and forms/questionnaires submitted. Each metric is detailed in its slot, providing the information stakeholders need to approve their continuation or termination. Get this template to find what works best for your marketing needs and why.
Template 10: B2B Business Lead Management Dashboard
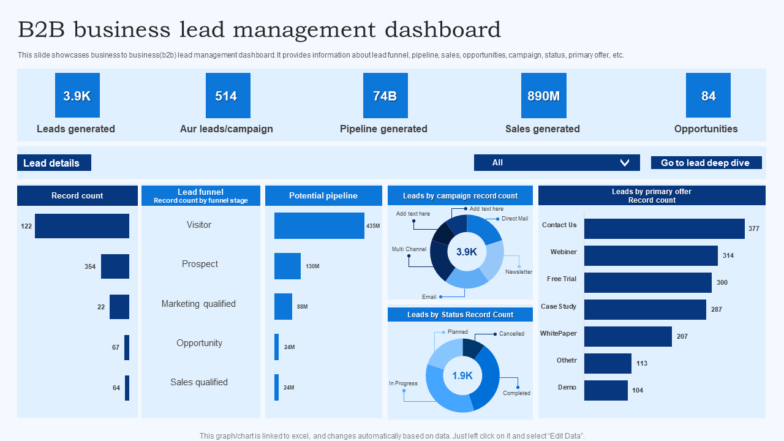
Deliver the details on your lead generation and management efforts with this PPT Layout. Showcase KPIs like the leads generated and campaigns launched, further divided into pipeline and sales as sources and the number of opportunities created. Present charts to visually inform the stakeholders on record count, lead funnel by stage, leads by campaign, etc. Download this template to track your lead/sales pipeline in real time.
From Our Business to Yours
With our B2B Dashboard templates, you can gather relevant metrics, deliver them with panache, and find areas of improvement to optimize your B2B operations. With slides rich in content and completely customizable, you can create an effective medium to showcase your progress and create and execute data-driven strategies. Grab them right away!
Access these slides with a single click and streamline your B2B pipeline. You can choose one of our subscription services: monthly, semi-annual, annual, annual+ with a click here.
Create and execute the best strategies with our amazing templates on B2B playbooks in this blog here!
P.S. The templates in this blog are not ranked in any particular order. Pick the one(s) you like and download it!




 Customer Reviews

