“Sales are contingent upon the attitude of the salesman, not the attitude of the prospect.” - W Clement Stone, American businessman and philanthropist.
In the sales domain, having a finger on the pulse of your team’s execution and achievement is paramount. If sales representatives are the heartbeat of revenue generation, sales representative dashboards give you the health of this vital, life-giving machinery of the business system.
Dashboards provide a feast of metrics such as revenue breakdown, leads actual, etc., that drive success. This blog will elevate your sales game with SlideTeam’s handpicked collection of dynamic sales representative dashboards. What’s more! Access a collection of presets for crafting an impactful sales plan to streamline your sales strategy.
Why Sales Representative Dashboards Matter
Beyond the conventional spreadsheets and reports, sales representative dashboards offer a dynamic snapshot, unveiling the real story behind the numbers. Here, insights are real-time, and strategies are sculpted with precision. Here’s why they matter:
- These provide a view of team performance across key metrics.
- These help ensure tracking, reporting, and forecasting accuracy based on real-time data.
- Tracking sales metrics like revenue breakdown and leads actual in real-time means reps and managers can view their performance as it happens.
- They help identify growth opportunities, such as net promoter score, challenges, and changes.
- They assist sales vice-presidents (VPs) in forecasting headcount, predicting quarterly revenue price, and monitoring monthly goal attainment.
Sales Rep Dashboards help in tracking metrics such as:
- Occupancy Rate – These map productivity and dive deep into the efficiency of your sales force and visualize occupied vs. unoccupied time to refine strategies.
- Net Promoter Score (NPS) –Meant to ensure customer centricity, these gauge the likelihood of customer recommendations and track NPS trends to ensure customer satisfaction.
- Revenue Breakdown - Decoding Success: They determine the sources of revenue and identify high-performing products or services.
- Revenue Price indicate
how to maximize profitability: These analyze the pricing strategy's impact on revenue and optimize pricing for maximum profitability. - Leads Actual go into aligning strategy: These bridge the gap between leads generated and actual conversions. It helps refine lead-generation strategies based on actual outcomes.
Industry surveys revealed that organizations using sales representative dashboards experienced a:
- 30% increase in conversion rates
- 25% improvement in customer satisfaction.
- 15-20% surge in ROI
The pain of navigating through complex data and the solution that our PPT Templates offered are the focal points of this revelation. These content-ready dynamic canvases are 100% editable and customizable to offer foundation, structure, and adaptability needed to craft a presentation! Say good-riddance to the time-consuming task of building a dashboard from the ground up —these slides are your ultimate time-saving ally, ensuring your energy is invested where it truly matters: in delivering a compelling and impactful presentation!
Let’s delve into the essentials of these indispensable tools that propel your sales game to unprecedented heights.
Let’s explore!
Template 1: Dashboard Snapshot to Measure Sales Rep Performance Successful Sales Strategy to Launch
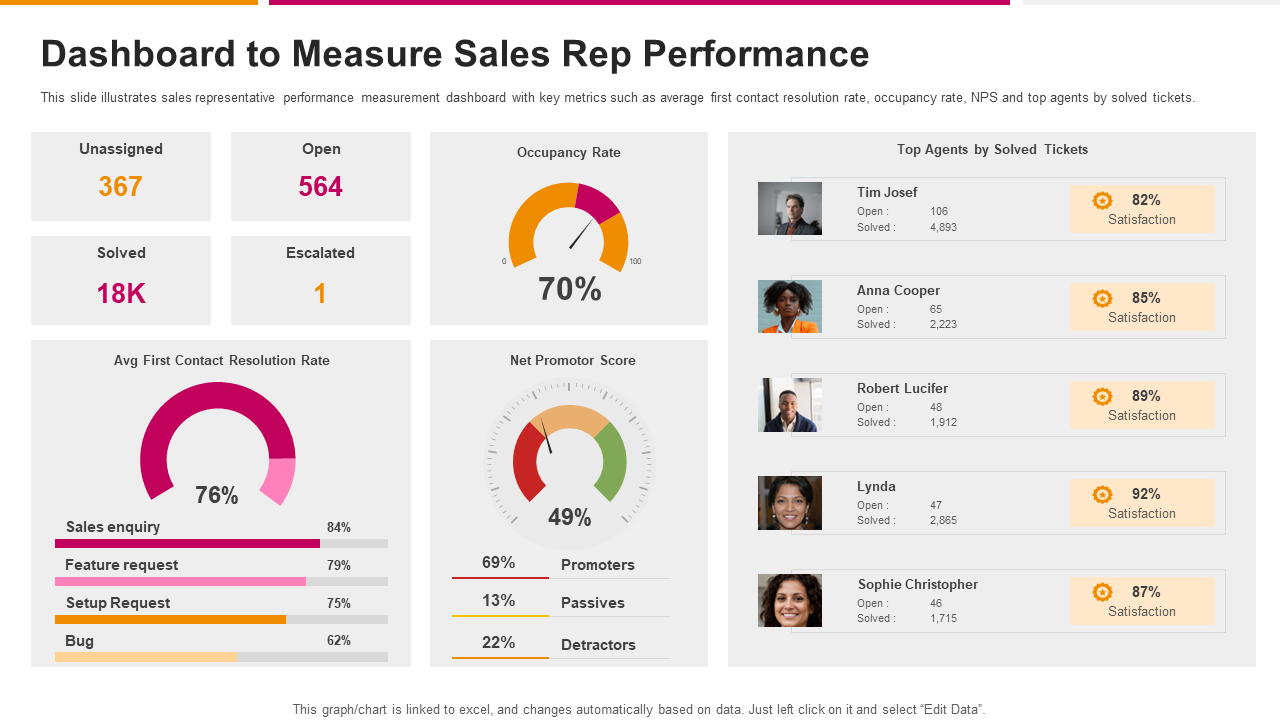
This dashboard is a powerhouse of analytics designed to provide a nuanced understanding of sales representative performance. It outlines key metrics such as occupancy rate tracking, which visualize how each sales representative uses their time. Occupancy rate identifies peak productivity periods and areas for improvement. The next key metric discussed here is the net promoter score (NPS), which offers an assessment of customer satisfaction. NPS allows for strategic adjustments based on customer feedback. Other critical metrics discussed are the average first contact resolution rate and leads-actual. The dashboard provides statistics on open enquiries and total solved requests and mentions top agents by solved tickets. Download this strategic tool, offering insights to refine sales strategies, enhance customer satisfaction, and maximize revenue.
Template 2: B2B Sales Playbook Sales Representatives Performance Tracking Dashboard
B2B sales representatives understand the inner mechanics of how to execute sales, and with adept sales strategies, they contribute to revenue generation, portfolio growth, and relationship-building. Tailored for the intricate landscape of B2B sales, this dashboard goes beyond conventional metrics, providing a holistic view of sales representative performance. It provides key numbers on top performers by leads, revenues, etc. It also measures leads by region; leads-actual empowers teams to refine lead-generation strategies based on real-world outcomes. The dashboard demonstrates revenue breakdown. This crucial metric helps assess the productivity and effectiveness of the individual sales representatives. Further, the dashboard spotlights key insights, such as the sales representative’s achievement of the highest revenue relative to quota. Sales reps undeniably drive activities like customer acquisition, relationship building, and closing high-value deals. Download this B2B-focused dashboard, guiding sales representatives toward success in the complex realm of business-to-business transactions.
Empower Your Sales Team: Download Your Success
A sales representative dashboard offers a real-time, realistic view of a sales team’s performance. This visual representation of sales metrics, usually in a graph or chart, allows sales team members, management, and stakeholders to track data sources and see if sales forecasts are being met. It can also help C-level executives and managers monitor and control crucial sales KPIs such as occupancy rate, net promoter score, revenue breakdown, leads actual, and more.
The above sales representative dashboards are not just slides. Every metric, graph, and visualization is a stepping stone towards sales excellence. Your journey to unparalleled success begins with a click. Download your template and witness the evolution of your sales strategy. Equally, dive into a selection of exceptional marketing dashboards, each backed by real-world examples and samples for effectual marketing analysis and insights.
Remember, in the sales world, information is power, and the above well-built sales representative dashboard is your key to unlocking that power!


 Customer Reviews


