If you are a hardcore fan of cricket as I am, you must be knowing that a player is considered a good player if he is an all rounder i.e baller, batsman and a fielder. No single statistic can determine the performance of the player. It has to be an amalgamation of all three characteristics which together determine whether he is a good player or a bad one.
Similar is the case with a business or a firm striving to be the best. You can’t judge or analyse the overall financial position of the business without examining its various metrics. No single business metric can provide an insight into your company’s value.
Here are my top 7 recommended business metrics that every company should keep an eye on to gauge upon its overall value and growth:
1. Revenue Growth
Revenue growth highlights the increase or decrease in company sales over a period of time. It is used to measure how much a company is expanding within the stipulated time period. Usually depicted in percentage form, it helps the company to identify its increasing and decreasing trends.
Every business strives to increase its revenue and so keeping a track of this metric is mandatory for a business to reach greater heights.
However, a business should not track any revenue growth, rather they should track yearly revenue growth to get a better picture of its functioning.
Formula to calculate Revenue Growth- Current Year Revenue- Previous Year Revenue
Previous Year Revenue
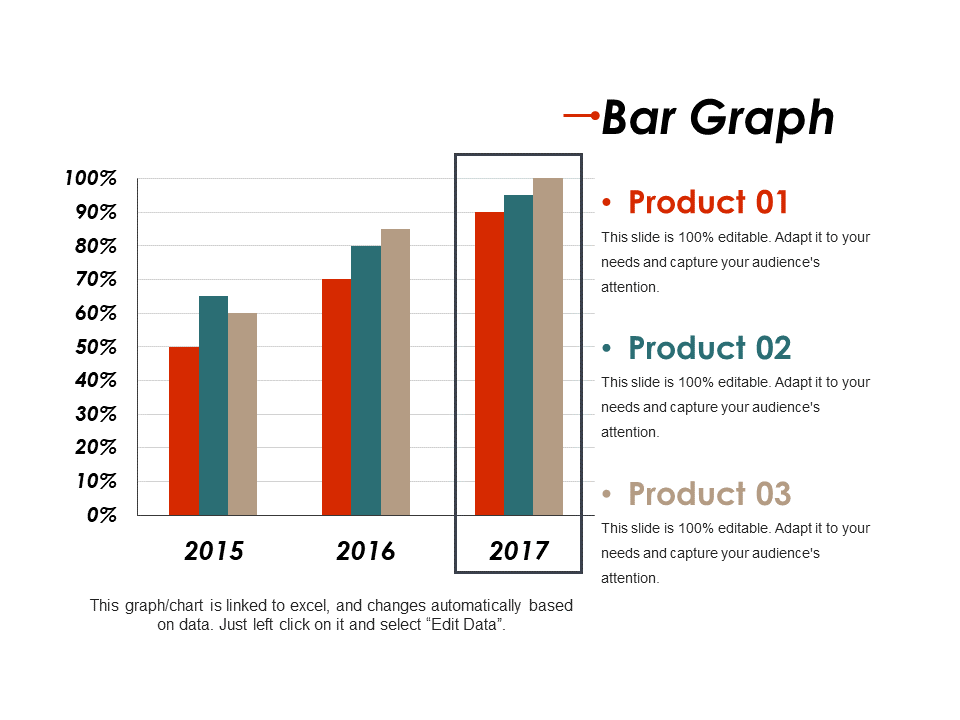
Download this professionally designed Bar graph showing Revenue Growth Template
2. Cost of Production-
-
Average Fixed Cost
Fixed Costs are constant business costs that do not change according to the sales the company is making. It remains constant irrespective of the products sold.
For example, buying a new office will not change your cost acquired on utility bills, property tax and other aspects even if your sales increase from 2,000 to 20,000 products.
Formula to calculate Average Fixed Cost- Total Fixed Cost
Number of Units Manufactured
Estimating the company’s average fixed cost will let you determine the products potential to yield profits. Thereby helping you decide your expenditure on variable fixed cost which is our next metric.
-
Average Variable Cost
Variable cost refers to the cost of all the material and labor required to produce a particular product. It is directly related to the company’s production. Hence, if a company produces more products the variable cost increases; if a company produces less products the variable cost decreases.
For Eg- Sales commission, Cost of raw materials that are used for production, etc.
To calculate Average Variable cost, use the following formula-
Formula to calculate Average Variable Cost- Total Variable Cost of each Product
Total number of units produced
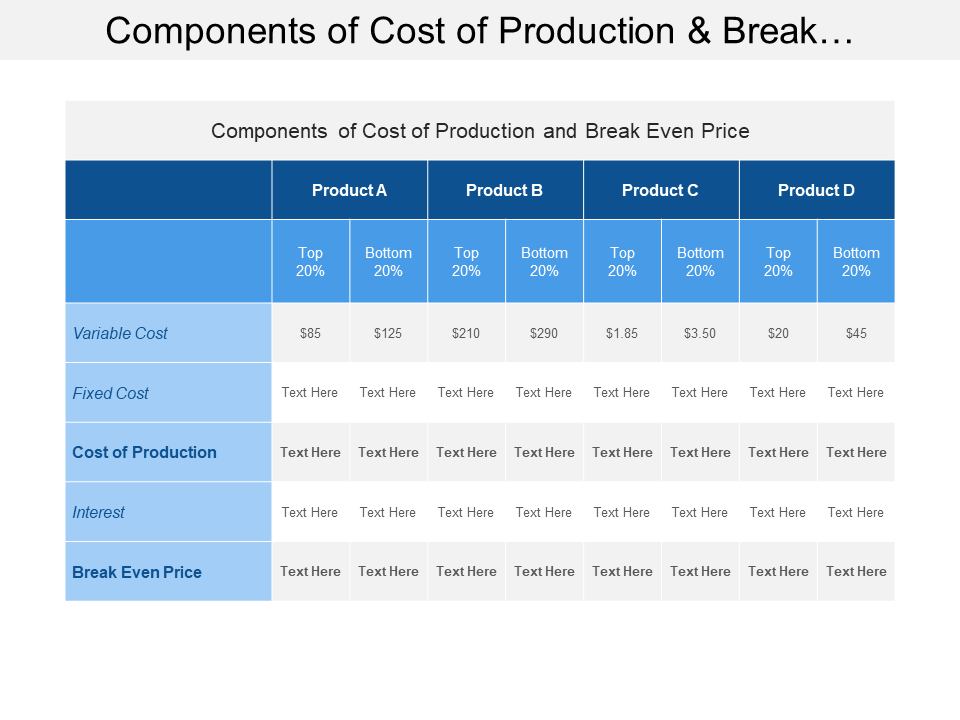
Grab this unique Components Of Cost Of Production And Break Even Analysis
3. Contribution Margin Ratio
Contribution Margin Ratio is also called the dollar contribution per unit which is calculated by using the variable cost per unit and subtracting it from the selling price of each unit.
As a company or a business, it is critical to track your contribution margin ratio as it helps you to assess production of which products is yielding you more profits and which is not. Hence, you can focus on producing only those products which are profitable rather than those that are not so profitable.
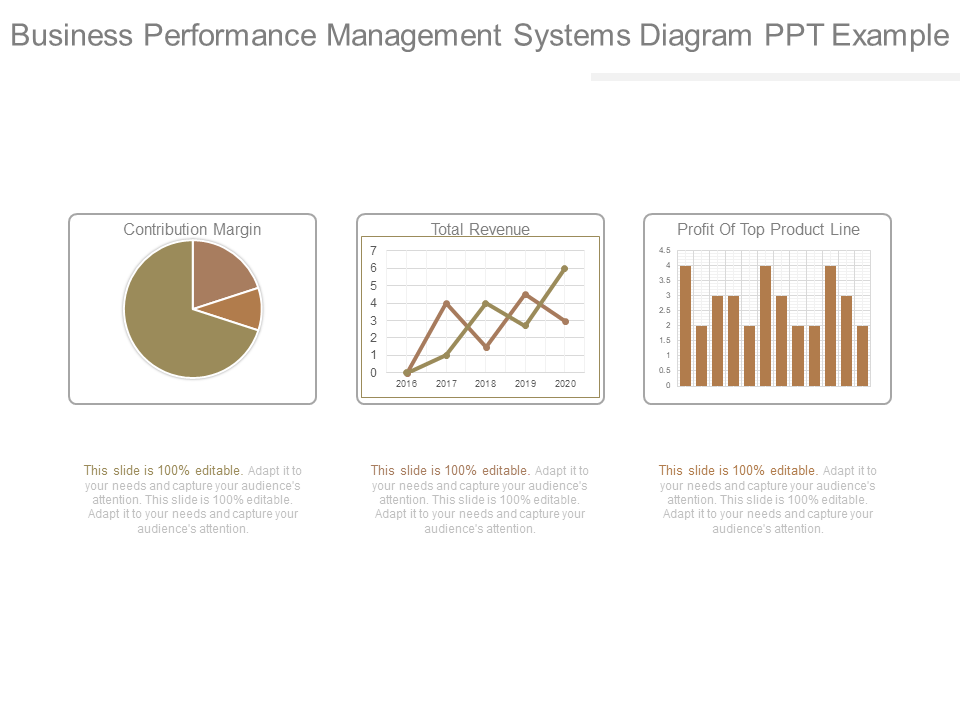
Click here to download this Business Performance Management Systems Diagram PPT Example
4. Break-Even Point
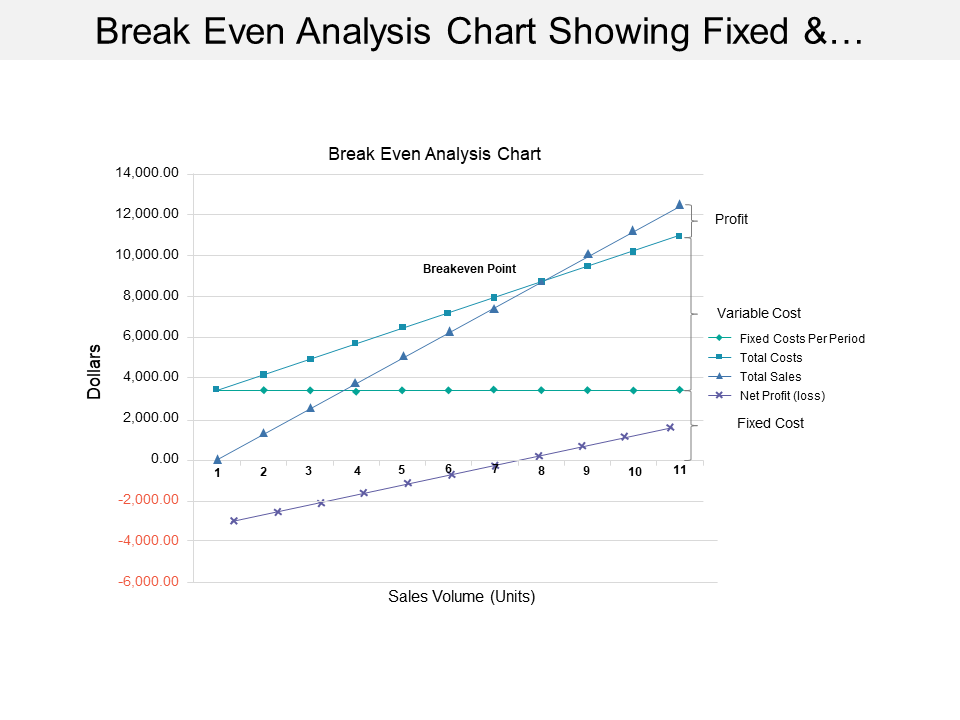
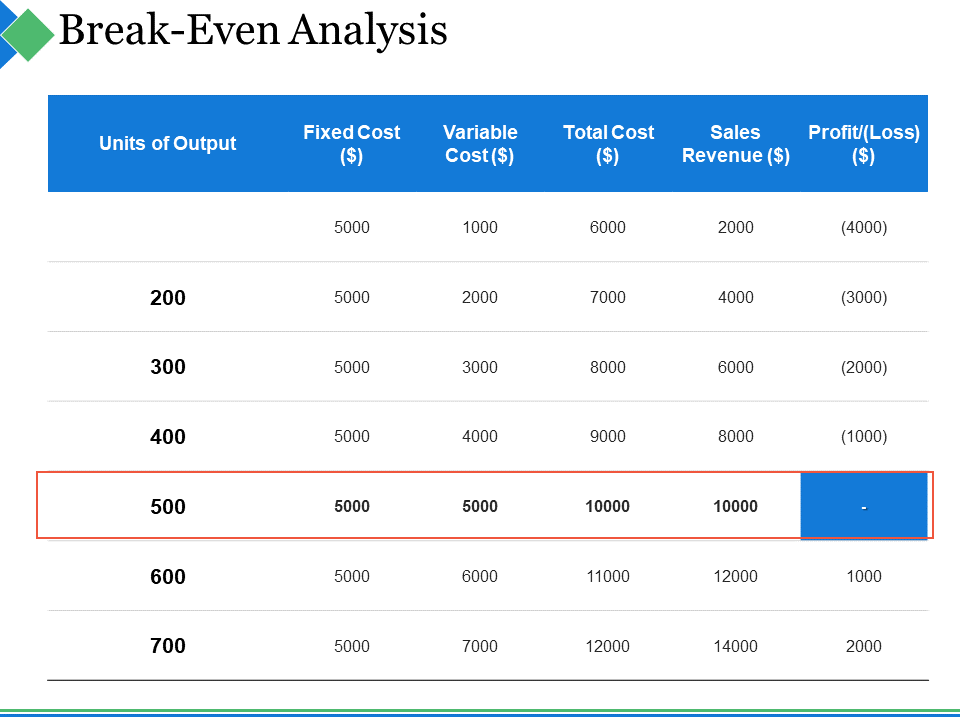
Break Even Point is the point where the total cost is equal to total revenue i.e. there are neither any profits nor any losses.
A company should know its break even point to make sure that it doesn't lose money during a stipulated time period. Also moving across the break even point will help the company to increase its profits during that particular period which is quite beneficial.
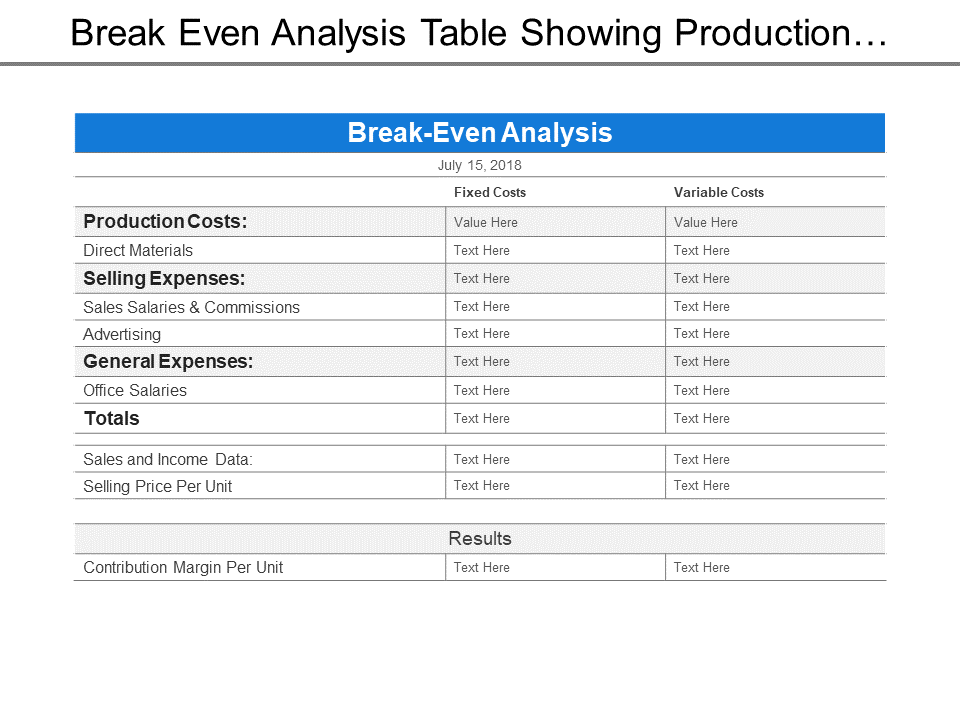
Download this Break Even Analysis Table Showing Production Costs And Sales
Download this Break Even Analysis Chart Showing Fixed And Total Costs
Download this Break Even Analysis PPT Summary Ideas
5. Cost of Goods Sold
Another name for cost of goods sold is cost of sales or cost of services which is important to set prices. This includes expenses of direct labor and direct material but excludes all the indirect expenses like overhead costs, sales force cost, distribution cost etc.
It is extremely important for a company to track its Cost of Goods Sold as it directly affects it. Such as, if the COGS increases, profits will decrease. Similarly, if there is a decrease in COGS, profits will increase
6. Gross Profit Margin
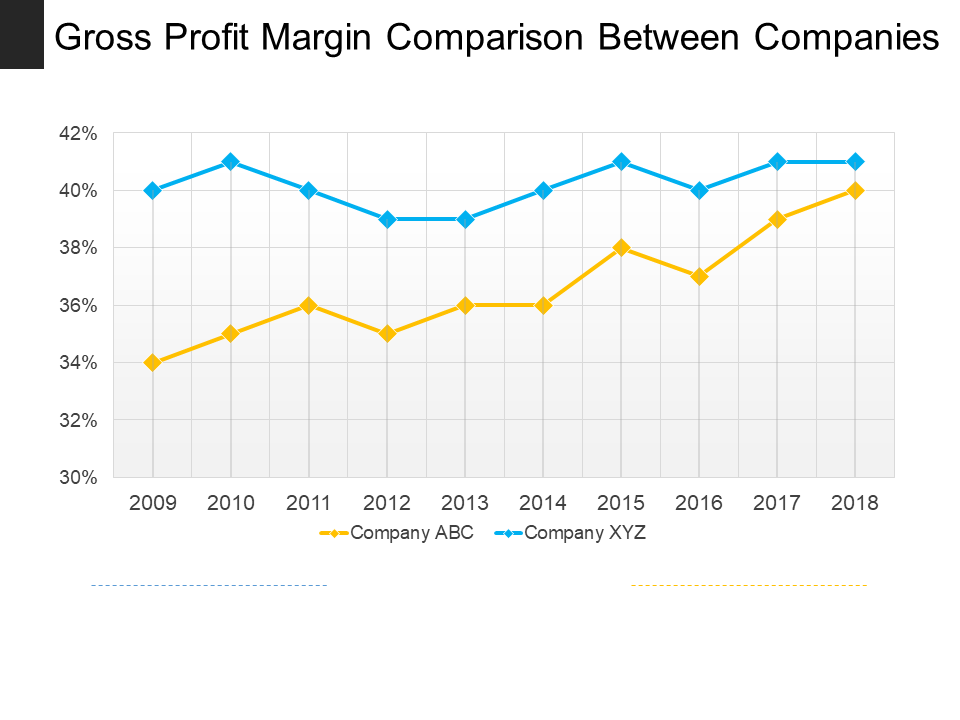
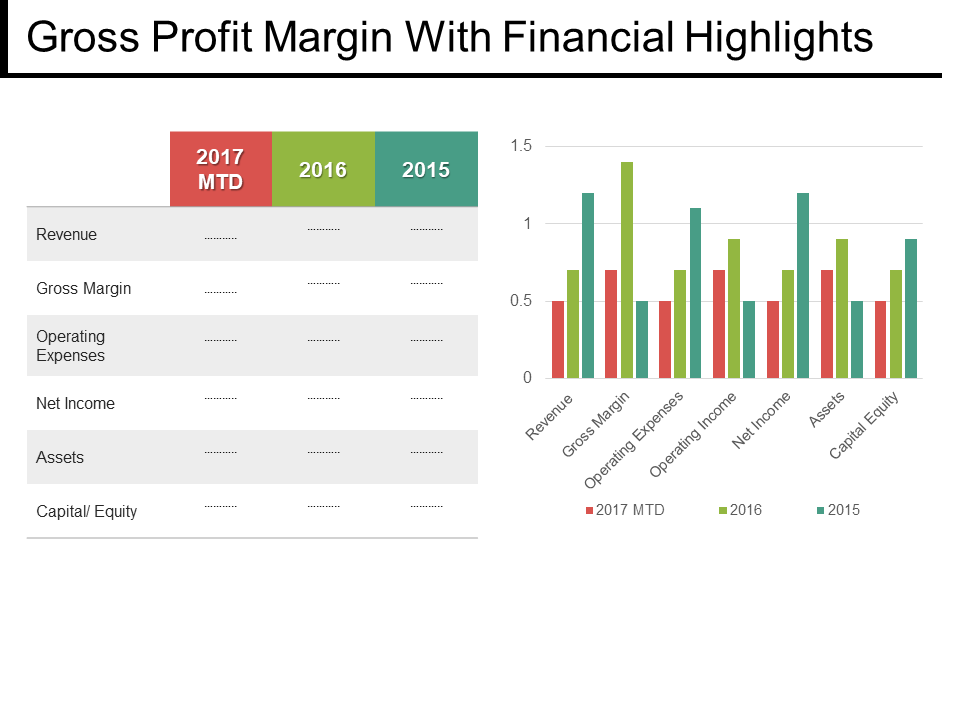
Gross Profit Margin is calculated by subtracting the Cost of Goods Sold from the total revenue and dividing all of it with revenue, which reveals how efficient is a company’s production process.
It is an important metric as it helps in analyzing the financial health of the company. It also helps unfolding the amount of left over money for other expenses after bearing the production cost. A hike in the Gross Profit Margin will mean that the company has a good financial health and vice versa. This margin serves as an essential assessment tool for a company as its helps the company to compare itself with its competitors.
Feel free to explore this content- ready Gross Profit Margin Comparison Between Companies
Grab this professional Gross Profit Margin With Financial Highlights
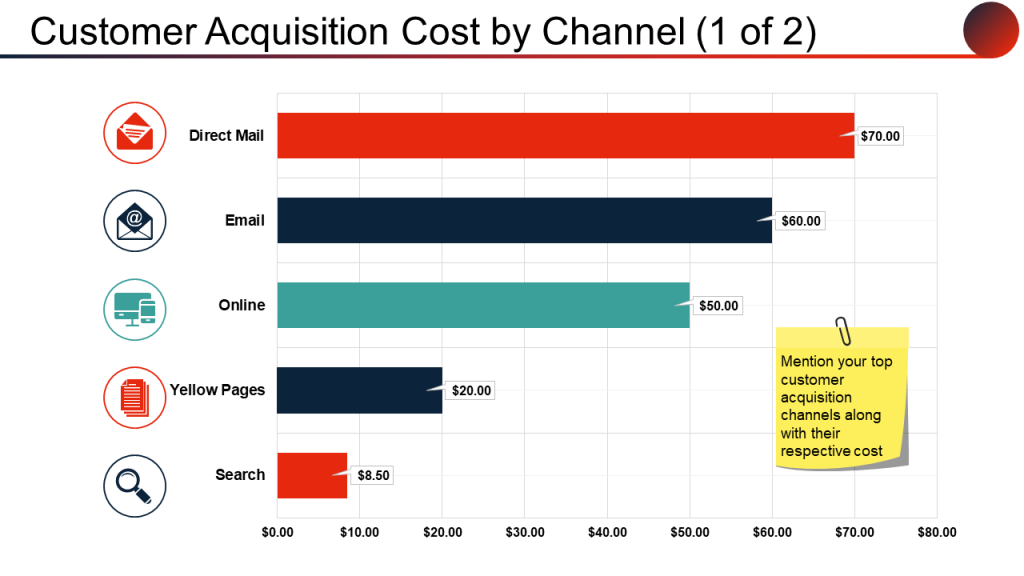
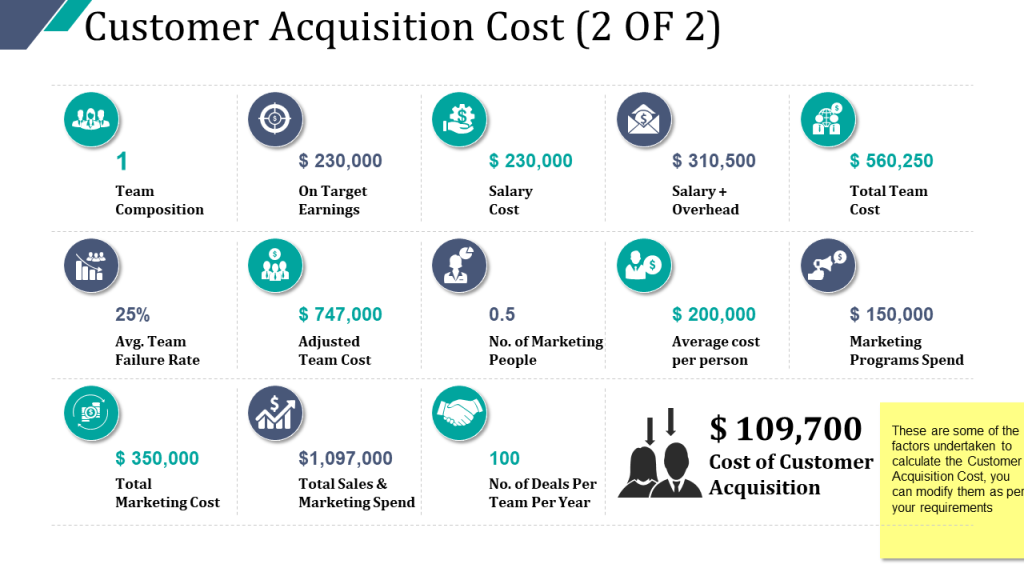
7. Customer Acquisition Cost
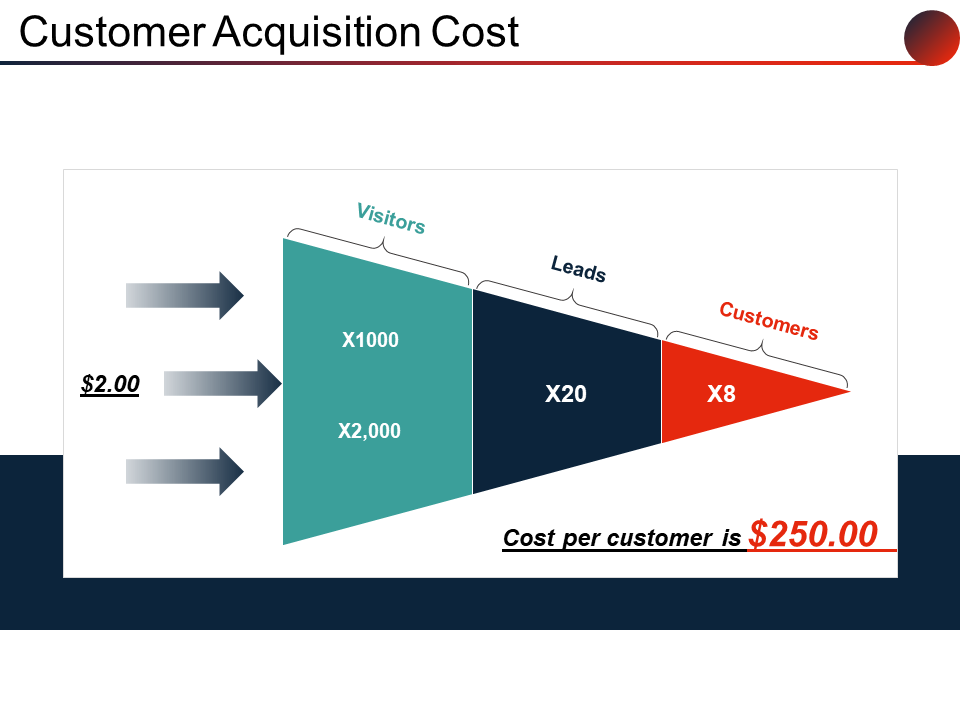
Customer Acquisition cost is the cost of acquiring a single customer. It includes all the activities related to sales and marketing campaigns.
It is very important to note how much you are spending on each customer so that you can help reduce it because reduction in Customer Acquisition Cost will help increase your profit margin.
Formula To calculate CAC- Total money spent to acquire the customers
Number of customers acquired in the period the money was spent.
For E.g. if a company’s total money spent is $100 and the number of customers are 50 then CAC is $2.
Grab this stunning Customer Acquisition Cost PowerPoint Layout
Download Customer Acquisition Cost By Channel PowerPoint Ideas
Click here to own this Customer Acquisition Cost PowerPoint Images
Grab this ready-made highly researched Customer Acquisition Cost Deck
Even though tracking all these business metrics is a tedious job, they are worth your efforts. So track them and do let us know which is your favourite business metric to track in the comment section below!
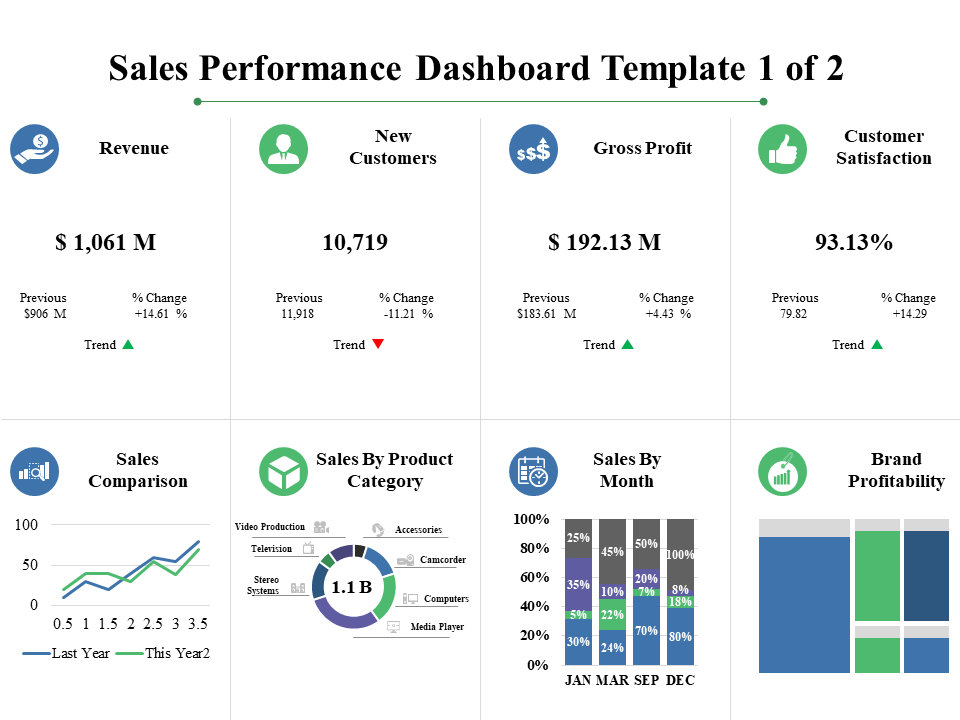
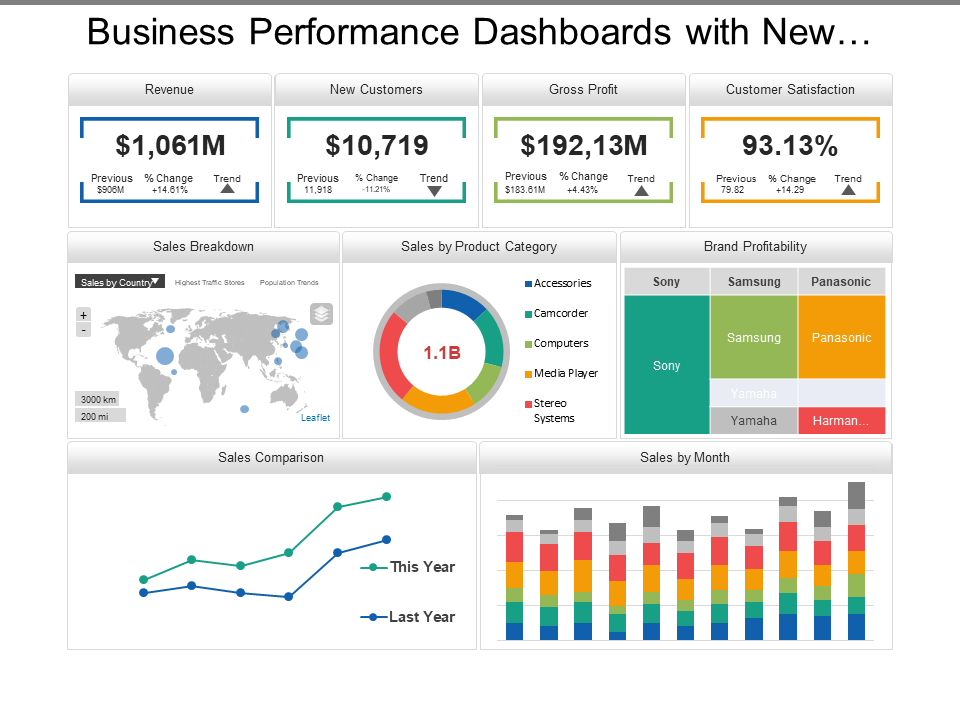
Dashboards to Download:
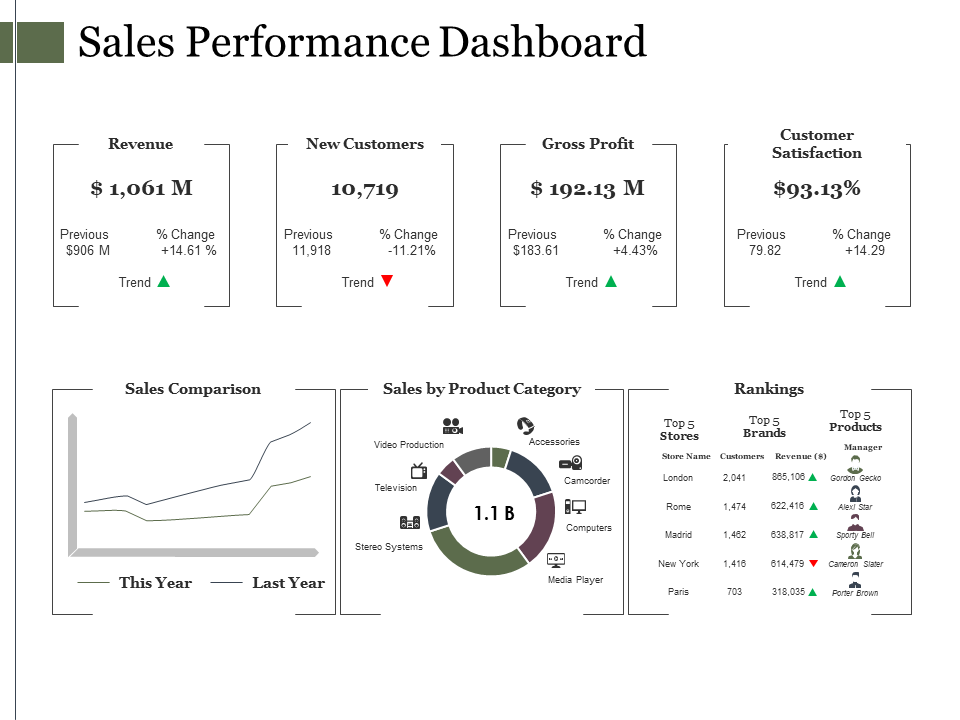
Access this amazing Sales Performance Dashboard
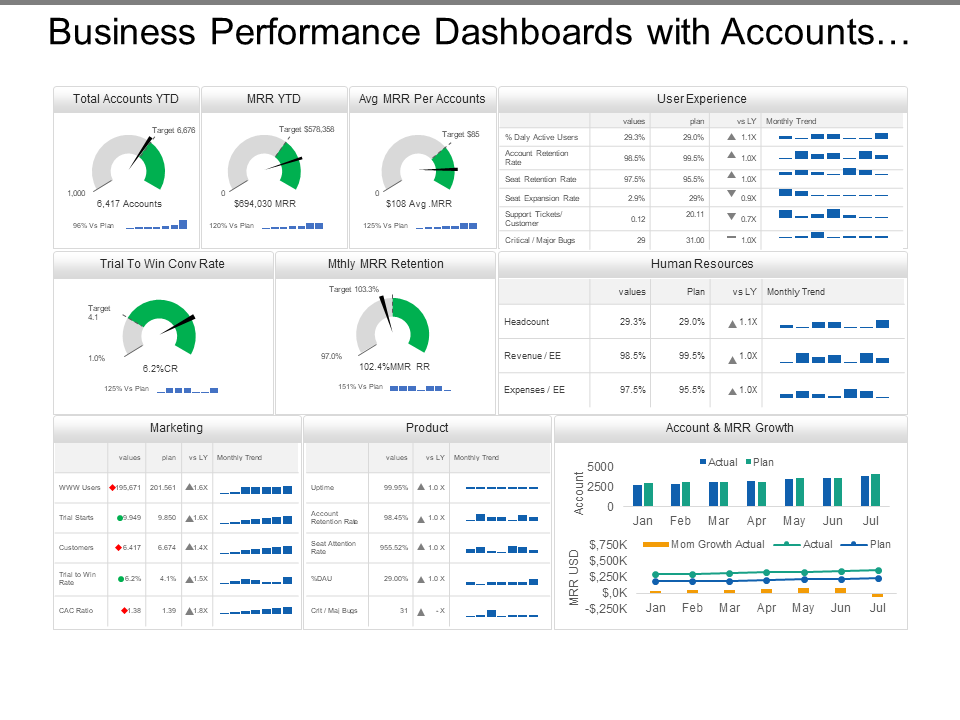
Download and make this wonderful Business Performance Dashboard your own
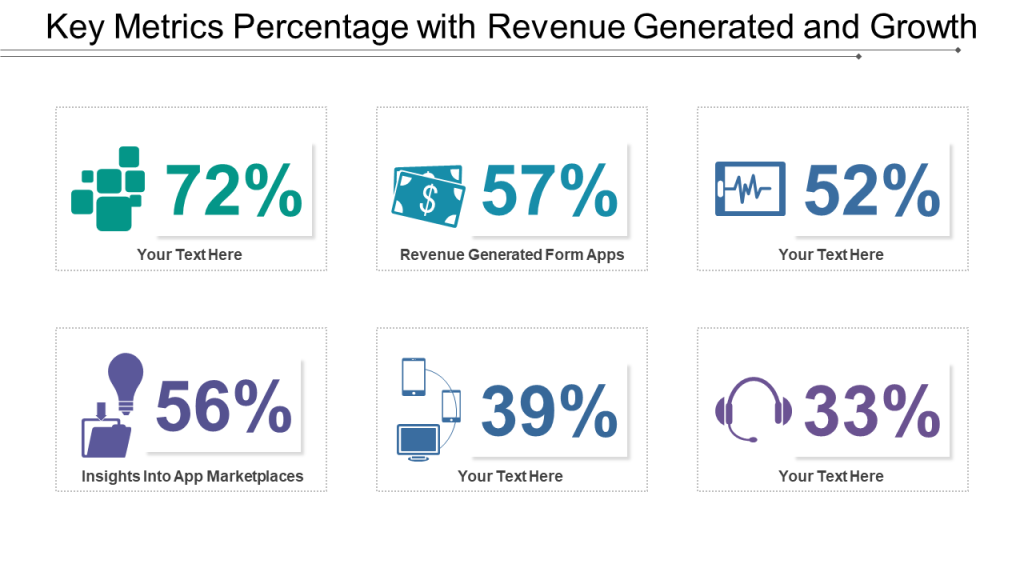
Visit here to own this Key Metrics Percentage With Revenue Generated And Growth Dashboard
Avail this Business Performance Dashboards
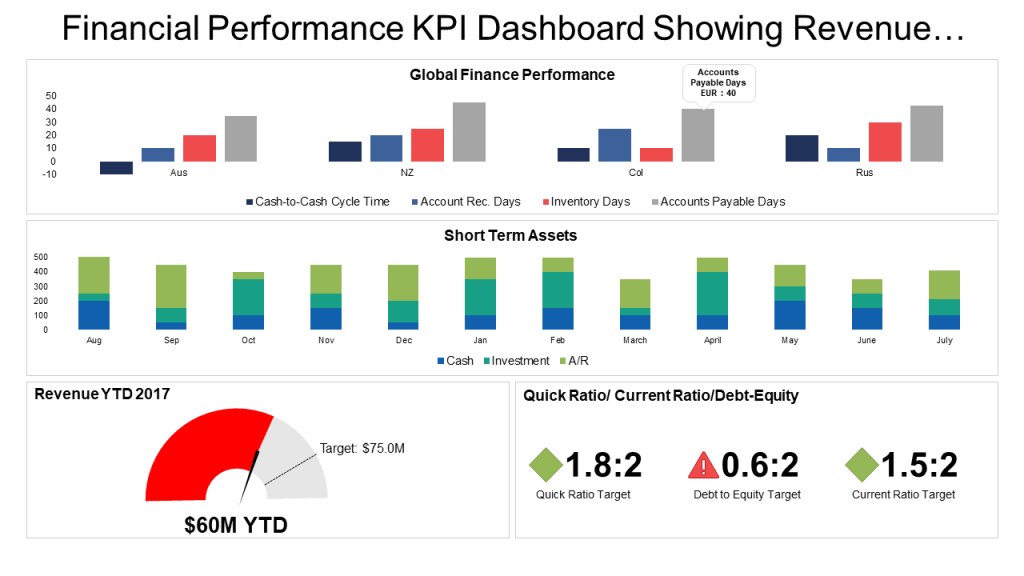
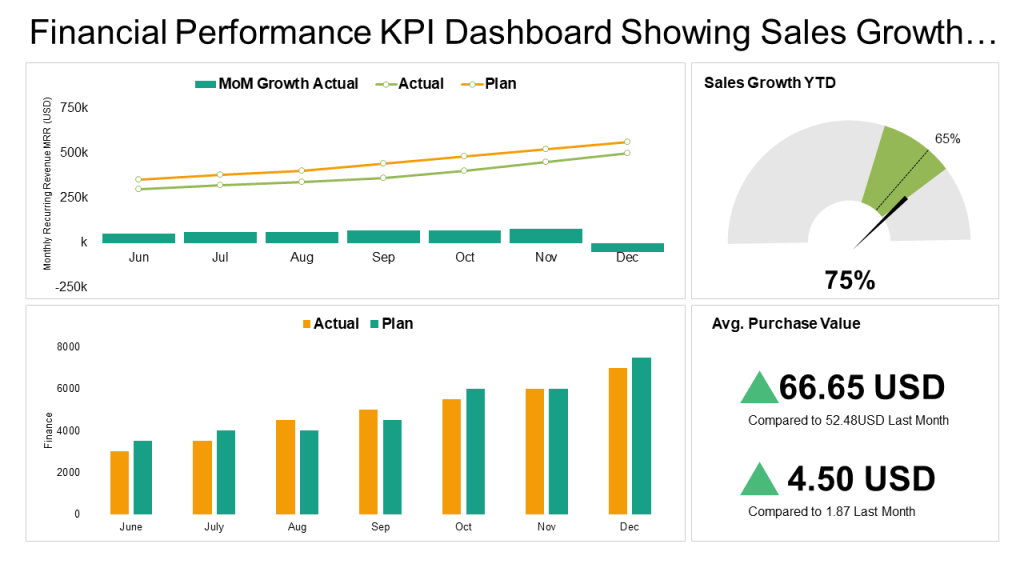
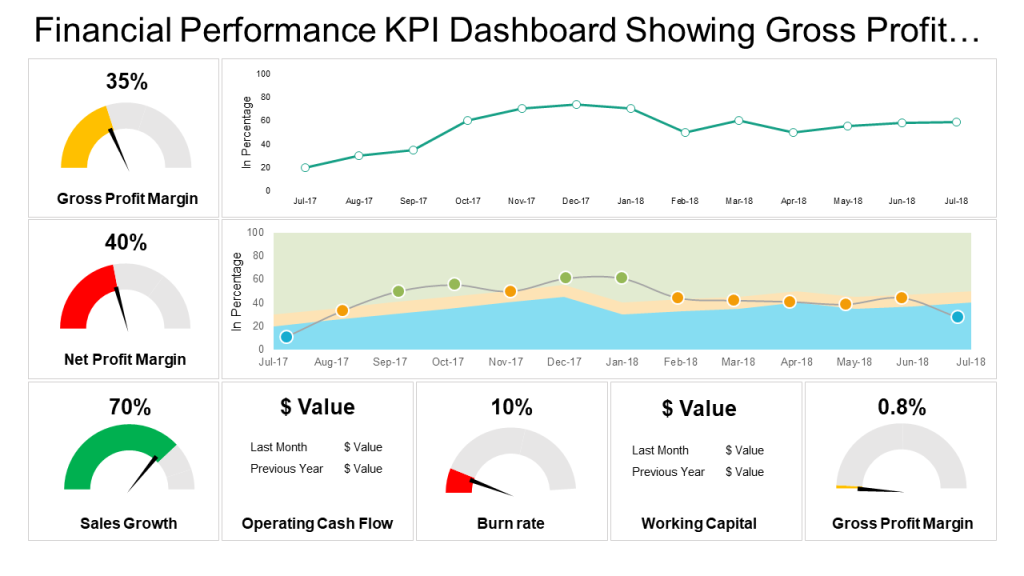
Click here to access this Financial Performance KPI Dashboard
Download this Sales Performance Dashboard Presentation Diagrams





 Customer Reviews

