


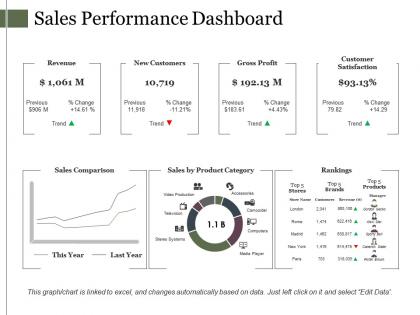
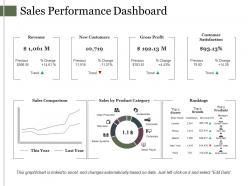
Sales performance dashboard presentation diagrams




Try Before you Buy Download Free Sample Product
 Impress Your
 Audience
 100%
100% Editable
 Save Hours
 of Time


Iron out difficulties with our Sales Performance Dashboard Presentation Diagrams. Get folks interested in advancing forward.
People who downloaded this PowerPoint presentation also viewed the following :
Sales performance dashboard presentation diagrams with all 5 slides:
Get your presentation finished fast with our Sales Performance Dashboard Presentation Diagrams. Compelling designs at your fingertips.
FAQs for Sales performance
Key sales performance metrics include revenue growth, conversion rates, average deal size, sales cycle length, and pipeline velocity. These metrics enable sales teams to identify bottlenecks, optimize resource allocation, and accelerate deal closure, with many organizations finding that comprehensive dashboards ultimately deliver improved forecasting accuracy and enhanced competitive advantage.
Visualization tools enhance understanding of sales data by transforming complex datasets into interactive charts, graphs, and dashboards that reveal patterns, trends, and performance gaps instantly. These tools enable sales teams to identify top performers, track revenue pipelines, and spot seasonal fluctuations quickly, ultimately delivering faster decision-making and improved strategic planning across organizations.
Real-time data enables sales performance dashboards to provide immediate visibility into current sales activities, pipeline status, lead conversion rates, and team performance metrics. This instant access allows sales managers to make quick strategic adjustments, identify emerging opportunities or challenges, and optimize resource allocation, ultimately delivering faster response times and improved sales outcomes.
Sales funnel stages directly influence dashboard design by determining key metrics, visualization hierarchy, and data flow structure, with each stage requiring specific KPIs and monitoring approaches. Early stages like lead generation emphasize volume metrics and conversion tracking, while later stages focus on deal velocity and revenue forecasting, ultimately delivering comprehensive visibility that enables sales teams to optimize performance across the entire customer journey.
Data accuracy techniques include real-time data validation, automated error checking, standardized data entry protocols, regular audits, and integration with CRM systems. These methods streamline reporting by eliminating duplicate entries, flagging inconsistencies, and maintaining clean data sources, with many sales organizations finding that consistent validation protocols ultimately deliver more reliable forecasting and strategic decision-making capabilities.
Sales performance dashboards support strategic decision-making by providing real-time visibility into revenue trends, pipeline health, territory performance, and forecasting accuracy. These comprehensive analytics enable executives to identify growth opportunities, reallocate resources strategically, and adjust market approaches proactively, with many organizations finding that data-driven insights ultimately deliver faster response times and sustained competitive advantage.
**INPUT**: What are the best practices for customizing dashboards for different sales roles? **OUTPUT**: Best practices include role-specific KPI selection, hierarchical data access controls, personalized visualization preferences, mobile optimization, and automated alert configurations tailored to each position's responsibilities. Sales managers require team performance overviews and pipeline forecasting, while individual representatives need lead tracking and quota progress metrics, with many organizations finding that customized dashboards increase adoption rates and ultimately deliver faster decision-making across sales teams. **Word count: 60 words**
Businesses leverage historical data in sales dashboards by identifying trends, forecasting future performance, and benchmarking current results against past achievements. Through predictive analytics and trend visualization, organizations can optimize territory planning, adjust sales strategies, and improve resource allocation, with many companies finding that data-driven insights ultimately enhance decision-making and accelerate revenue growth.
Recommended tools include Tableau, Power BI, Salesforce Analytics, HubSpot, and Google Data Studio, each offering different visualization capabilities and integration options. These platforms streamline dashboard creation by connecting multiple data sources, automating report generation, and providing real-time insights, with many sales organizations finding that cloud-based solutions like Power BI deliver faster deployment and enhanced team collaboration.
User feedback improves sales dashboard effectiveness by identifying missing metrics, highlighting confusing visualizations, and revealing workflow gaps that hinder adoption. Through direct input from sales teams, organizations can streamline navigation, enhance data relevance, and customize reporting features, ultimately delivering more intuitive interfaces and actionable insights that drive performance improvements.
Common pitfalls include overcrowding with irrelevant metrics, lacking real-time data integration, poor visual hierarchy, ignoring mobile optimization, and failing to align with sales team workflows. These design flaws undermine dashboard effectiveness by creating confusion, delayed insights, and low user adoption, with many organizations finding that simplified, role-specific dashboards ultimately deliver better sales outcomes and strategic decision-making.
Sales performance dashboards should be updated in real-time or daily for optimal effectiveness, with weekly updates being the minimum frequency for most organizations. This regular updating enables sales managers to identify trends quickly, address performance gaps immediately, and make data-driven decisions that enhance team productivity, ultimately delivering improved conversion rates and revenue growth.
A sales dashboard impacts team motivation and performance by providing real-time visibility into individual achievements, fostering healthy competition through transparent metrics, and enabling immediate recognition of top performers. These visual tools streamline goal tracking, enhance accountability, and deliver instant feedback on progress, with many sales organizations finding that dashboard transparency ultimately drives higher engagement and measurable performance improvements.
Mobile access to sales dashboards empowers field teams by providing real-time customer data, pipeline updates, and performance metrics directly from client locations, eliminating delays in accessing critical information. This immediate visibility enables sales representatives to adjust strategies during meetings, respond to customer inquiries instantly, and close deals faster, with many organizations finding that mobile-enabled teams achieve significantly higher conversion rates and enhanced customer relationships.
Integrating CRM data into sales performance dashboards delivers comprehensive customer insights, real-time pipeline visibility, automated reporting, enhanced forecasting accuracy, and streamlined team collaboration. This strategic combination enables sales managers to identify bottlenecks faster, optimize resource allocation, and track individual performance metrics seamlessly, ultimately delivering improved conversion rates and more predictable revenue growth.
-
Unique design & color.
-
Awesome presentation, really professional and easy to edit.