


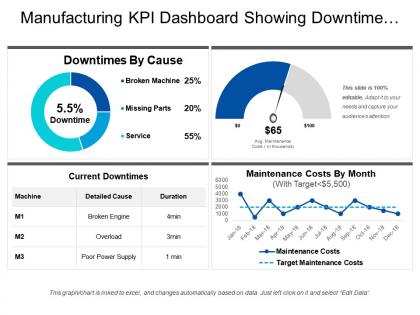
Manufacturing kpi dashboard showing downtime by cause and current downtimes




Try Before you Buy Download Free Sample Product
 Impress Your
 Audience
 100%
100% Editable
 Save Hours
 of Time


Get the group in harmony with our Manufacturing Kpi Dashboard Showing Downtime By Cause And Current Downtimes. They will develop great dynamics.
People who downloaded this PowerPoint presentation also viewed the following :
Manufacturing kpi dashboard showing downtime by cause and current downtimes with all 6 slides:
Allow bonhomie to develop with our Manufacturing Kpi Dashboard Showing Downtime By Cause And Current Downtimes. They dispel any awkward feeling.



FAQs for Manufacturing kpi dashboard showing downtime by cause
Honestly, start with OEE - it's a beast to calculate initially but combines availability, performance, and quality all in one. Super useful once you get the hang of it. Throughput and cycle time are your other must-haves for tracking production efficiency. I'd also throw in first-pass yield and downtime percentage. Oh, and here's something I learned the hard way - compare against your own historical data instead of chasing some random industry benchmark. Those standards rarely match what's actually happening in your specific setup anyway.
First thing - split your downtime into planned vs unplanned categories. Then track why stuff breaks down (equipment failures, changeovers, material shortages, etc). Most places use OEE as their main metric since it rolls availability, performance, and quality into one score. Honestly, spreadsheets are a total pain for this. Real-time monitoring is way better if you can swing it. Get automatic data collection from your machines, then build dashboards showing patterns by shift or equipment. The trick is making it dead simple for operators to log reasons when downtime hits - otherwise your data's garbage and you can't fix anything.
OEE tracks three things: availability, performance, and quality. Multiply them together and you get one number showing how efficiently your equipment runs. Most plants sit around 60%, but world-class is 85%+ (which honestly feels impossible some days). What's cool is it shows you exactly where you're bleeding productivity - maybe your machines are down too much, running slow, or making junk parts. I'd start with your biggest bottleneck equipment first. Once you nail that down, expand to other machines. It's way better than guessing what's wrong.
Track your inventory turnover ratio first, but don't stop there. Days sales outstanding and stockout frequency matter too. Honestly, demand forecast accuracy is probably the most important one - I've seen companies totally mess up their whole strategy when they get this wrong. Your carrying costs per SKU show which products are just sitting there burning cash and warehouse space. Set up alerts for when turnover dips below your targets for different categories. Oh, and start with your slowest movers - either push them out hard or cut back on ordering more.
So defect rate and first-pass yield are your bread and butter - start there. Customer complaints per batch matter too, obviously. Honestly, executives only care when you show them the scrap/rework costs in dollars, not percentages. Track your inspection pass rates and mean time between quality failures. Customer return rates will catch stuff your internal processes miss (which is kinda embarrassing but happens). Oh, and skip the weekly reports - set up a real-time dashboard instead. Way more useful when things go sideways.
Honestly, start by mapping out your workflow first - bottlenecks are never where you'd expect them to be. Focus on one major problem area at a time instead of trying to fix everything at once (learned that the hard way). Parallel processing helps tons when possible. You'll want to standardize your processes and cut down changeover times too. Pull systems beat push systems every time. Just don't mess with your quality checks while you're optimizing - that always backfires. Track cycle times weekly and make small adjustments. Way better than doing some massive overhaul that breaks everything.
Honestly, start with OEE - it's like getting three metrics for the price of one since it covers availability, performance, and quality. After that, definitely track your scrap rates because watching money literally get thrown in the trash is painful (learned that the hard way). Setup times and labor efficiency are massive cost killers too. Material usage and energy per unit matter, but don't go crazy measuring everything at once. Pick 2-3 that match your worst headaches, track them for a month, then add more. You'll actually see patterns instead of drowning in data.
Hook up your MES and ERP systems straight to Tableau or Power BI - the API connections make data flow automatic. Here's the thing though: resist the urge to track everything. I've seen dashboards with like 40 metrics that nobody ever checks. Stick to maybe 6 key ones - OEE, cycle time, defect rates, downtime causes. Set alerts so your team knows immediately when shit hits the fan instead of discovering problems during the next shift meeting. Oh, and don't try to do your whole plant at once. Pick one line, get it working, then roll it out.
Dude, tracking employee productivity metrics is seriously worth it. You'll spot bottlenecks way faster when you're measuring stuff like units per hour or defect rates per worker. I've literally watched factories improve efficiency by 20-30% just from finding their weakest spots first. Lower labor costs, faster deliveries, better quality - it all connects. Though honestly, don't go crazy with too many metrics at once. Pick maybe 2-3 that actually matter for your setup and check them weekly. The improvements add up quick once you start paying attention to the numbers.
Your supply chain basically controls everything in manufacturing - it's wild how connected it all is. Late deliveries or crappy materials? Your production efficiency tanks immediately. Quality rates drop. On-time delivery goes out the window. Bad inventory management from supply chain problems will crush your OEE and jack up costs per unit. But here's the thing - when you've got solid supplier relationships and reliable logistics, your throughput improves and waste drops. I'd start tracking supplier lead times right next to your production numbers. You'll spot the connection fast and see exactly where supply chain mess-ups are screwing with your performance.
Look at what you've done before - that's your starting point. Then aim for something tough but not impossible, maybe 5-15% better than last year. Don't let teams sandbag by picking super easy numbers (I've seen that disaster). Your frontline people need to be part of this conversation since they actually know what's realistic on the floor. Sure, check what similar companies are doing, but don't just copy their homework. The key thing? Review every quarter instead of locking yourself into yearly targets. Manufacturing moves way too fast for that rigid approach, and you'll want room to pivot when things inevitably change.
Dude, predictive maintenance KPIs are seriously worth looking into. Track stuff like vibration patterns, temperature swings, and how many cycles your equipment runs. Way better than those old rigid maintenance schedules or waiting for things to break. I've seen facilities cut unplanned downtime by half with this approach - it's pretty wild actually. Your main KPIs should be MTBF, equipment effectiveness, and maintenance cost per unit. Oh, and equipment life gets extended big time too. Start small though - pick your most critical machines first and get sensors on those. Much easier to scale up from there.
Honestly, customer satisfaction metrics are everything in manufacturing. Like, you could be killing it on the production side, but if customers hate what they're getting? None of your other numbers matter. Track stuff like on-time delivery, defect rates, returns, and feedback scores. These help you catch quality problems before they blow up - which trust me, you want to avoid. Oh, and warranty claims are super telling too. Start with maybe 2-3 metrics that actually connect to your production processes. Don't go crazy with too many at first.
Honestly, don't treat KPIs like some sacred numbers you can never touch. Build in ranges instead of exact targets - way more realistic. Focus on the early warning signs that tell you when stuff's about to change. I've watched so many teams completely freeze up trying to hit precise metrics while their whole market was shifting under them. Rolling averages are your friend here, helps you figure out if it's real change or just normal ups and downs. Oh and do monthly reviews instead of waiting for quarterly ones - you can actually adjust without looking like you don't know what you're doing.
IoT sensors are huge right now - they pull real-time data straight from your machines. AI spots problems before they actually break anything, which saves tons of headaches. Cloud dashboards update instantly instead of waiting for those painful end-of-shift reports. Digital twins let you run what-if scenarios, and some places are even using AR to display KPIs right on the floor (though that's still pretty new). Everything being connected automatically is the real win here. I'd start by looking at whatever manual reporting takes forever - that's usually where you'll see the biggest impact from upgrading.
-
Editable templates with innovative design and color combination.
-
Innovative and attractive designs.