


Manufacturing Company Dashboard With Downtime Causes Consumer Goods Manufacturing




Try Before you Buy Download Free Sample Product
 Impress Your
 Audience
 100%
100% Editable
 Save Hours
 of Time


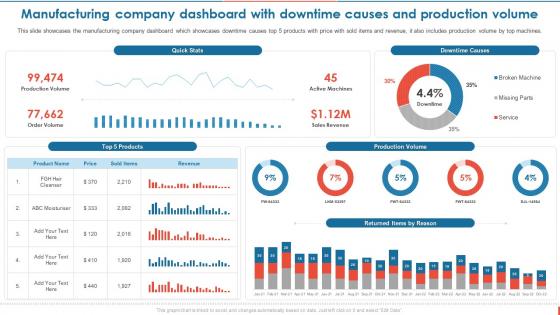
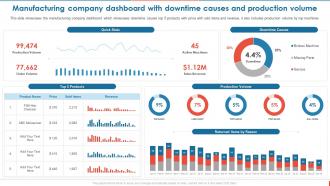
This slide showcases the manufacturing company dashboard which showcases downtime causes top 5 products with price with sold items and revenue, it also includes production volume by top machines.
People who downloaded this PowerPoint presentation also viewed the following :
Manufacturing Company Dashboard With Downtime Causes Consumer Goods Manufacturing with all 7 slides:
Use our Manufacturing Company Dashboard With Downtime Causes Consumer Goods Manufacturing to effectively help you save your valuable time. They are readymade to fit into any presentation structure.





FAQs for Manufacturing Company Dashboard With Downtime Causes
Honestly, start with OEE - that's your golden metric right there. Then track production volume against targets, defect rates, and downtime. Safety incidents should probably be first but somehow always ends up buried in spreadsheets, which is ridiculous. Inventory levels and cycle times matter too. Cost per unit's huge if you care about profit (and who doesn't?). Red/yellow/green dashboards work great - your team can see problems instantly without digging through data. These core ones will cover most situations. Add others later based on what actually breaks in your specific setup.
Dude, you'll love having a manufacturing dashboard - it shows you everything happening on the floor in real time. Machine status, production numbers, quality issues, where things are backing up. No more waiting for those end-of-day reports or doing walkabouts every hour. Honestly, once you get hooked on having all that info right there, you can't go back. Problems pop up? You can shift production around, call maintenance, whatever needs doing before it gets expensive. Oh, and don't try to track everything at once - figure out what's killing you most and start there.
Honestly, good data viz is what separates useful dashboards from total garbage. You'll catch problems way faster with charts and graphs than digging through endless spreadsheets - learned that the hard way! Color-coded alerts are clutch for figuring out what's urgent vs what can wait till tomorrow. Here's the thing though: your visuals need to match how your team actually thinks about the work. Start with the daily decisions you're making and build backwards from there. Otherwise you'll end up with pretty charts that nobody uses.
Connect your production data, sensor readings, and maintenance logs to ML models that spot failure patterns early. Display risk scores and probability timelines on your dashboard - honestly, making those warnings super visible matters way more than people think. Short, punchy alerts work better than buried notifications. Set up automated triggers when confidence levels hit certain thresholds. Your maintenance crew needs to drill down into specific components easily. I'd start with your most critical equipment first, then expand. The prediction algorithms are only half the battle - it's really about catching those red flags before things break.
Honestly, I'd start with Wonderware, Ignition, or Tableau - they're made for manufacturing stuff specifically. Power BI works great too if you're already using Microsoft things and don't want to spend a fortune. I've actually seen people do crazy impressive things with just Excel or Google Data Studio, though obviously those hit walls pretty quick. The main thing is whatever you pick needs to talk to your PLCs and SCADA without requiring a computer science degree to set up. Oh, and your ERP data too. Start by figuring out what systems you're pulling from first.
Dude, get a manufacturing dashboard set up - it's a game changer. Real-time data from your whole production line means you can actually see where stuff's getting stuck. Look for cycle times, throughput rates, queue lengths at each station. Honestly feels like cheating once you have it running. Bottlenecks become super obvious when you see one workstation constantly running slower or inventory backing up. Way better than staring at boring spreadsheets all day. Set alerts when stations drop below target speeds so you catch problems early. Trust me, your future self will thank you.
Put your most critical stuff right at the top - overall equipment effectiveness, production targets, whatever your operators absolutely have to see first thing. Go with a clean grid and honestly, don't cram more than 3-4 key metrics per screen or it'll just look like a mess. Colors should be obvious: green means we're good, yellow needs attention, red means drop everything. Yeah, keep some historical trends visible but don't let them take over the real-time numbers. Oh, and definitely test this with the actual floor workers before you launch - they'll spot problems you'd never even think about.
Honestly, IoT data is a total game-changer for manufacturing dashboards. You get real-time info on machine performance, temps, vibration - all that good stuff. No more waiting around for someone to notice a problem or doing those tedious manual checks. Spotting issues before they turn into expensive downtime? That's where the magic happens. You'll catch operational patterns you never saw before and actually base maintenance on real usage data instead of guesswork. My advice - start with your most critical machines first, then expand from there. Way better than making decisions off yesterday's reports.
So OEE is your best friend here - tracks availability, performance, and quality all in one. Took me forever to wrap my head around it but now I swear by it. You'll also want downtime duration, mean time between failures, and throughput rates on your dashboard. Real-time machine status and cycle times are clutch too. Set alerts when anything drops below 85% OEE. Trust me on this one - catching issues early saves so much headache later. Oh, and defect rates! Almost forgot that but it's huge for spotting quality problems before they spiral.
So you'll want automated validation rules first - catches errors before they mess up your dashboard. Range checks, duplicate detection, basic stuff like that. Regular data audits help too, plus having clear policies about who owns what data sources. Real-time alerts are clutch because stale data will screw you over fast. Honestly, I'd start by just mapping your current data flow first - see where the errors usually sneak in. That's where you'll get the biggest bang for your buck. Most manufacturing teams I know do some combo of these things.
Honestly, data integration is gonna be your worst enemy. Your systems don't talk to each other, so you'll burn weeks just getting decent real-time data. Operators will hate having another screen to babysit - they're already drowning. Scope creep hits hard too because suddenly everyone wants their favorite metrics tracked. Change management? Way harder than you think. I learned this the hard way on my last project. Pick maybe 3-4 key metrics max and find the team members who actually want this thing to work.
Honestly, mobile access is a game changer for staying on top of production stuff when you're not in the office. You can check real-time metrics and jump on alerts right away instead of finding out about problems hours later. Quick decisions from anywhere? Yes please. I'd definitely set up push notifications for the critical stuff - learned that one the hard way when I missed a major alert because I was grabbing coffee. Being able to keep that oversight without being glued to your desk all day makes remote management actually doable.
So real-time data shows you what's happening on the floor right now - catches problems before they blow up. Historical stuff gives you the bigger picture though, like trends and whether today's weirdness is actually normal. Honestly, you can't pick just one. Real-time alerts are great when machines start acting up, but without historical context you're basically flying blind. Is this spike normal for Tuesdays? Who knows without the data. I'd say nail down your real-time monitoring first - that's where you'll see immediate payoff. Then add the historical analysis once you've got that running smooth.
Honestly, just talk to each team first - that's the most important step. Figure out what decisions they're making every day, then build their dashboard around that. Floor managers need real-time production stuff and equipment status. Executives want the big picture trends and cost breakdowns. Plant operators? They live and die by machine health alerts and safety warnings. Most platforms let you set up different user groups with their own permissions and layouts. It's way easier than you'd think. The mistake people make is trying to show everyone everything - total information overload.
Start with role-based access controls - that's where you'll get the most impact. Make sure people can only see data they actually need for their work. Multi-factor authentication is a must, and encrypt everything both when it's moving around and when it's stored. Those dashboard screens are honestly a pain since anyone walking by can peek at them. Data masking helps hide sensitive stuff, plus set up automatic locks when nobody's using them. Don't forget audit logs so you can track who's looking at what. Oh, and keep your dashboard software updated - I know it's boring but security patches matter. Access controls first though, seriously.
-
Fantastic collection of visually appealing PowerPoint templates. They certainly uplift the look of the presentation.
-
Eye-catching PPT designs, outstanding team, and best customer service. I’m a super satisfied customer here!