


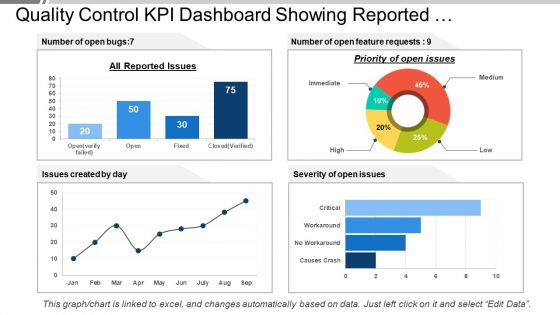
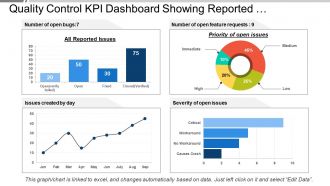
Quality control kpi dashboard showing reported issues and priority




Try Before you Buy Download Free Sample Product
 Impress Your
 Audience
 100%
100% Editable
 Save Hours
 of Time


Bring acrimony to an end with our Quality Control Kpi Dashboard Showing Reported Issues And Priority. Halt the build up of hatred.
People who downloaded this PowerPoint presentation also viewed the following :
Quality control kpi dashboard showing reported issues and priority with all 6 slides:
Folks feel like being agreeable with our Quality Control Kpi Dashboard Showing Reported Issues And Priority. They help differences come down.

FAQs for Quality control kpi dashboard showing reported
Defect rate and first-pass yield are your bread and butter - track those weekly for sure. Customer complaints matter too, obviously. Cost of quality is probably the most eye-opening one though, shows you exactly where money's bleeding on prevention versus fixing mistakes after the fact. Don't sleep on supplier quality metrics either. Oh, and cycle time for corrective actions. I know that sounds like a lot, but honestly? You could start with just defect rate and get pretty far. Weekly tracking beats monthly every time - you'll catch problems before they snowball.
So I'd go with defect density first - basically defects per unit you're making. Then track your escape rate (what actually gets to customers) and first-pass yield. Weekly works if you're cranking out high volume, otherwise monthly is fine. Honestly, daily tracking just creates noise unless you're running massive production lines. Here's the thing - you need at least 6 months of data before you'll see real patterns emerge. Don't just count totals either, break down defect types so you know what's actually going wrong. Pick maybe 2-3 metrics max and stick with them religiously. Review trends monthly with everyone.
Customer satisfaction scores are like your reality check for quality control. They show if all your internal metrics actually mean happy customers. Perfect defect rates? Great cycle times? Doesn't matter if customers aren't satisfied - something's still broken. I've watched teams get totally obsessed with production numbers while missing what customers actually want. These scores validate your quality efforts are working and catch blind spots other KPIs miss. Track them with your operational stuff to see the whole picture. Trust me, you'll be surprised what you learn.
Honestly, KPIs are game-changers for catching waste before it kills your budget. I'd focus on defect rates, rework percentages, and scrap costs by line or shift - that's where the real problems hide. First-pass yield is clutch because it shows how often you nail it on the first try. Real-time dashboards beat waiting for weekly meetings any day. Oh, and don't go crazy tracking everything - pick maybe 3-4 solid metrics to start. You can always add more later once you've got the basics dialed in.
FPY tracks how many products pass quality checks right off the bat - no fixes needed. Think of it as your "nailed it first try" scorecard. Low numbers? You've probably got problems earlier in the process that keep snowballing. The cool thing is you can break it down by product line or manufacturing step to see exactly where stuff goes wrong. Honestly, it's one of those metrics that actually tells you something useful instead of just looking pretty on a dashboard. Focus your fixes on the worst-performing areas and you'll see real improvements in efficiency plus way less money wasted on rework.
Cycle time's actually a pretty solid way to spot quality problems early. Here's the thing - when processes start taking longer than usual, there's usually something going wrong behind the scenes. Could be defects popping up, extra rework happening, or some kind of bottleneck. I'd set up baseline targets for each step first, then watch for any weird spikes. Trust me, those time jumps almost always point to quality issues that need fixing. It's way better than waiting for angry customer calls! When you see times creeping up, that's your cue to dig in and figure out what's actually broken.
Track your customer satisfaction scores and first-call resolution rates - those are huge for service businesses. NPS matters too since it shows if people actually recommend you. Response times and SLA compliance are obvious ones. Your staff basically ARE the product, so watch employee utilization rates closely. Oh, and don't sleep on retention rates and how fast you resolve complaints. Honestly, complaint resolution time tells you everything about your operation. Start there, then add industry-specific stuff once you've got the basics down.
Look at your past 6-12 months first - what were your actual defect rates and customer complaints? That's your real starting point. Industry benchmarks are fine to check, but honestly don't stress if your processes are way different from everyone else's. Go for 5-15% improvement from where you are now. Ambitious but not insane, you know? Your team will quit trying if targets are ridiculous. Oh, and make sure you can actually track this stuff with whatever systems you have. Start with maybe 2-3 metrics instead of going overboard - I've seen people try to measure everything and it becomes a mess.
Set up triggers in your KPI dashboards so when defect rates or complaints spike past your thresholds, it kicks off RCA processes automatically. I've watched teams scramble after problems blow up - such a waste. Make RCA completion time its own KPI and track whether your fixes actually prevent repeat issues. Here's what works: categorize quality problems by root cause type in reports. You'll spot patterns instead of just putting out fires. Oh, and measure how often identified causes stop future problems - that's the real test. Start with your worst 3 quality KPIs and build workflows around those first.
Honestly, just automate the whole data collection thing - it'll save you so much headache. Set up dashboards to track defect rates and customer complaints in real-time instead of waiting around for reports. Analytics tools are pretty solid for spotting trends before they blow up into major issues. What's really nice is configuring alerts when your KPIs go wonky, so your team can jump on problems immediately. Start with figuring out which metrics actually matter (don't track everything just because you can), then grab some IoT sensors or quality management software to handle the monitoring automatically.
So quality KPIs are about to get way smarter - think real-time alerts instead of those monthly reports nobody actually reads until the last minute. AI's gonna start catching problems before they even happen, which is honestly pretty wild. The whole game is shifting from "oops, what broke?" to actually predicting issues ahead of time. Machine learning will pick up on defect patterns that we totally miss, plus everything will connect better with your other business metrics. I'd start figuring out which manual tracking stuff you're doing could just run itself. Saves so much headache later.
KPIs are basically your detective tools for finding where things go wrong and how often. Track them over time to see if your solutions actually work or if you're still stuck. Weekly team reviews work best - everyone digs into the data and throws around ideas. Pick maybe 3-5 that your customers really care about, not just what looks good on paper. Short sentences help too. When you spot patterns, turn them into action plans with real owners and deadlines. It's way better than just collecting data and hoping problems magically disappear.
Okay so basically quantitative KPIs are your hard numbers - defect rates, cycle times, stuff like that. Way easier to track. Qualitative ones are more like customer satisfaction or how the team's feeling about things. Harder to measure but super important too. I've totally seen teams get tunnel vision with just the numbers and completely miss obvious problems. You really can't ignore either type. The quantitative stuff shows you trends and gives you concrete goals, but qualitative helps you figure out what's actually going on behind those numbers. I'd probably stick with 2-3 of each so you're not overwhelmed with data.
Honestly? Monthly if you can manage it, but quarterly works too. Start with every three months and see how that feels. If your industry moves fast or your numbers are all over the place, you'll probably want to check more often. Don't overthink it though - the worst thing is constantly switching things up and driving your team crazy. Oh, and actually put these reviews on your calendar right now. Like, seriously block out the time or it'll never happen. I learned that one the hard way. Just pick a schedule and stick with it.
Make your QC dashboards visual and update them in real-time - nobody cares about last week's data when they're trying to fix today's problems. Customize what each team sees based on what they can actually control. Sales guys don't need the same metrics as your production team, obviously. Generic reports just sit there collecting digital dust. Schedule regular check-ins where people can ask questions about how their daily work connects to quality outcomes. Oh, and this is crucial - tie everything to actions they can take, not just percentages that make everyone feel powerless. Nothing's worse than metrics you can't do anything about.
-
Great quality slides in rapid time.
-
Commendable slides with attractive designs. Extremely pleased with the fact that they are easy to modify. Great work!