

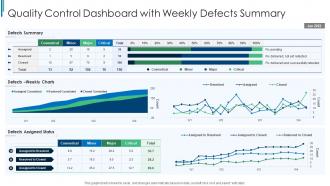
Quality Control Dashboard Snapshot With Weekly Defects Summary





Try Before you Buy Download Free Sample Product
 Impress Your
Audience
 100%
Editable
 Save Hours
of Time


This graph or chart is linked to excel, and changes automatically based on data. Just left click on it and select edit data.
People who downloaded this PowerPoint presentation also viewed the following :
Quality Control Dashboard Snapshot With Weekly Defects Summary with all 7 slides:
Use our Quality Control Dashboard Snapshot With Weekly Defects Summary to effectively help you save your valuable time. They are readymade to fit into any presentation structure.






FAQs for Quality Control Dashboard Snapshot With
Focus on defect rates, first-pass yield, and customer complaints - those three will tell you everything you need to know about quality performance. Cycle time for corrective actions is solid too, plus cost of quality (executives eat that stuff up, honestly). Trend charts beat static numbers every time since you can catch issues early. Track both leading indicators like process compliance and lagging ones like customer returns. Oh, and don't go overboard - start with maybe 4-6 key metrics max. You can always pile on more once your team gets the hang of it.
Honestly, it's a total game changer - you get instant alerts when things start going sideways instead of finding out about defects after they've already shipped. Your whole team can see the same data, so decisions get made on actual facts instead of whoever yells loudest in meetings (you know how that goes). You'll spot patterns across shifts and machines that would totally fly under the radar otherwise. Instead of waiting around for those weekly reports that nobody reads anyway, problems get caught before they turn into expensive nightmares. Start with your top 3-5 metrics and build from there.
Start with control charts - they're killer for catching trends and weird outliers. Pareto charts are solid too, help you figure out which problems to fix first (that whole 80/20 thing). Heat maps show patterns really well across different products or shifts. Honestly, basic bar charts still work great for comparing defect rates between teams. Don't get fancy right away though. People actually use simple dashboards way more than complicated ones. Just think about what quality questions you're always asking, then build charts for those. You can add more later once people are hooked on the basics.
Honestly, you want that data refreshing every 15-30 minutes if possible. Quality problems snowball crazy fast when you're not catching them early. Hourly updates might seem reasonable, but I've watched that backfire when defects slip through the cracks. Your production volume matters here - busier lines need tighter monitoring. Set up automated feeds so you're not manually updating all day. Oh and make sure everyone knows when the last refresh happened, because nobody wants to make decisions off yesterday's numbers. Better to refresh too often than miss something that could've been caught earlier.
Honestly, you need real-time data for quality control or you're screwed. Picture this - without it, you'll find defects after making hundreds of bad units. With live dashboards showing defect rates and machine temps, you catch problems instantly. It's like having a smoke alarm vs. discovering the fire when everything's already toast (yeah, cheesy comparison but whatever). Set up alerts for your key thresholds. Trust me, catching issues while they're happening beats dealing with the aftermath every single time.
So basically you just pick the metrics that actually matter for your industry. Like manufacturing cares about defect rates and downtime, healthcare tracks safety incidents, food places watch temps and contamination - you get it. Most platforms are pretty user-friendly, you can drag stuff around and set your own alert levels. Honestly the visual customization is probably my favorite part. Just figure out your top 3-5 must-have metrics first. Build around those and add more as you go - way easier than trying to do everything at once.
Tableau, Power BI, and QlikSense are the big three everyone talks about. Excel works fine if your data isn't massive, but it gets ugly real quick. Python's solid too - Plotly and Dash are pretty nice if your team's technical. Google Data Studio is free which is cool. I've actually seen people do crazy things with just Google Sheets, though I wouldn't recommend it lol. Really depends on your budget and what you're comfortable with. Oh, and how interactive you want it to be. Start with whatever your team already knows - switching tools mid-project is a nightmare.
Yeah, so most QC dashboards let you pull data through APIs, CSV exports, or straight database connections. The setup's honestly the worst part - I'd use something like Zapier or Power Automate to automate the whole pipeline. Once that's running, you can mix your QC stuff with sales numbers, production data, whatever in Tableau or Power BI. Just make sure your data fields match up between systems or you'll hate yourself later. Oh, and don't try to integrate everything at once. Pick the QC metrics that actually matter for decisions first.
Honestly, data quality will be your biggest pain point. You'll think you have clean data, then spend weeks fixing inconsistent formats and sources. Getting teams to actually adopt the thing is brutal too - everyone's married to their Excel sheets for some reason. Don't go crazy with KPIs either. Stakeholders say they want everything but get overwhelmed fast. My move? Start with just one team as a test run. Sort out your data connections first because that's where projects usually die. Oh, and get the actual users involved early - they'll tell you what actually matters vs what executives think matters.
Okay so honestly? User feedback is what separates dashboards that actually help from ones that just sit there looking fancy. Your daily users know exactly which metrics are useless and which alerts drive them crazy. They'll spot confusing charts faster than you will and suggest workflow shortcuts you'd never think of. I'd start with your power users - ask them what pisses them off most about the current setup. Maybe add a quick rating thing or just check in regularly. The people actually clicking around all day have the best insights, trust me.
Start with access controls - only let authorized people see your sensitive metrics and production data. Role-based permissions work great so teams just see their stuff. Honestly, some of those failure rates could make executives panic if they see them out of context. Mask data when sharing outside your immediate team. Skip the email screenshots - use password-protected links or whatever dashboard platform your company actually approves. I learned this the hard way once. Basically, treat quality data like it's business-critical and double-check who really needs access before you hand it over.
Hook up your historical quality data to some ML models - they'll predict defects and process issues before they hit. Display predictions as alerts or risk scores right next to your current metrics on the dashboard. Temperature and pressure sensors work crazy well for this stuff, honestly. You'll catch problems way before they cost you money. When prediction confidence dips below whatever threshold you set, trigger automated alerts. Oh, and make sure your team can dig into the raw data behind those predictions. Just pick one critical process to start with though - easier to prove it actually works that way.
Dude, mobile access is a total game-changer for dashboards. Quality problems don't wait around for anyone to get back to their computer, right? Your team can spot issues, approve fixes, and flag problems straight from their phones. Response times drop like crazy - I've seen 60% improvements when people can actually use the thing on mobile. Floor managers love being able to update stuff in real-time instead of waiting hours to log in somewhere. Just make sure it actually works on phones though. Nobody wants to squint at tiny charts or try hitting microscopic buttons.
So basically these dashboards show you in real-time if you're meeting all your compliance stuff. Pretty handy actually. You can set alerts when numbers go wonky, track everything for audits, and spit out reports super quick. Way better than dealing with endless spreadsheets - trust me on that one. Auditors love it because they can see you've been consistent over time. Oh and all your quality data sits in one spot which is nice. I'd probably start by figuring out what metrics actually matter for your industry first, then build from there.
Dashboards make improvement feel ongoing rather than something you tackle once quarterly. Your team sees real-time data and naturally starts asking "why did that number spike?" Instead of buried reports, you get daily conversations about actual trends. Short meetings around the dashboard work way better than I expected - people start catching problems early and suggesting fixes on their own. The trick is getting everyone to actually use the thing. I've seen gorgeous dashboards that just collect digital dust. But when teams check them regularly? They'll spot issues before they blow up into real headaches.
-
Really like the color and design of the presentation.
-
These stunning templates can help you create a presentation like a pro.