In the tech-savvy business landscape of today, data-driven decisions have assumed primacy. To do this well, quality dashboards have emerged as invaluable tools. These visual instruments provide a holistic view of key performance metrics, facilitating informed choices and strategic planning.
Quality dashboards serve as a compass, guiding organizations on what data to use, and when. These dashboards offer insights into crucial facets such as total defect quantity, account data quality, supplier rating, data quality maturity, daily abandonment rate, and defect severity distribution. With these critical metrics at hand, you gain a competitive edge in terms of monitoring progress, and making data-backed improvements.
Imagine the power of captivating your audience with visually stunning presentations that convey intricate data and engage and persuade them.
This is precisely where SlideTeam’s Quality Dashboard PowerPoint Templates come into play. Experts have created these slides to captivate your audience while delivering the most intricate data. Whether you're addressing stakeholders, clients, or internal teams, these templates will enable you to present data visually and impactfully.
Unearth a captivating blog featuring the Top 10 Quality Management Plan Templates with Samples and Examples by clicking here.
Join us as we explore the world of quality dashboards, where data meets aesthetics, and empower yourself with the top-notch Quality Dashboard PowerPoint Templates. The slides are laid out neatly and professionally. These themes actively engage users to create remarkable presentations with appealing, content-ready layouts, enticing images, and excellent typography.
Each of the templates is 100% editable and customizable as well. Let's take a look at our PPT Templates.
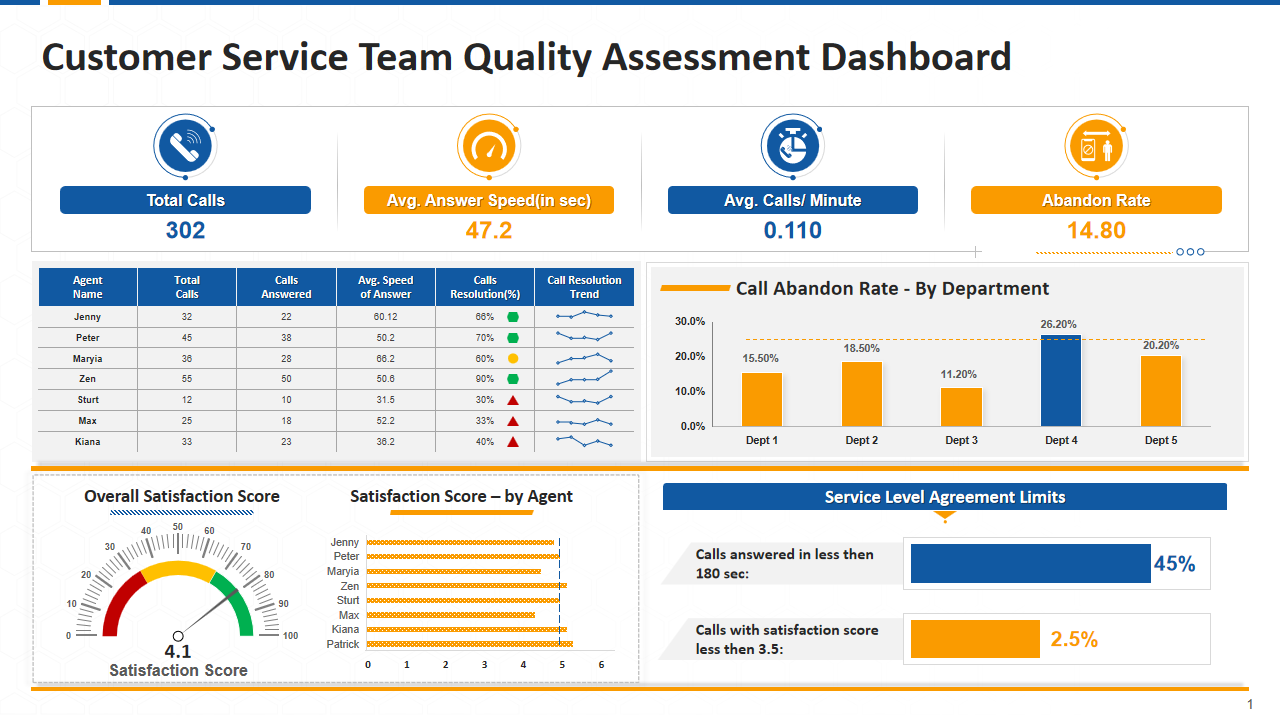
Template 1: Customer Service Team Quality Assessment Dashboard Template
This PPT Layout showcases a dashboard to track and monitor the effectiveness of the customer service team. Use this slide to highlight crucial key performance indicators (KPIs), such as first-call resolution rate, unresolved call rate, average response time by team, Net Promoter Score (NPS), etc. This PPT Theme helps you analyze trends and patterns in customer service data to identify areas for improvement and implement strategies for better-quality service. It helps you impress clients, partners, and stakeholders with professional and informative reports on customer service performance.
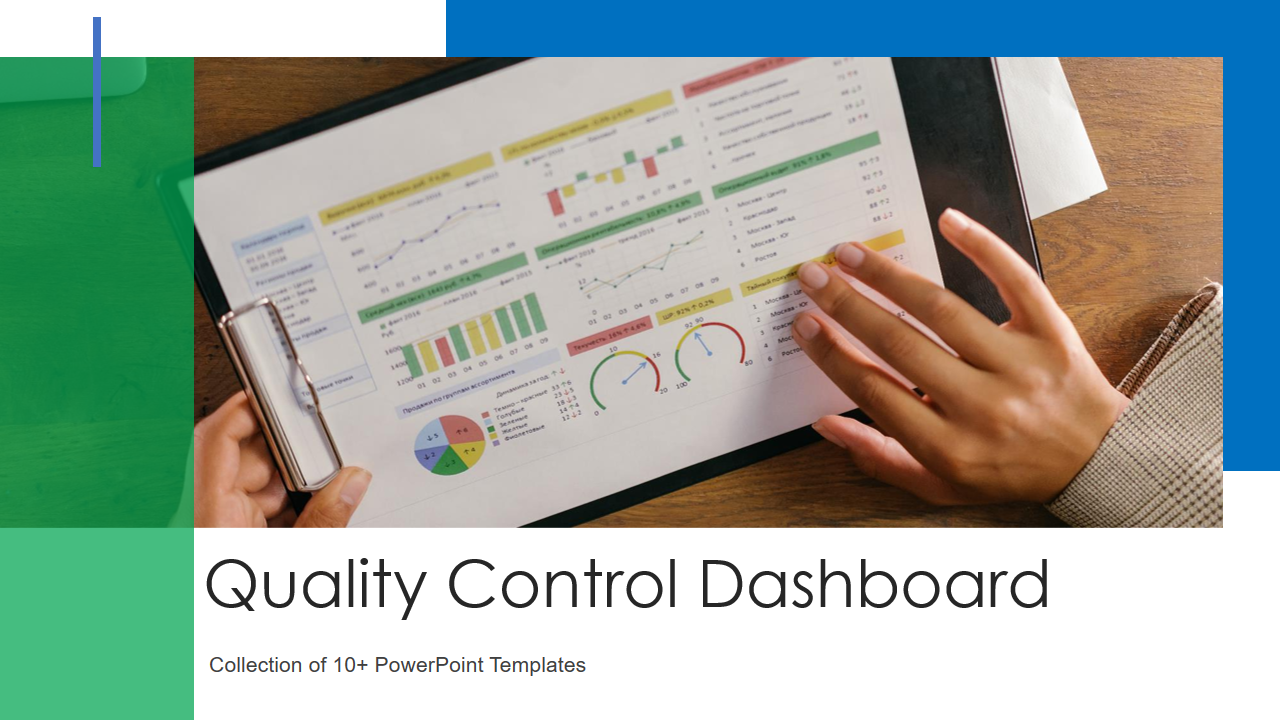
Template 2: Quality Control Dashboard Template
This PPT Template is quality control dashboard that depicts weekly defect summary. It presents a comprehensive summary of weekly defects, categorized into minor, central, cosmetic and critical. It also showcases the project quality control dashboard with success rate by visually representing the data through graphs and charts. This PPT Preset equips decision-makers with the information to make informed choices regarding quality control strategies and resource allocation. It ensures that quality control efforts align with project objectives and organizational goals.
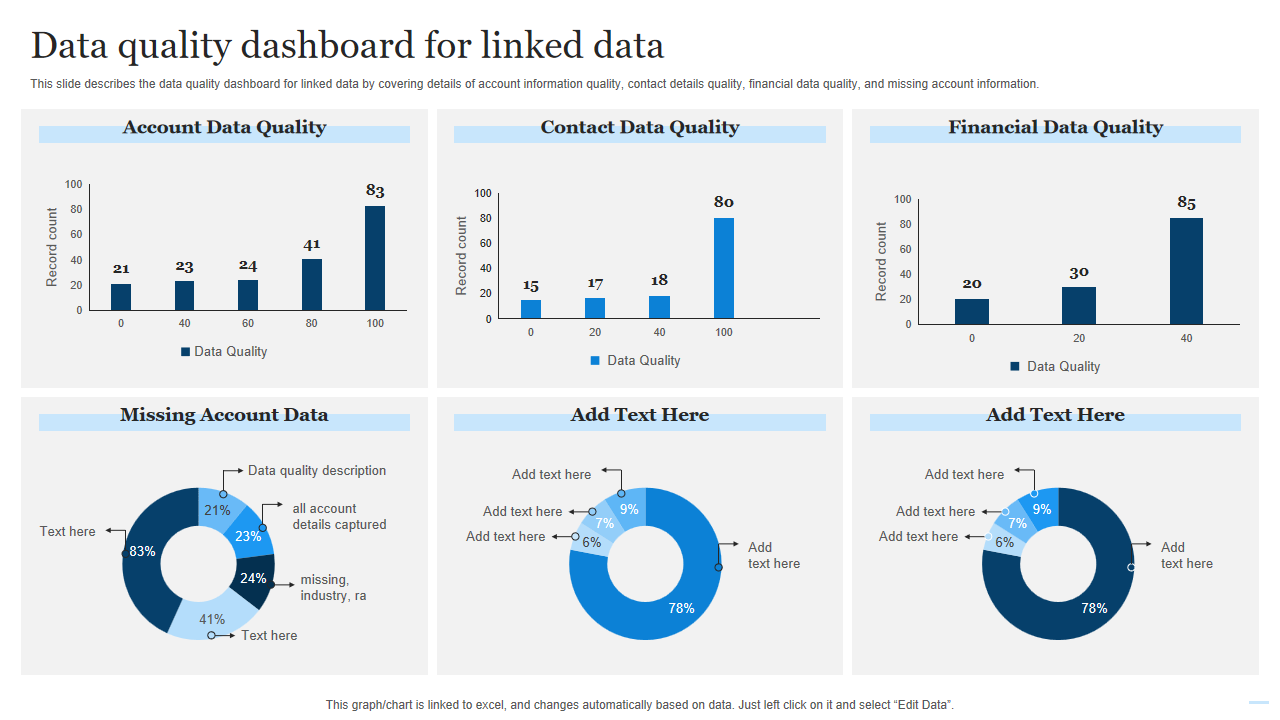
Template 3: Data Quality Dashboard for Linked Data Template
Use this PPT Slide to demonstrate data quality dashboard for linked data by covering details of account data quality, contact data quality, financial data quality, and missing account data. This PPT Theme helps you highlight missing account data to identify gaps in your dataset and guide efforts to complete and enrich data sources. It allows stakeholders to grasp overall data quality situation. Furthermore, it effectively communicates data quality issues and improvements to internal and external stakeholders, fostering transparency.
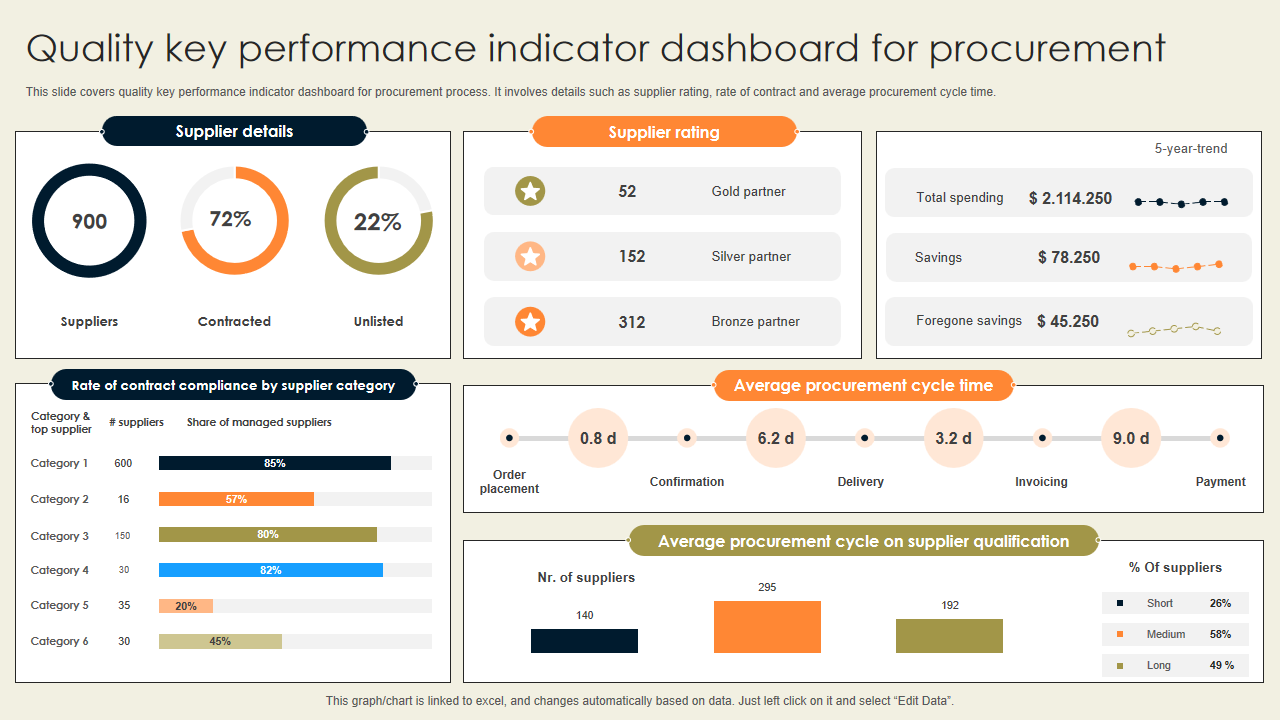
Template 4: Quality Key Performance Indicator Dashboard for Procurement Template
This PPT Layout showcases details such as supplier rating, rate of contract, and average procurement cycle time. This PPT Theme helps you track and monitor the performance of your procurement process over time. It equips procurement managers and decision-makers with the necessary data to make informed choices about procurement strategies, supplier selection, and contract management. The aim is to also communicate procurement performance to internal and external stakeholders, such as executives, suppliers, and team members.
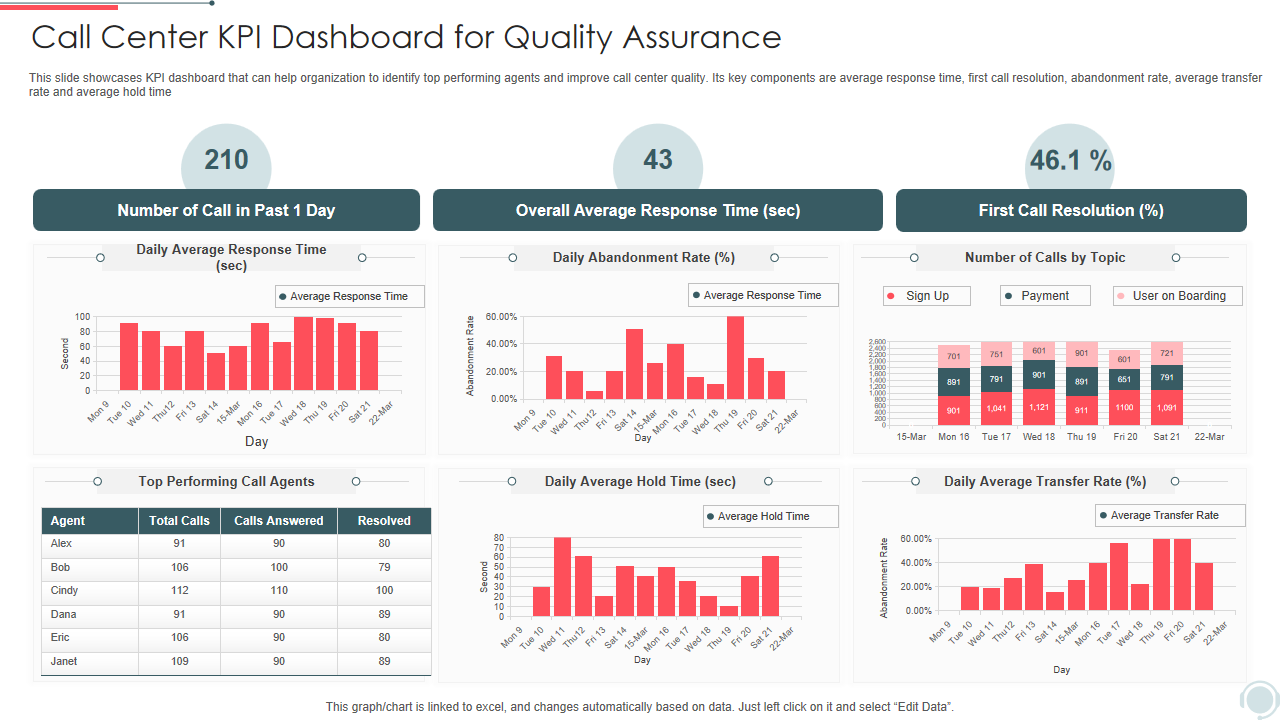
Template 5: Call Center KPI Dashboard for Quality Assurance Template
Use this PPT Preset to demonstrate a KPI dashboard that helps organizations identify top-performing agents and improve call center quality. Its key components are average response time, first call resolution, abandonment rate, average transfer rate, and average hold time. This PPT Theme helps you pinpoint areas where call center quality can be enhanced, improving customer satisfaction and service efficiency. Also, it equips call center managers and decision-makers with actionable data to make informed choices about resource allocation, training, and process optimization.
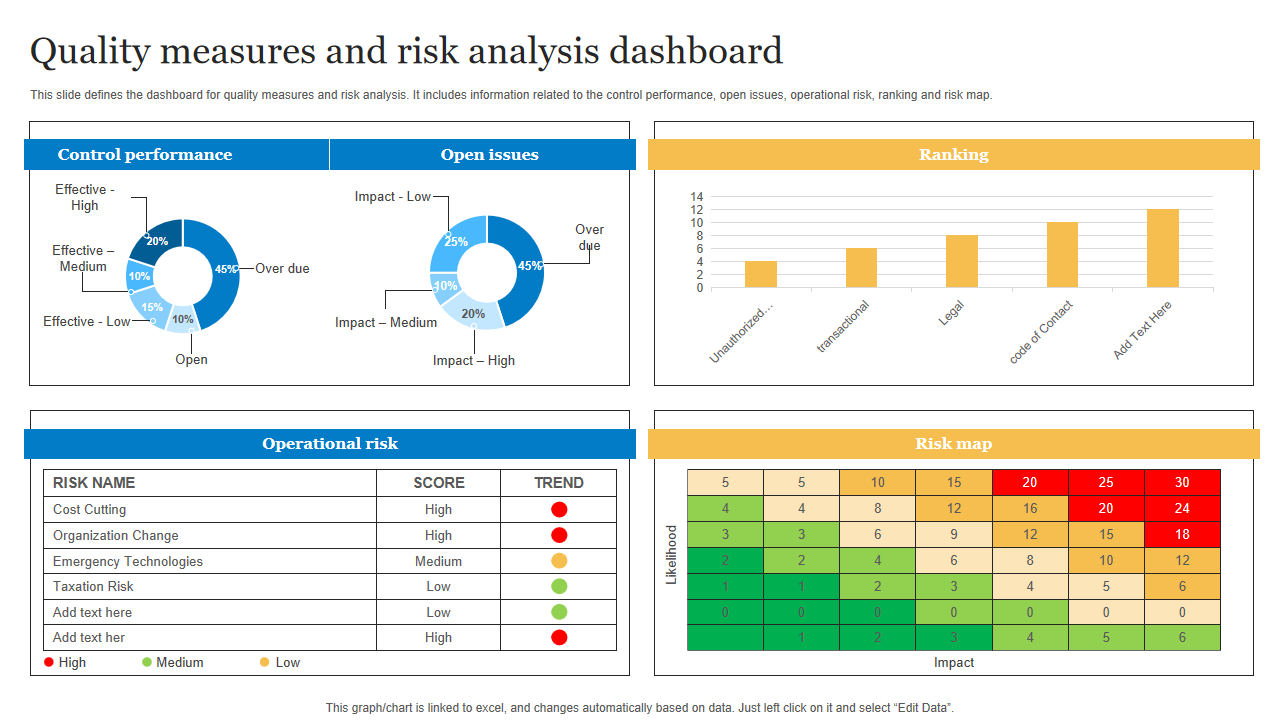
Template 6: Quality Measures and Risk Analysis Dashboard Template
This PPT Theme includes information on control performance, open issues, operational risk, ranking, and a risk map. This PPT Layout equips risk managers and decision-makers with the necessary data to make informed choices about risk mitigation strategies, control enhancements, and resource allocation. It monitors the performance of control measures and risk mitigation efforts over time, facilitating continuous improvement and risk reduction.
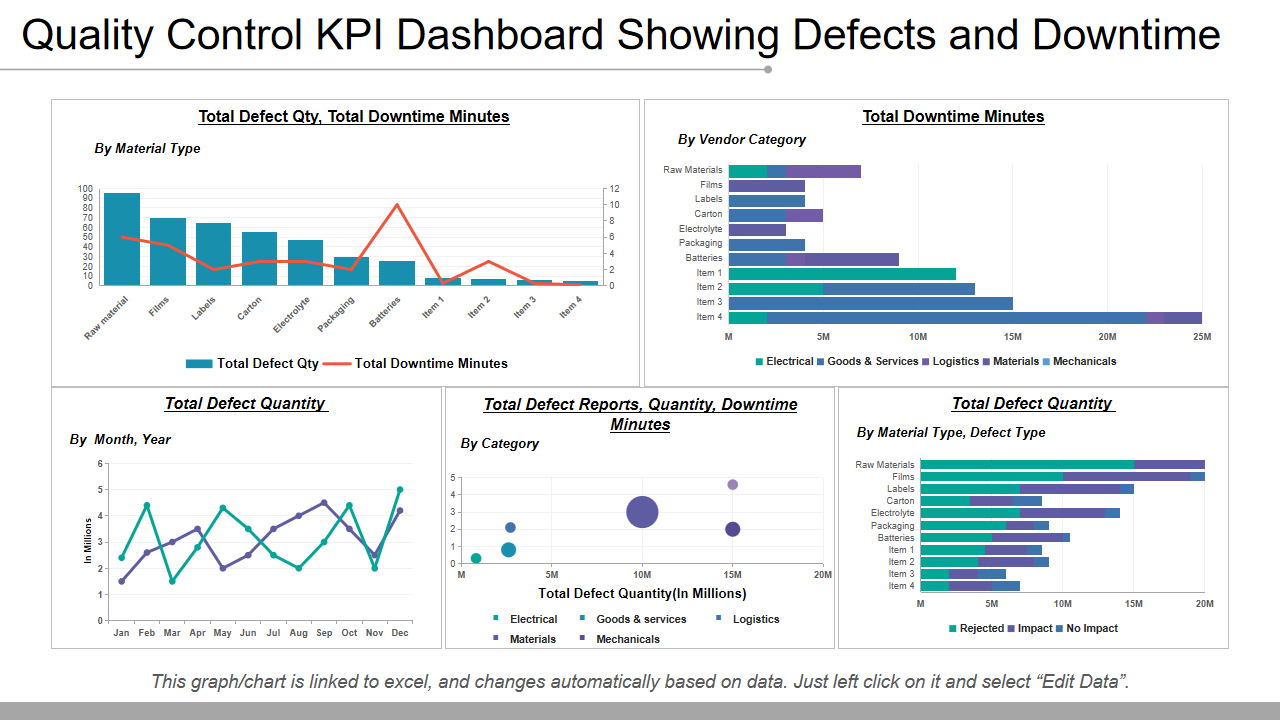
Template 7: Quality Control KPI Dashboard Showing Defects and Downtime Template
Use this quality control KPI dashboard to depict defects and downtime. It includes key elements like total defect quantity, total download minutes, total downtime minutes, etc. This PPT Layout helps you identify areas where quality control processes can be optimized to reduce defects and minimize downtime, improving product quality and operational efficiency. It leverages insights from the dashboard to inform strategic planning efforts and ensure that quality control aligns with organizational objectives and goals.
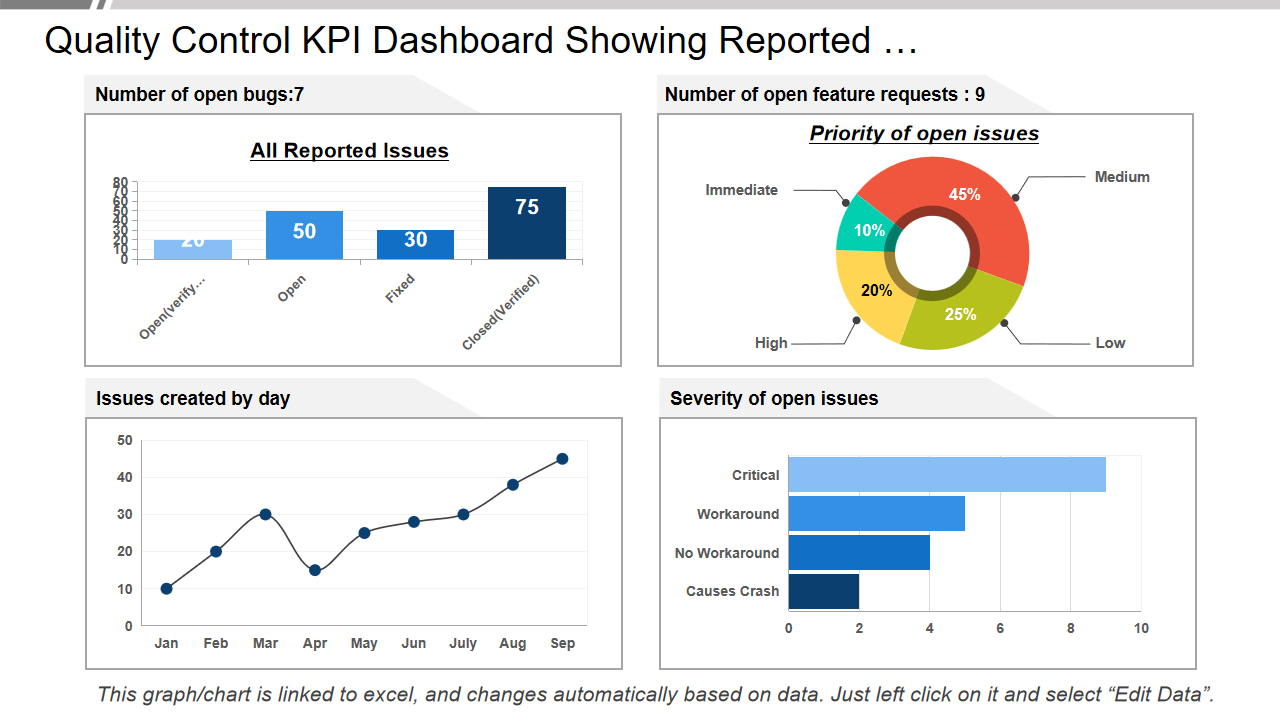
Template 8: Quality Control KPI Dashboard Showing Reported Template
This quality control KPI dashboard showcases all reported issues, the priority of open issues, issues created by day, and the severity of open issues. This PPT Theme helps you communicate quality control performance and issue management to internal teams, management, and external stakeholders, fostering transparency and accountability. You can use the dashboard to track KPI trends and support efforts to enhance quality control measures, address issues, and maintain product or service excellence.
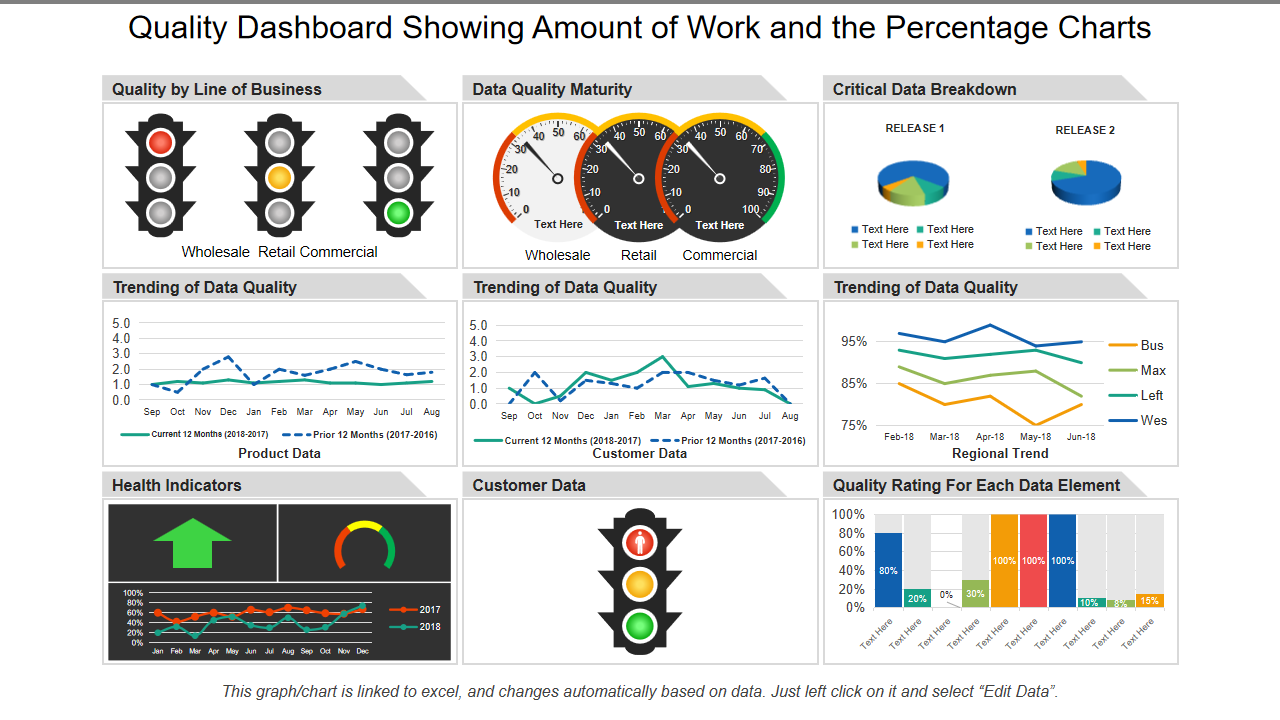
Template 9: Quality Dashboard Showing Amount of Work and the Percentage Charts Template
This PPT Theme showcases a quality dashboard to present the amount of work and the percentage charts. It includes quality by line of business, data quality maturity, critical data breakdown, trending data quality, etc. This PPT Layout helps you analyze data quality trends over time, identifying areas where quality improves and where corrective actions are needed. Additionally, it provides stakeholders with data-driven insights to decide on strategies for resource allocation, process optimization, and quality improvement.
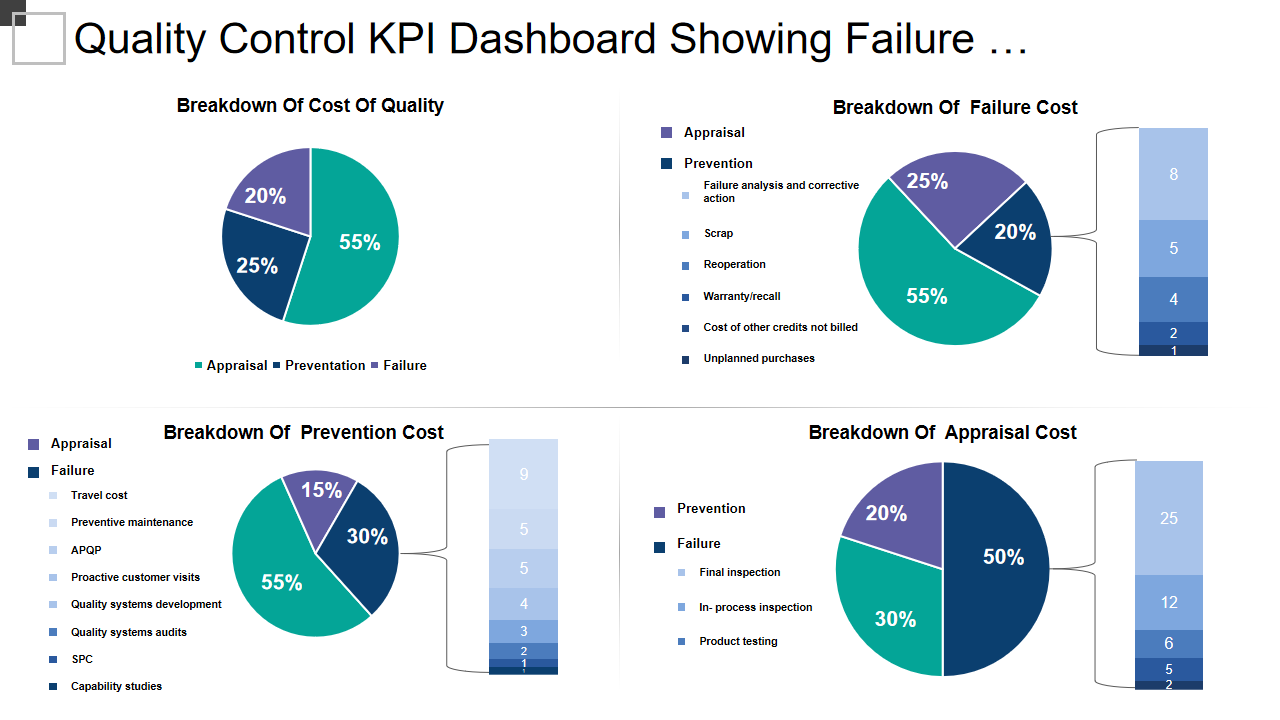
Template 10: Quality Control KPI Dashboard Showing Failure Template
With this PPT Preset, you can demonstrate a quality control KPI dashboard showing failures that come to impact business. It includes key elements like a breakdown of the cost of quality, a breakdown of failure cost, a breakdown of prevention cost, and a breakdown of appraisal cost. This PPT Theme helps you leverage insights from the dashboard to inform strategic planning efforts and ensure that quality control aligns with organizational objectives and financial goals. Use this template to also communicate quality control performance and cost implications to internal teams, management, and external stakeholders, fostering transparency and accountability.
Uncover the possibilities with these quality dashboard templates today!
The quality dashboard presented, here, are powerful tools that revolutionize how businesses monitor and improve their performance. These templates blend aesthetics and functionality, making complex data understandable and actionable. You have a head start in designing your customized quality dashboards. Whether tracking defects, evaluating customer service, managing risks, or assessing data quality, these templates provide the framework to streamline your processes and drive informed decision-making. Embrace the potential of these templates to elevate your data presentations and enhance your organization’s overall quality and performance.
Subscribe now and access these premium PPT Slides with our flexible monthly, semi-annual, or annual plans.
Access a resourceful blog post on the Top 10 Quality KPI Examples with Templates and Samples. Click here to uncover valuable insights.
PS Start your exploration of the Must-have Quality Assurance KPIs Metrics with Samples and Examples with a single click here.
FAQs on Quality Dashboards
What are the four elements of the dashboard?
The four essential elements of a dashboard are data visualization, key performance indicators (KPIs), interactivity, and organization/layout. These elements combine to provide a comprehensive and user-friendly data presentation. The idea is to cover all relevant decision-making variables with their relevant industry standards as well. Only then, would the numbers on the dashboard lead to a good, quality decision.
What is a quality dashboard?
A quality dashboard is a visual tool that provides an at-a-glance overview of key quality metrics and performance indicators, helping organizations monitor and improve their quality-related processes. The idea is to ensure that quality benchmarks, as defined through the years, are know and applied to the current business process at hand. Quality must never be compromised is a key learning we get from dashboards. Once a particular quality standard is there, all businesses must meet it. It may be % of defects in a product; the recall of cars etc.





 Customer Reviews

