

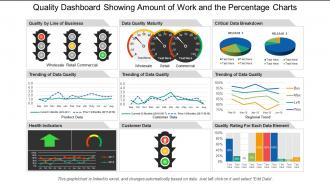
Quality dashboard snapshot showing customer product data with data quality





Try Before you Buy Download Free Sample Product
 Impress Your
Audience
 100%
Editable
 Save Hours
of Time


We present to you our professionally designed multi-featured quality dashboard showing customer data with data quality. As this quality KPI PowerPoint presentation is Excel linked it is very user-friendly so all you have to do is edit the Excel sheets and the graphs will changes automatically. This dashboard matrix slideshow model uses images of traffic light indicators, speedometers, 3D pie charts, line bar graphs, other bar graphs, etc. You can discuss business related processes like trending of data quality of product data, consumer data, regional trend, etc., quality of line of business, data quality maturity, critical data breakdown, health indicators, consumer data, quality rating for each data element, etc. This performance management PPT slideshow will help you have a better judgment about the implementation of various processes in a business. It is assured that you will not regret your decision of downloading and using this product quality assurance PowerPoint presentation. Our Quality Dashboard Showing Customer Product Data With Data Quality facilitate diversification. Get easy access to different avenues.
People who downloaded this PowerPoint presentation also viewed the following :
Quality dashboard snapshot showing customer product data with data quality with all 6 slides:
Install the jig with our Quality Dashboard Showing Customer Product Data With Data Quality. Guide folks on erecting the apparatus.


FAQs for Quality dashboard snapshot showing customer product data
Honestly, just track the stuff that actually matters when things go wrong. Defect rates and customer satisfaction scores are your bread and butter - plus first-pass yield for the bigger picture. Cycle times and rework costs will show you exactly where everything's falling apart. I'm a big fan of looking at trends too since one-off data points can totally mislead you. Compliance rates matter if you're in that kind of industry. Keep it stupidly simple though - like 6-8 metrics tops. Your stakeholders need to spot problems fast, not wade through a spreadsheet nightmare.
Honestly, dashboards are game-changers for quality stuff. Instead of waiting around for those monthly reports (ugh), you get real-time data on defects, complaints, process performance - all the important bits right there. Makes spotting problems way easier than digging through endless email threads trying to figure out what went sideways. The visual layout helps you quickly see what's urgent and what can wait. Oh, and definitely set up alerts for the critical stuff so your team can catch issues before they blow up into bigger headaches.
Start with visual hierarchy - put your critical quality metrics where people will actually see them first. I'd go with the classic red/yellow/green color system since everyone gets it immediately. Don't make my mistake of cramming everything onto one screen like some kind of mission control setup lol. Simple charts work way better than fancy ones, and speed matters more than you think. Test it with the people who'll actually use it daily - they catch stuff you'd never notice. Their feedback is gold, so get it early and keep tweaking based on what they tell you.
Honestly, data visualization is a total game-changer for quality dashboards. You'll spot trends and problems instantly instead of scrolling through endless spreadsheets like some kind of masochist. Charts and graphs make it super obvious when quality dips happen - you can catch issues in real-time rather than finding out weeks later. Your team won't have to hunt through rows of numbers anymore. Plus stakeholders actually pay attention when you show them visual data instead of boring tables. The key is picking chart types that make sense for whatever quality metrics you're tracking. Way easier to see patterns that way.
Honestly, automation is what makes dashboards actually useful instead of just pretty charts you forget about. It grabs data from all your sources, crunches the numbers, and updates everything automatically - either live or on whatever schedule you set. Trust me, nobody wants to be the person updating spreadsheets at 8am every day. Plus it'll catch weird data issues and ping you when something's off. The key is setting up those data pipelines right from the beginning. Do that, and your dashboard basically runs itself while keeping everyone in the loop. Way better than manual updates!
Start with your data sources - that's where everything goes wrong if you're not careful. Set up automated checks to catch weird outliers before they mess up your dashboard. Trust me, bad data made our team look like idiots during a quarterly review once! Someone needs to own each metric too, otherwise it's just chaos. Monthly audits are your friend for spot-checking against source systems. Oh and document what each metric actually means - you'd be surprised how differently people interpret the same numbers. It'll save you so many headaches later.
Don't cram everything onto one screen - users will just get overwhelmed. Vanity metrics are the worst too, like they look cool but nobody actually uses them for decisions. Your data better be fresh and reliable because stale numbers make you look incompetent. Also, your CEO doesn't need the same view as your quality team, which seems obvious but people mess this up constantly. I'd honestly start with maybe 3-5 metrics that actually connect to what you're trying to achieve. You can always add more later once people get comfortable with the basics.
So first thing - figure out your 3-5 most critical metrics, then build around those. Most dashboards let you drag widgets around and filter by dates, departments, whatever you need. You can set up alerts for stuff that actually matters to you (seriously, don't go overboard here or you'll get alert fatigue). The cool thing is you can save different views - like one for your daily stuff and another when the executives want their fancy reports. Some platforms even let you create custom calculated fields if you need weird performance indicators. Oh, and filtering by specific projects is super useful too.
So manufacturing dashboards track stuff you can actually see - defect rates, how much you produced, when machines break down. Service dashboards are more about customer happiness scores and how fast you respond to issues. Manufacturing's honestly easier since you can just count broken products. Service quality though? Super subjective - what pisses off one customer might not bother another at all. You'll need way more surveys and feedback analysis for services, but manufacturing can just use sensors and automated inspection data. First figure out what "quality failure" actually means for your situation, then build your metrics from there.
Honestly, integration is a game changer - it turns your quality dashboard from just another tool into something that actually pulls its weight. Connect it to your ERP, CRM, whatever manufacturing systems you've got running. Real-time data starts flowing automatically (way better than doing manual uploads, trust me on that). Your metrics update instantly. You'll spot trends faster and can actually see how quality issues tie back to production schedules or customer complaints. Having everything in one view makes such a difference. I'd map out your current systems first, then tackle the integrations that'll solve your biggest data headaches.
Honestly, I'd go with rating scales first - they're dead simple but give you real data you can actually use. Comment boxes work great too, plus those quick thumbs up/down buttons. Pop-up surveys after users finish something important are clutch. You could also try feedback forms for specific features or suggestion boxes. Oh, and Hotjar's pretty solid for heatmaps if you want to get fancy with it later. Main thing is don't make people jump through hoops to leave feedback. Keep it stupid easy so it doesn't mess with their flow. Start small with like two options, see what people actually use, then build from there.
Honestly, adding historical data to your quality dashboard is a game changer. Instead of just seeing today's numbers, you'll catch patterns that span weeks or months. That weird spike from last Tuesday? Suddenly it makes sense when you see the bigger picture. You can spot quality issues before they blow up, compare how you're doing now vs. last quarter, and even predict where problems might hit next. I'd say grab at least 30 days of historical context for your main metrics. The stories that data tells will surprise you—like, actually surprise you.
Honestly, the worst part is everyone thinks their metrics are THE most important ones. Sales wants revenue numbers, marketing obsesses over leads, operations cares about efficiency - you get it. Then there's the whole data mess where nothing connects properly because each team picked their own systems years ago. Some departments get weird about sharing info too, which I kinda get but still makes things harder. Oh and the technical headaches? Brutal. You're trying to sync stuff that updates at completely different times in totally different formats. Start small though - find like one or two teams that actually want this to work, show them results, then slowly bring others in.
Dude, you really need this. Real-time dashboards let you catch problems while they're still small - none of that waiting around for month-old reports nonsense. I can't tell you how much easier it makes spotting exactly where things go sideways in your processes. Plus stakeholders actually pay attention when you show them visual data instead of boring spreadsheets. My advice? Don't overcomplicate it at first. Pick your top 3-5 metrics and start there. Once you see how much clearer everything becomes, you'll wonder why you waited so long.
Honestly, I just stack a bunch of different tools on top of my main dashboard. SQL is my go-to for digging into weird numbers - probably waste too much time there but whatever. Tableau's solid for slicing data when things look wonky. Python or R are clutch for catching patterns you'd totally miss otherwise. When I need to actually solve problems systematically, those fishbone diagram things work pretty well. The dashboard shows you *what's* happening, then you jump into these other tools to figure out *why*. Works every time.
-
Best Representation of topics, really appreciable.
-
Very unique and reliable designs.