

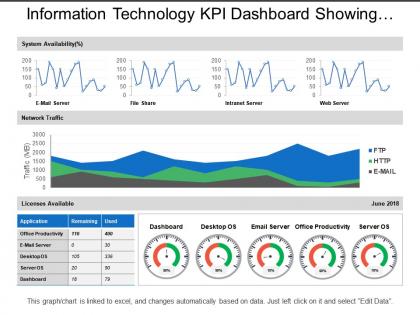
Information technology kpi dashboard showing network traffic system availability




Try Before you Buy Download Free Sample Product
 Impress Your
 Audience
 100%
100% Editable
 Save Hours
 of Time


Highlight your crucial technological aspects with our information technology KPI dashboard showing network traffic system availability PPT template. This KPI dashboard PowerPoint slideshow which is also excel linked has been designed by our creative designing team to help business managers and researchers to track their progress and determine how well the business is performing. The technology KPI dashboard Presentation design is one of the most important business tools that provides a snapshot of your important numbers needed to conduct effective business analysis. This KPI dashboard PPT slide has been designed with various types of dashboard such as line charts, speedometers, tables, etc. and can be used for your business and marketing related presentations. You can track KPIs, metrics, and other key data points relevant to a business, department, or specific process. Using data visualizations, dashboards simplify complex data sets to provide users awareness of current performance. Download this slide now. Our Information Technology Kpi Dashboard Showing Network Traffic System Availability don't allow irritation to build up. It avoids annoying interruptions.
People who downloaded this PowerPoint presentation also viewed the following :
Information technology kpi dashboard showing network traffic system availability with all 6 slides:
Drive the debate with our Information Technology Kpi Dashboard Showing Network Traffic System Availability. Fix the attention of your audience on the issue.
-
Information Technology KPI Dashboard Showing
-

Information Technology KPI Dashboard Showing Network Traffic System Availability
-

Information Technology KPI Dashboard Showing Network Traffic System Availability
-
Edit Excel linked Chart
-
Edit Color
-

Information Technology KPI Dashboard Showing Network Traffic System Availability
FAQs for Information technology kpi dashboard showing network
So you'll want to watch throughput, latency, packet loss, and bandwidth utilization mainly. Latency's honestly the most crucial - users get annoyed by slow responses way before they care about your technical stats. Error rates matter too, plus jitter if you're dealing with video calls or whatever. First thing is establishing baselines during normal times so you can actually tell when something's off. I'd focus on whatever directly hits user experience rather than getting lost in the weeds with every possible metric. Short bursts work better than trying to monitor everything at once.
Dude, packet loss is brutal for your network. Every dropped packet needs to get sent again, which wastes the bandwidth you're already paying for. Just 1-2% loss can tank your speed by 10-20% because TCP freaks out and slows everything down when it can't find packets. Your apps start timing out and everyone gets pissed off - honestly, user complaints are sometimes worse than the actual performance hit. You want to keep loss under 0.1% if possible. Anything over 1% and you've got real problems to dig into.
So for monitoring network traffic, PRTG and SolarWinds are solid choices - they'll handle your bandwidth, latency, packet loss stuff. Nagios is good too but honestly the interface feels a bit dated. Wireshark's amazing if you want to get into the weeds with packet analysis, though it might be overkill depending on what you need. Oh, and if you're running cloud stuff, just use whatever your provider offers - CloudWatch for AWS, Azure Monitor for Microsoft. I'd probably start with PRTG's free trial since it's pretty user-friendly. Really depends on how complex your setup is though.
Dude, latency is basically the delay between clicking and seeing stuff happen. Once it hits 200-300ms, people just bail - I've watched it happen so many times. Your web pages start feeling broken even when they're not technically broken, you know? Video calls get all choppy and real-time apps become a nightmare. For network checks, measure round-trip time first. Anything over 100ms? Red flag. Set up monitoring to track patterns throughout the day - way easier to catch problems before users start losing their minds about it.
So throughput is just how much data actually gets through your network right now. Different from bandwidth, which is more like the theoretical max your system can handle - kind of like posted speed limits vs actual traffic flow, you know? I always tell people to watch when throughput starts hitting around 70-80% of your bandwidth consistently. That's when you should probably start thinking about upgrades. It's really the best way to catch bottlenecks before they become a real problem. Honestly, it's like taking your network's temperature - shows you what's really going on under the hood.
KPIs are basically your troubleshooting cheat sheet when the network starts acting up. Check packet loss and latency first - they'll usually tell you exactly where things are breaking. Bandwidth utilization matters too, especially since slow performance complaints make up most of your tickets anyway. Don't forget error rates on interfaces and jitter for anything real-time. Here's the thing though - you need baselines or you're flying blind. Set up alerts so these metrics trigger warnings before users start freaking out. Oh, and automated monitoring saves your sanity because nobody wants to manually check this stuff all day.
For most stuff, keep latency under 100ms and packet loss below 0.1%. Network utilization should stay under 70% during busy times - gives you room when things get crazy. Jitter's where people really notice problems, especially with calls or video. Keep it under 30ms or your users will definitely complain. Honestly, the 70% rule works pretty well for bandwidth too, though it depends on what you're running. Here's the thing though - you gotta monitor for like a month first to see what normal looks like. Then set your alerts at 80% of whatever thresholds you pick.
So congestion metrics show you where your network's getting jammed up. Track stuff like utilization rates, packet loss, and latency spikes - it's like detective work but for bandwidth. I'd start monitoring your main links and set alerts around 70-80% capacity. That way you can spot trouble before users start freaking out about slow connections. You'll know whether to add more bandwidth, mess with QoS settings, or just reroute traffic during busy times. Honestly, good monitoring dashboards are worth their weight in gold for catching trends early.
You definitely need both, but they do totally different things. Real-time monitoring is like your smoke detector - it screams when bandwidth spikes or everything starts lagging out. Historical data is more like your doctor checkup, showing patterns over weeks and months. I'd set up alerts for the critical stuff that needs immediate attention. But honestly? The historical trends are what saved my butt last year when I could see we'd hit capacity issues by Q3. Short bursts versus the bigger picture, you know? Weekly trend reviews are clutch for staying ahead of problems.
So basically, KPIs are like your network's smoke detectors - they catch weird patterns before things go sideways. You'll want to watch for stuff like random bandwidth spikes, sketchy connection patterns, or massive data dumps that shouldn't be happening. DDoS attacks are super obvious once you know what to look for since they create these crazy traffic surges. Same with data theft - it shows up as weird outbound flows. Oh, and definitely set up alerts so you're not glued to dashboards all day (learned that one the hard way). Geographic anomalies are usually dead giveaways too.
Yeah, ISP problems will totally screw up your network KPIs - especially the end-to-end stuff like latency and packet loss. Your ISP hits congestion or routing issues? Boom, your internal network suddenly looks terrible even though it's fine. I've seen this drive people nuts during troubleshooting. What you gotta do is monitor right at your internet gateway, not just the endpoints. That way you can actually tell if it's your gear or theirs causing the headache. Trust me, separating internal vs external performance saves so much time.
Traffic KPI trends are honestly your best friend for this. Watch for stuff like links hitting high utilization consistently, or latency creeping up during busy times. Month-to-month bandwidth growth is another big red flag. Set your alerts around 70% utilization - way better to plan ahead than panic later when everything's on fire. The patterns basically show you where to throw money next. Maybe backbone needs beefing up, or some edge locations are getting crushed. It's like the network draws its own upgrade map if you're paying attention.
Oh man, jitter will absolutely wreck your VoIP calls. Basically what happens is packets show up at random times instead of steady intervals, so voices sound all choppy and robotic. Super annoying for everyone on the call. You'll start noticing problems around 10-15ms of jitter, but once it hits 30ms? Forget about it - might as well be talking to a broken radio. Quick fix though: set up QoS on your network to give voice traffic priority, or add some jitter buffers to smooth things out. Works pretty well most of the time.
Yeah so basically each traffic type needs its own metrics to watch. For video streaming, jitter and packet loss are everything - people lose their minds when Netflix starts buffering. Web browsing? That's all about latency and how fast pages actually load. File transfers can handle some delays but you want to track throughput and whether stuff actually finishes downloading. Honestly, most people just look at bandwidth numbers which doesn't really tell you much. You need dashboards that show what users actually feel, not just pretty graphs that make your boss happy.
Track which apps and departments actually eat up your bandwidth - the numbers will surprise you. I used to wing it and man, what a disaster. Peak traffic patterns show you exactly when you're over or under-provisioning stuff. Historical data helps predict future needs too. Set up alerts when utilization hits like 80% so you can shift resources before everyone starts whining about slow connections. QoS policies are clutch for bandwidth hogs. Honestly, just measuring utilization rates and app performance beats guessing every single time.
-
Design layout is very impressive.
-
Use of different colors is good. It's simple and attractive.