


 0 Comment
 Customer Reviews

Have you thought about the successful strategies of teams that help them maintain perfect product quality every time? Well, they often rely on a Quality Assurance Dashboard. It can assist them in testing quality metrics, spotting issues with defect tracking tools, and ensuring the best software quality. It can easily bring all your QA reporting in one place to avoid guesswork. And you can make smart decisions by viewing performance metrics in real-time through clear data visualization.
Also, teams using Agile QA take full benefit of the real-time test automation results. It checks compliance tracking and encourages continuous improvement in all stages of the project. It also keeps project management timelines on the correct track and maintains top quality control standards.
Click here to learn about Data Quality Dashboard and optimize your data management plan.
Note that dashboards make user acceptance testing smooth by creating readymade reports for review. Here, you can measure KPIs easily using the KPI dashboard and focus on the overall process optimization. And in case of failures, you can always run a root cause analysis and find clear answers through strong performance analysis.
Now, to make reporting easier, you must present all your data in clear and concise language. But putting everything in a single deck is a tough job, so try using our PPT templates made for QA dashboards. With these documents, you can show quality metrics, testing metrics, and QA reporting and speed up the product delivery process.
Also, take a look at our Quality Assurance Roadmap Templates with Samples and Examples.
These PowerPoint slides are perfect for covering different types of projects and can demonstrate process optimization and root cause analysis results. They can save a lot of your time and effort in building reports for project management and Agile QA updates. Based on your requirements, you can also include visuals for data visualization, performance metrics, and bug tracking.
Now, let us explore our Top 7 Quality Assurance Dashboard Templates with Examples and Samples.
Template 1: Call Center KPI Dashboard for Quality Assurance PPT Template
A KPI dashboard can track call quality, agent performance, and customer satisfaction. It can assist your project managers spot key issues like long wait times or call drops. So, include this template and illustrate the review sheet to help the call center check the agent's performance and improve the call quality. Its key components are call-handling skills, problem-solving skills, and closure of calls. It shows the average response time, first call resolution, abandonment rate, average transfer rate, and average hold time. Get the template now and share dashboard results with your team or boss using clear charts and graphs.

Template 2: Customer Support Quality Assurance Dashboards Edu PPT Template
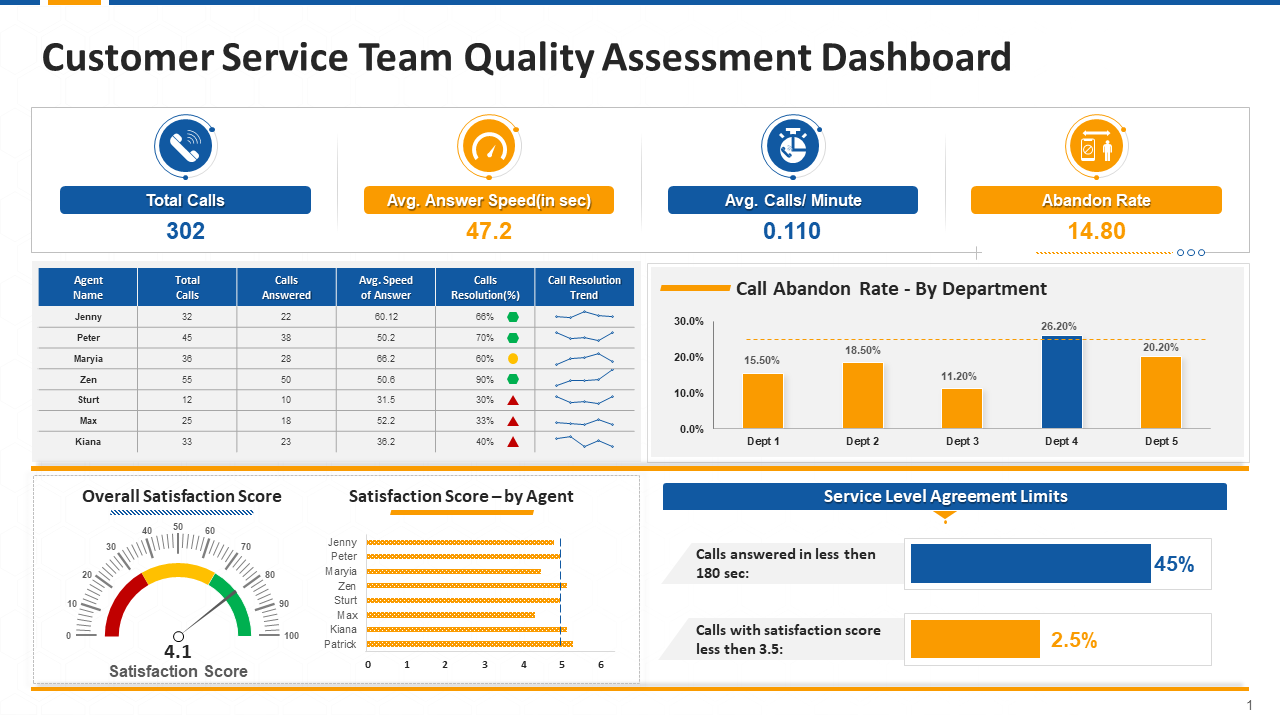
You can use the following PowerPoint template and monitor the effectiveness of the customer service team. The major KPIs mentioned in this slide are total calls, first call resolution rate, unresolved call rate, average response time, net promoter score, etc. Based on your requirements, you can include a few extra elements to display live data on different call parameters. Get the template now and improve decision-making for your team by showing all quality data in one simple view. You can also implement this tool to train staff better and improve service levels.
Template 3: Project Status Quality Assurance Dashboard Competent Quality Assurance PPT Template
With this format, you can check each and every aspect of the ongoing tests and their updates. And with the right PPT tool, you can make the dashboard look more professional, perfect for client or team meetings. Here, you can show the current performance of implemented quality assurance strategies for project management. You can display overall progress, project summary, overdue tasks, budget, risks, planned deadlines, etc. Now, click on the link below and show real-time improvement using clear numbers and simple charts.

Template 4: Pharmaceutical Quality Assurance And Control Dashboard PPT Template
The quality assurance dashboard can help you monitor medicine quality, batch testing, and other metrics in one place. It can highlight real-time data on errors, failed tests, and product recalls using simple visuals. So, use the template and illustrate facts and figures related to production quality data in the pharmaceutical industry. It includes production cost summary, production quality, important KPIs, etc. If you follow this tool, you can easily maintain pharma rules and find and fix problems early. Get the template now and show complex data with this simple, ready-made document.

Template 5: Call Center Quality Assurance Dashboard PPT Template
The following template shows a KPI dashboard for assessing the quality of call center operations. It can assist your team in improving the level of customer support and the efficiency of quality assurance programs. Here, you can demonstrate different performance metrics and average monthly scores of the team. You can also modify the content of the document as per your needs and make it your own within a few clicks. The template is perfect for meetings, reports, or training sessions and is available for you for immediate download, so get it now. It can improve team performance faster by focusing on authentic data, not just guesswork.

Template 6: Quality Assurance Dashboard with Project Time And Cost PPT Template
With this quality assurance dashboard, you can track project delays and test failures and accordingly fix them on time. You can spot which test stages waste the most time or money and improve them fast. The following template shows important elements such as current test cases, percentages of test cases approved and failed, cost of the project, etc. You can also include charts to show real-time costs, delays, and QA issues in a structured manner.
Get the template from the link and reap its benefits! It can save hours of your design time, so that you can focus on solving quality problems, not building the documents.

Template 7: Quality Assurance Dashboard For Achieving Zero Defect Manufacturing PPT Template
In manufacturing industries, a quality assurance dashboard becomes an essential tool to catch tiny errors in real time using data visualization and live testing metrics. It can help improve quality control by comparing the performance metrics to your set quality standards.
And to get the best results, you must check out the following dashboard template. It can guide your team on how to achieve zero-defect manufacturing using the metrics. Here, the template shows data for total units produced, rate of production, defective production, etc. Now, download it, make the necessary changes, and present QA reporting clearly to your business owners and investors.

Conclusion
A Quality Assurance Dashboard can make your entire project work smoother and accurate. It shows testing metrics, tracks bugs, and improves software quality. Also, it can save you hours of manual checks and support better project management.
But you will get the maximum benefit of this approach when you use the right set of PowerPoint tools for these dashboards. They can help you discuss complicated project results with your team or stakeholders in a simple, clear format. The documents make QA reporting easy and present live performance metrics and test results. You can also make necessary modifications and conduct overall performance root cause analysis. So, download the templates today and impress your audience!
Also, check out our Quality Dashboard Templates with Samples and Examples.
Quality Assurance Dashboard FAQs
1. What is a QA Dashboard?
A QA dashboard is basically a visual tool that shows testing progress and software quality all on one page. It contains important metrics that help you track bugs, check performance, and make better decisions. With this tool, you can get real-time updates and accordingly fix issues on time and improve the overall project performance.
2. What are the 4 types of Quality Assurance?
The four types of quality assurance are:
- Process-based QA –It mainly focuses on improving testing methods.
- Product-based QA – It checks if your products meet top quality standards.
- Risk-based QA – You can use this approach to spot possible risks and fix them early.
- Compliance-based QA – It makes sure all work meets rules and compliance standards.
3. How to create a QA Dashboard?
There are a few steps to create a QA dashboard-
- First, set your QA goals and objectives.
- Based on your project needs, list your performance metrics and quality metrics.
- Then, you need to pick a tool with strong data visualization like Excel, Power BI, or Tableau.
- Next, you can connect your data to your test tools.
- Add graphs and charts to show real-time test results and open issues. Use color codes to highlight issues.
- Make it easy to read and update.
- Test it regularly and keep improving it based on user feedback.