


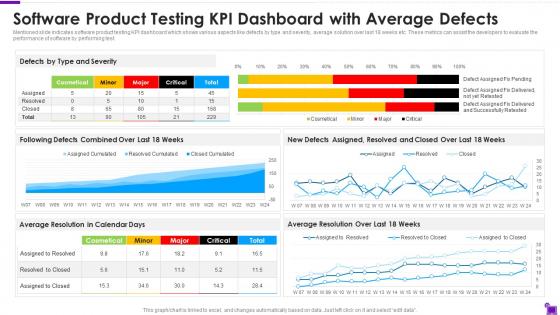
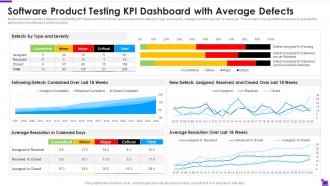
Software Product Testing Kpi Dashboard With Average Defects




Try Before you Buy Download Free Sample Product
 Impress Your
 Audience
 100%
100% Editable
 Save Hours
 of Time


Mentioned slide indicates software product testing KPI dashboard which shows various aspects like defects by type and severity, average solution over last 18 weeks etc. These metrics can assist the developers to evaluate the performance of software by performing test.
People who downloaded this PowerPoint presentation also viewed the following :
Software Product Testing Kpi Dashboard With Average Defects with all 7 slides:
Use our Software Product Testing Kpi Dashboard With Average Defects to effectively help you save your valuable time. They are readymade to fit into any presentation structure.






FAQs for Software Product Testing Kpi Dashboard
Focus on defect density first - bugs per line of code gives you the clearest picture. Test coverage percentage matters too, but honestly? Defect escape rate is what'll keep you up at night since those are the bugs users actually see. Mean time to detect and resolve issues is solid for tracking improvements. Oh, and test execution efficiency if you're drowning in manual work. Don't go crazy tracking everything though. Pick maybe 2-3 that match your biggest headaches right now. I learned this the hard way - too many metrics just creates noise. Defect escape rate hits different because it shows real impact on users, which is what actually matters at the end of the day.
So you just divide total defects by your codebase size - usually lines of code or function points. Like if you've got 50 bugs in 10,000 lines, that's 0.005 defects per line. Really handy for spotting which parts of your code are trainwrecks. Managers eat this stuff up since it's actual numbers they can point to. You can compare against industry benchmarks too, see if your testing is actually working between releases. I track it every sprint - makes it super obvious which modules need some serious love. Honestly beats trying to explain code quality with vague descriptions.
So test coverage basically tells you what percentage of your code actually gets tested when you run your test suite. Most teams shoot for somewhere between 80-90% - though honestly, I've seen codebases with 100% coverage that still had tons of bugs, so don't get too hung up on the numbers. You can track it with tools like JaCoCo or Istanbul. The real trick is watching trends over time instead of stressing about hitting some perfect target every single sprint. Way more useful than obsessing over whether you hit 85% vs 90% this week.
Hey! So basically track how long your full test cycles take - from kickoff to wrapping up all your planned tests. Breaking it down by phases is super helpful too, honestly that's where you'll find the good stuff. Compare these times across different releases and you'll start seeing patterns. Are things speeding up or getting worse? The trick is staying consistent with how you measure so you can actually figure out what's causing delays. Oh and don't forget to look at where tests are getting stuck - those bottlenecks will jump out at you once you start timing everything properly.
You want to track response time consistency first - like, does your app stay fast under heavy load or does it randomly tank? Error rates are obvious but super critical. Watch your CPU and memory usage patterns too. Memory leaks will absolutely wreck you during long test runs, trust me on that one. Throughput's another big one - can your system handle the same traffic volume hour after hour without crapping out? Don't forget about database connections and any third-party APIs you're hitting. Set up baselines for all this stuff, then create alerts when things start going sideways.
So escape rate tracks how many bugs make it past your testing into production - kind of like grading your QA team's work. You can spot trends in what's slipping through. Edge cases getting missed? Integration problems not caught in test environments? It gives you actual data instead of just wondering why things broke. Honestly, most teams don't track this consistently enough. Start measuring it per release and you'll see exactly where your testing process is falling short. Way better than playing guessing games after something blows up.
So those automated testing metrics are honestly pretty clutch for speeding up releases. You get instant feedback on coverage, pass rates, execution times - all that good stuff. Way better than finding out everything's broken right before you ship (been there, not fun). Track things like test flakiness and runtime to keep optimizing your suites. Stakeholders eat up the concrete quality numbers too, which is nice. Oh, and definitely compare your manual testing time vs automated first. That's where you'll see the most obvious wins hiding.
Think of this ratio as your testing efficiency scorecard - shows how much you've automated vs. what still needs manual work. Track it monthly to see if you're actually hitting your automation goals. Higher ratios usually mean faster feedback and more consistent results, but honestly don't stress about automating every single thing (some tests are just a pain and not worth it). Calculate where you're at now, then aim for maybe 10-15% increases each quarter. Start with your most boring, repetitive test cases first - those are the easy wins.
Customer-found defects are like getting graded on your actual homework instead of practice tests. When users hit bugs you missed, it shows holes in your testing - wrong environments, missed scenarios, whatever. High numbers mean you're basically crowd-sourcing QA to paying customers, which is... not ideal. This metric's brutal because it shows the gap between what you shipped versus what people actually get. I always compare it against pre-release bug catches too. If you're finding way more stuff internally but customers still hit issues, might be testing the wrong things entirely.
So basically, cost of defects tracks how much cash you're burning on bug fixes at different stages. Early bugs? Cheap. Production bugs? Insanely expensive - like 10x more. I learned this the hard way on my last project. You can measure it per defect or total costs, maybe break it down by how severe stuff is. Track it monthly and you'll see patterns emerge. It's actually pretty useful for convincing higher-ups to invest in better testing upfront. Shows the real dollar impact when quality goes sideways.
Track your executed vs planned test cases weekly - it's honestly one of the best ways to see how your team's actually doing. Aim for that 80-90% sweet spot. Below that? You're probably being too optimistic about what you can get done (or those "quick fixes" are turning into day-long rabbit holes again). Above 90% consistently means you're underselling what your team can handle. Once you find your realistic execution rate, sprint planning becomes way less of a guessing game. Start tracking now and watch the patterns emerge.
Honestly, you gotta know where you're starting from first. Check your current defect rates, test coverage, cycle times - whatever data you've got from the last few quarters. Don't fall into that trap of setting some random "90% coverage" goal just because it sounds good. Been there, it's basically just busy work. Pick 2-3 things that actually matter to the business. Your team should help set these targets too - they know what's realistic way better than management does. Just make sure you can actually track whatever you choose, then revisit every few months to tweak things.
Pass/fail ratios are decent for gauging if you're ready to ship, but don't get hung up on the raw percentages. I've watched teams stress about hitting 100% when half their tests were basically useless anyway. What matters is *what's* failing. Core user flows breaking? That's bad news. Random edge cases acting weird? Probably fine to ship. 85% pass rate with minor UI glitches beats 95% where your login system is busted. Look at the failures, figure out which bugs actually matter, then decide if you're good to go.
So basically you wanna time everything from when someone reports the bug until it's actually verified fixed. Log timestamps at each step - when it's found, assigned, being worked on, resolved, all that. Here's the thing though - averages are garbage because one nightmare bug will mess up your whole picture. Track percentiles instead and split things by how critical they are. Oh and definitely break it down by bug type too. Like maybe your UI bugs always get stuck in testing or whatever. Once you have a few months of data, you can set some realistic targets and figure out where your team keeps getting bottlenecked.
Look, tracking your team's velocity is actually huge for testing health. How fast are you knocking out test cases? Getting through regression cycles? That's your testing throughput right there. But here's what most people miss - collaboration stuff matters just as much. Like how quickly devs and testers actually talk to each other, or how long issues sit before someone triages them. Those bottlenecks kill everything. I know it's not your typical defect density metrics, but honestly? Start measuring test completion velocity sprint by sprint. You'll spot patterns real quick - what's working, what's totally screwing your team over. Makes a difference.
-
“Detailed and great to save your time.”
-
Definitely a time saver! Predesigned and easy-to-use templates just helped me put together an amazing presentation.