

 0 Comment
 Customer Reviews

In any business, how do you measure and recall customer satisfaction a year or two after the purchase and use of your products and services? The answer is, of course, in the form of tangible numbers or written responses that express the value the customer gained from your business.
Today, the importance of customer satisfaction has risen. It is no longer just a nice-to-have metric — it’s a core business strategy. Studies suggest that 86% of customers are willing to spend extra for a better experience, and organizations that focus on customer experience make 4–8% more money than their competitors.
What makes this possible? Dashboards that capture customer sentiments, behavior, and feedback in real time and are backed by data are the tools that make it rock!
Increasingly, businesses are relying on dynamic customer satisfaction dashboards to make smart choices. As an action point, this means that companies are tracking Net Promoter Scores (NPS), analyzing complaint resolution time, and tracking social media engagement. Gartner says that by 2025, 60% of businesses will use customer experience metrics to make their products and services better. That’s a staggering indicator of how crucial these dashboards have become to boardroom discussions and day-to-day operations alike.
But here’s the challenge — not all dashboards are built the same.
A lot of companies have trouble searching for designs that are both helpful and easy for cross-functional teams to interpret. It would be fantastic if you had a list of templates that not only aesthetic but also provides you the exact KPIs your business needs to keep an eye on.
In this blog, SlideTeam brings you world-class Customer Satisfaction Dashboard Templates with Examples and Samples to help visualize, track, and improve your customer experience strategy. These templates depict what can happen when data and design come together, whether you're a business owner, a marketing manager, or a CX expert.
Ready to turn customer feedback into actionable business intelligence? Dive in — your customers (and your bottom line) will thank you for it.
Template 1: Dashboard to Track Customer Satisfaction KPIs Strategies to Improve Customer Service PPT
This dashboard template has a full visual style for tracking customer satisfaction KPIs. It includes a Net Promoter Score (NPS) gauge to measure customer loyalty, a Customer Retention Rate chart, and Customer Effort Score (CES) indicators. The chart provided showcases the number of complaints customers have, a line chart that showcases how satisfied customers are each month, information on how long it takes to respond to service requests, and how many complaints have been resolved. The bar graph displays what customers think about service touchpoints. This slide allows organizations to gather customer satisfaction data in one place, look for patterns, find recurring issues, and use data to make decisions that enhance service and build a loyal customer base.
Template 2: Customer Service Dashboard with Product Customer Satisfaction
This template has ten sections to help you track customer service KPIs at the product level. These sections include: Product Name, Average Response Time (hours), Customer Satisfaction Score (percentage), CSAT by Incident vs Forum (donut chart), Customer Effort Score (semi-circle gauge), Net Promoter Score (overall loyalty), CSAT Percentage Breakdown (bar chart), Average Response Time over a month (line graph), and CSAT trend over a month (area chart). There are also three emoji icons (happy, neutral, and angry) that show the proportions of promoters, passives, and detractors. It lets support staff and analysts put together reports that are ready for executives, keep an eye on performance over time, ensure service KPIs are in line, and find bottlenecks. 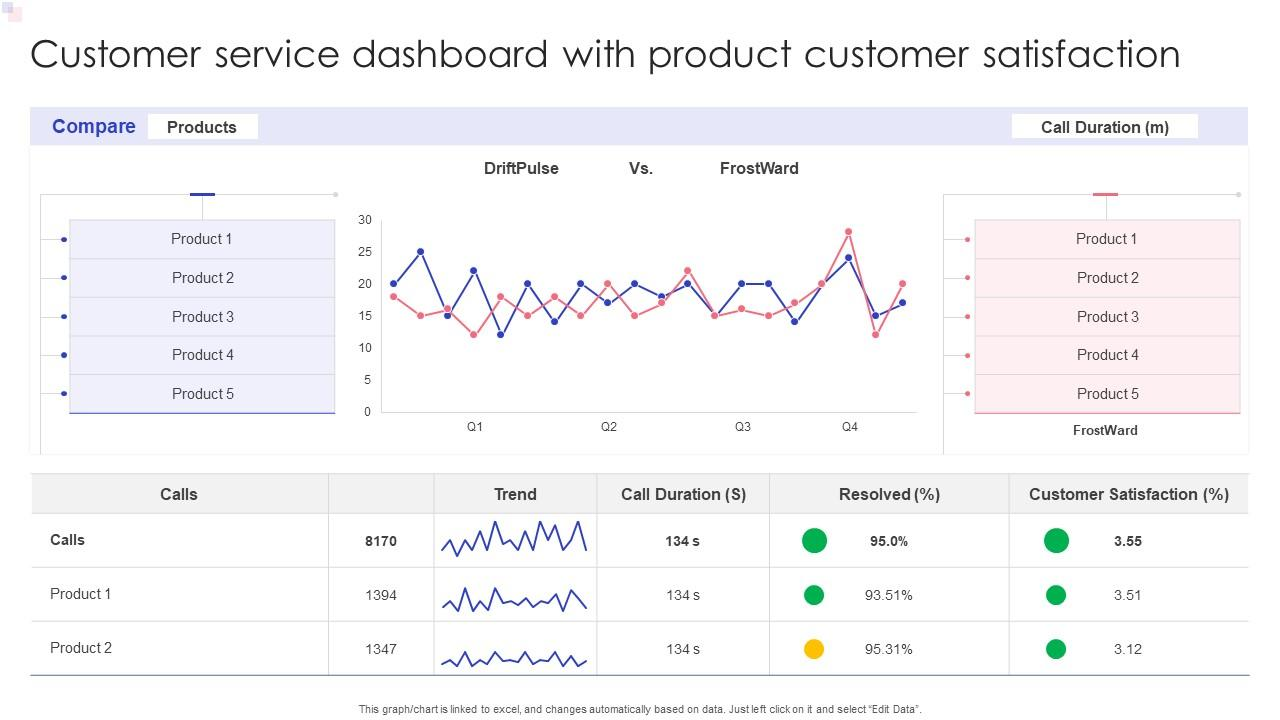
Template 3: Dashboard for Analyzing Aftersales Customer Satisfaction KPIs Conducting Successful Customer
The template helps organizations track how their aftersales support is doing, find out how long it takes to respond to customers, track how many problems are solved, and use data-driven insights to improve customer relationship management. This slide displays KPIs for customer happiness after the transaction, such as the Average Response Time, the Number of Complaints Received, the Net Promoter Score (NPS), the Customer happiness (CSAT) Score, the Customer Effort Score (CES), and the Complaint Resolution Rate. It showcases monthly trends for each parameter in both bar and line chart forms.
Template 4: Analysis Dashboard of Customer Satisfaction PPT Template
This dashboard template features Customer Satisfaction Score, Net Promoter Score, and Customer Effort Score represented through circular percentage indicators. It includes Total Resolved Complaints and Monthly Unresolved Complaints metrics visualized using bar charts for performance tracking. The template presents Top 5 Issues by complaint volume and Complaint Resolution Rate in a line graph. It also helps users track customer satisfaction, identify recurring service problems, and analyze complaint resolution trends to improve operational performance.
Template 5: Dashboard of Customer Satisfaction Analysis PPT Template
The number of complaints broken down by kind using a stacked bar chart that compares categories over a month are displayed in this slide. There are circular percentage indications for Customer Satisfaction Score, Net Promoter Score, and Customer Effort Score. The template shows the Monthly Satisfaction Trend in a line graph that shows how performance has changed over time. It helps users figure out what makes them happy, sort complaints by category, keep an eye on service trends over time, and decide on a strategy to improve based on real facts.
Template 6: Customer Satisfaction Service Delivery Dashboard PPT Template
Customer experience is shaped as much by speed of service as by issue resolution quality in daily business operations. This dashboard presents Customer Satisfaction Score, Net Promoter Score, and Customer Effort Score as percentage indicators. It tracks Average Resolution Time per service request and total Complaints Received during the period. Delivery Success Rate is visualized through a weekly bar chart. This template helps users monitor service performance, identify operational delays, and improve customer service processes.
Template 7: Customer Satisfaction Dashboard M2735 PPT Template
When organizations monitor resolution speed, feedback scores, and complaint trends in structured dashboards, customer happiness goes up. This template includes the Net Promoter Score, Customer Satisfaction Score, and Customer Effort Score as numbers. It shows Complaint Resolution Time and Complaints Logged metrics in a line chart with Monthly Satisfaction Trends. A pie chart breaks down complaint categories for the examination of the issue. This template helps people understand service trends, see patterns in problems, and make their operations run more smoothly.
Template 8: Customer Satisfaction Data Brief Dashboard
This dashboard allows your business to measure and record Customer Satisfaction Rate, Recommendation Rate, Survey Participation Count, Customer Effort Score, Net Promoter Score, and Satisfaction Trend over time visualization. It segments responses by demographics using stacked bar charts and lists Top 5 Improvement Areas derived from feedback. This template helps users monitor satisfaction drivers, evaluate promotional likelihood, assess effort perception, and prioritize service enhancements based on structured customer data.
Template 9: Customer Complaint and Satisfaction Analysis Dashboard
Most customers aren't unhappy with the problem itself; they, however, tend to be furious with the delays and inadequate response in service. This template showcases the main metrics as Complaint Volume by Type, Average Resolution Time, Customer Satisfaction Score, Net Promoter Score, and Customer Effort Score. It also tracks Complaint Resolution Rate and graphs the Satisfaction Trend over time. This dashboard is the main tool to identify the recurring issues, figure out how well they are responding, keep an eye on how trends change over time, and suggest specific ways to make operations better.
Template 10: Customer Success and Satisfaction Metrics Dashboard
In everyday customer operations, most service decisions are based on creating a balance between speed, satisfaction, and account value. The performance indicators included in this template are Average Customer Satisfaction Score (CSAT), Average Response Time, and Service Level Agreement (SLA) Compliance. It showcases the best company accounts depending on how satisfied customers are and how well the service works. This slide helps users guess how happy customers are, understand how well service agreements are being followed, and put high-value accounts at the front of the list for focused operational improvements and problem solving.
Turn Insights into Impact
The dashboards we explored aren’t just templates; they’re strategic tools that convert scattered feedback and performance data into meaningful, business-shaping intelligence. From resolving complaints faster to identifying service gaps and refining customer journeys, these dashboards translate numbers into narratives that drive real impact. As customer expectations evolve, your ability to monitor, adapt, and act in real time will define your competitive edge.
Choose the right tools, track what matters, and let data-led decisions power your next wave of customer loyalty.
Customer Satisfaction Dashboard FAQs
Why is tracking customer satisfaction important for businesses?
Tracking customer satisfaction improves customer retention by identifying what keeps customers loyal and engaged. It highlights service gaps and operational inefficiencies, allowing businesses to take corrective action where it matters most. Satisfied customers are more likely to make repeat purchases, recommend the brand to others, and contribute to higher revenues. Moreover, collecting and analyzing satisfaction data enables leaders to make informed, customer-focused decisions that enhance overall business strategy.
What key metrics should be included in a customer satisfaction dashboard?
A customer satisfaction dashboard should always include the Customer Satisfaction Score (CSAT), which measures customer contentment with products or services. The Net Promoter Score (NPS) is equally important as it assesses customer loyalty and likelihood to recommend the brand. Customer Effort Score (CES) helps track how easy it is for customers to resolve issues or complete tasks. Additionally, metrics like complaint volume, resolution time, and service response time should be included to monitor operational efficiency and service quality.
What data sources are integrated into a customer satisfaction dashboard?
Customer satisfaction dashboards integrate data from direct feedback surveys such as CSAT, NPS, and CES, collected via emails, apps, or online forms. CRM systems serve as another vital source, offering records of customer interactions, purchase history, and service requests. Social media monitoring tools contribute valuable sentiment data by capturing customer opinions and mentions across platforms. Additionally, helpdesk and ticketing systems supply operational data like complaint volume, resolution rates, and response times, completing a comprehensive view of the customer experience.