You bought a new washing machine this year and want to know how to operate it. Reading the user manual seems time-consuming, and you may need help finding instructions about specific functioning. But you cannot trust the knowledge of every person about the specific brand/model. The most reliable help you can get with the demo is from customer service/support (either on a call or a visit from a brand-authorized service engineer).
This scenario is true for home appliances, automobiles, IT, finance, medical, or E-commerce. You cannot run a smooth business without having robust customer support. This makes customer service the world’s second most competitive and developing industry.
The Nitty-gritty of the Customer Service Industry And Dashboards
Businesses are taking head-to-head to provide the best support to their customers and use it as a competitive edge. BPOs/KPOs are in a tug of war to attract more best-paying clients. Support agents are in cut-throat competition to meet their targets and win the best performer award.
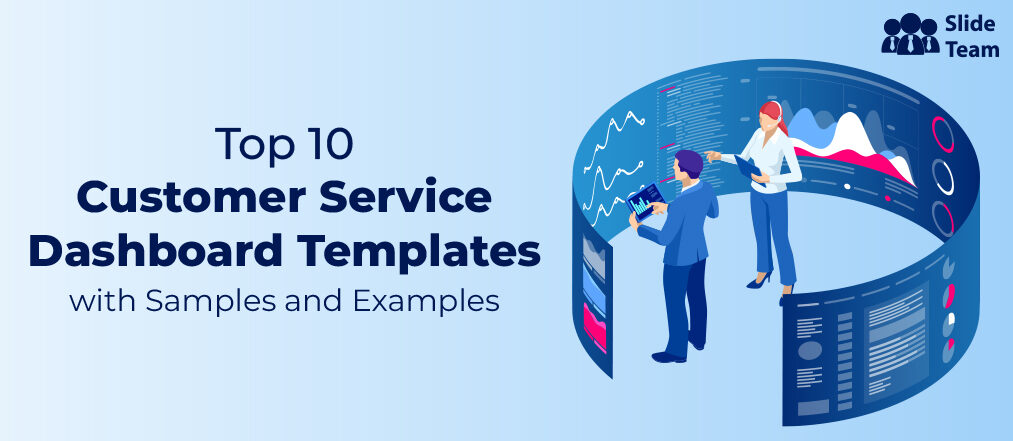
With this much competition, it is necessary to have the right tools, like a Customer Service Plan and detailed process maps, to sustain. The Customer Service Dashboard is one such tool that is helpful for support agents, managers, C-executives, and clients in tracking and managing customers’ requests, support processes, advisors, and metrics.
Depending on the metric type, like First Call/Contact Resolution (FCR), Customer Satisfaction Score (CSAT), Net Promoter Score (NPS), Customer Retention Rate (CRR), etc., you can create a number of dashboards.
Customer Service Dashboard Templates
The most popular dashboards are the customer service team dashboard, customer satisfaction dashboard, customer support KPI dashboard, service quality dashboard, and customer retention dashboard. You can also have a collaborative or single dashboard for key elements that will affect the customer experience.
In this blog, we will try and understand this tool with the help of the Customer Service Dashboard Template. Many PPT Designs are available to download from the links shared along and are entirely customizable to help you create a support dashboard in minutes. You can use these compatible PowerPoint layouts to streamline the process of creating a dashboard.
Let’s explore this collection of ready-to-use customer service dashboard templates now!
1. Customer Service Dashboard Presentation Template
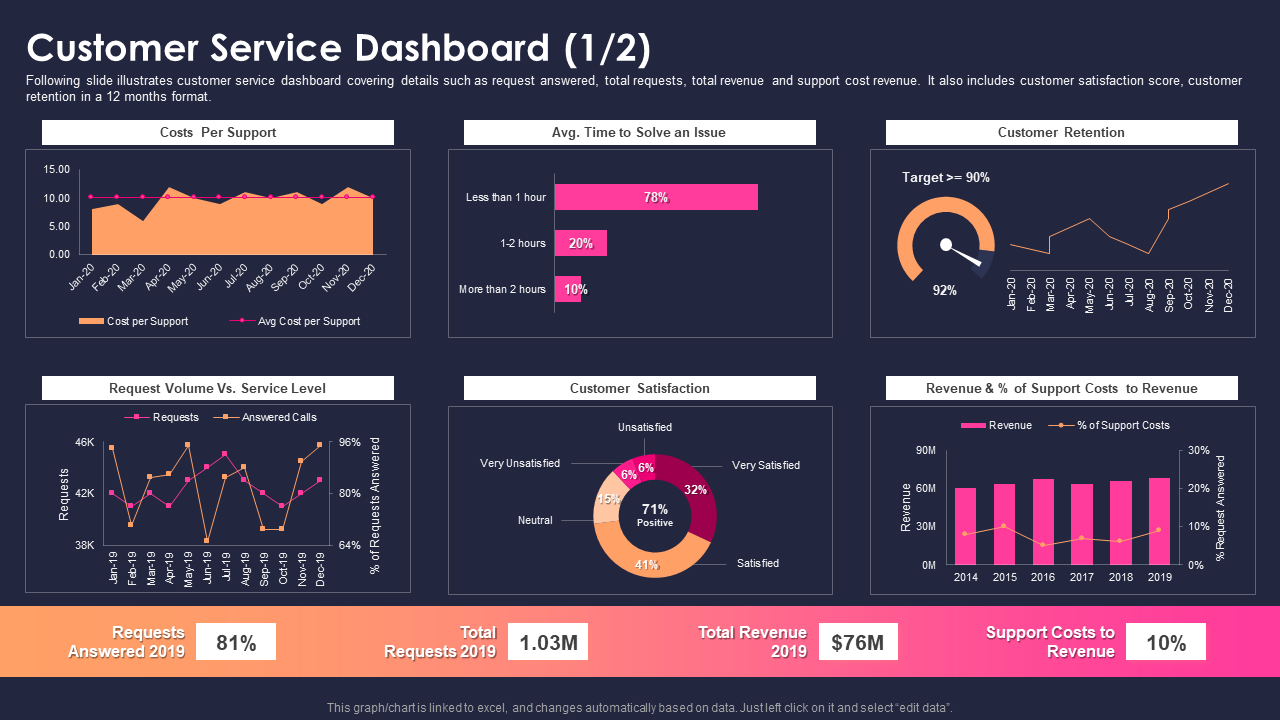
Employ this PPT Template to monitor and evaluate customer service performance indicators (KPIs) and generate insights to improve customer relationships and ensure business growth. With the help of this Customer Service Dashboard Template, the team will be able to perform basic and advanced analysis, learn from generated information on the spot and make data-driven decisions. It will help create a customer-centric solution focused on critical metrics and give the best possible outcomes for your business. Grab it now!
2. Customer Service Metrics Dashboard Presentation Template
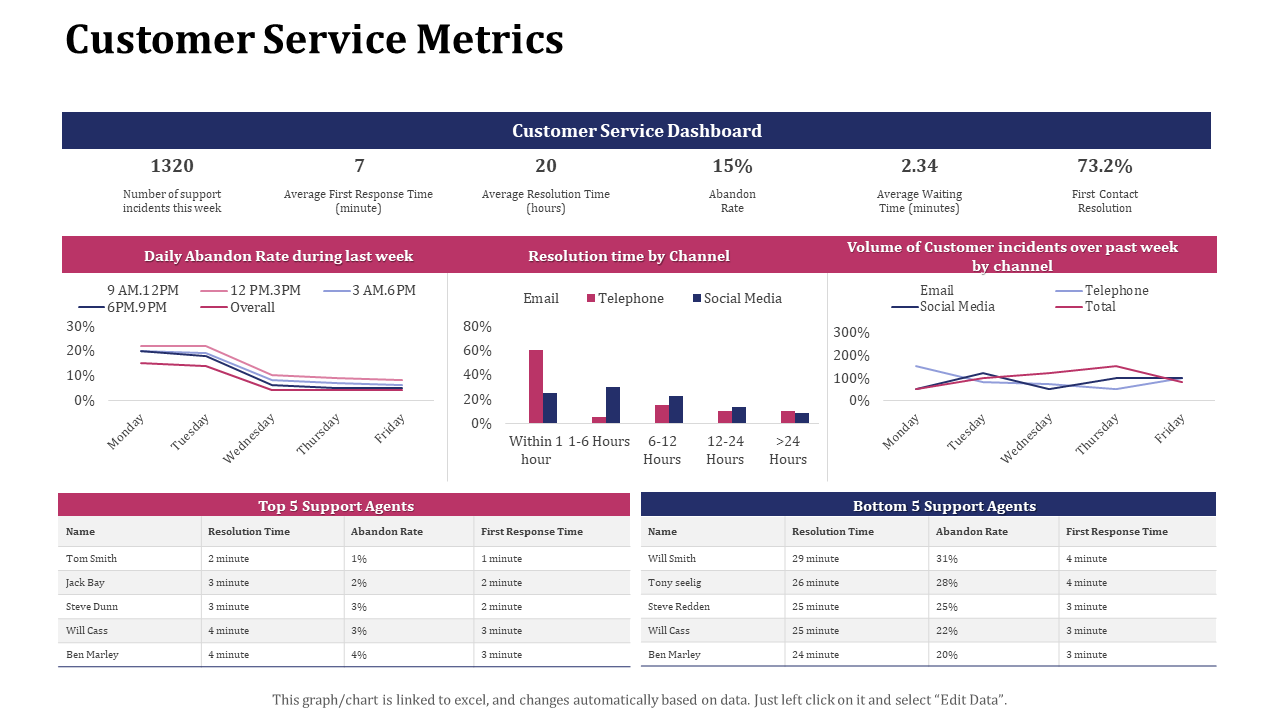
Whether you are an advisor, manager, or VP, a customer support dashboard will help you do your job better. It will help you track the key performance indicators and identify your strengths, weaknesses, and improvement opportunities. This sample customer support dashboard template will help track metrics that are common and critical to a helpdesk dashboard and customer satisfaction. It will allow management to get a general overview of the service process in one glance by collaborating data and insights like daily abandon rate, resolution time for individual channels, first response time, average resolution time, top & bottom quartiles, and volume trends. Get it now!
3. Call Center Customer Service KPI Dashboard Template
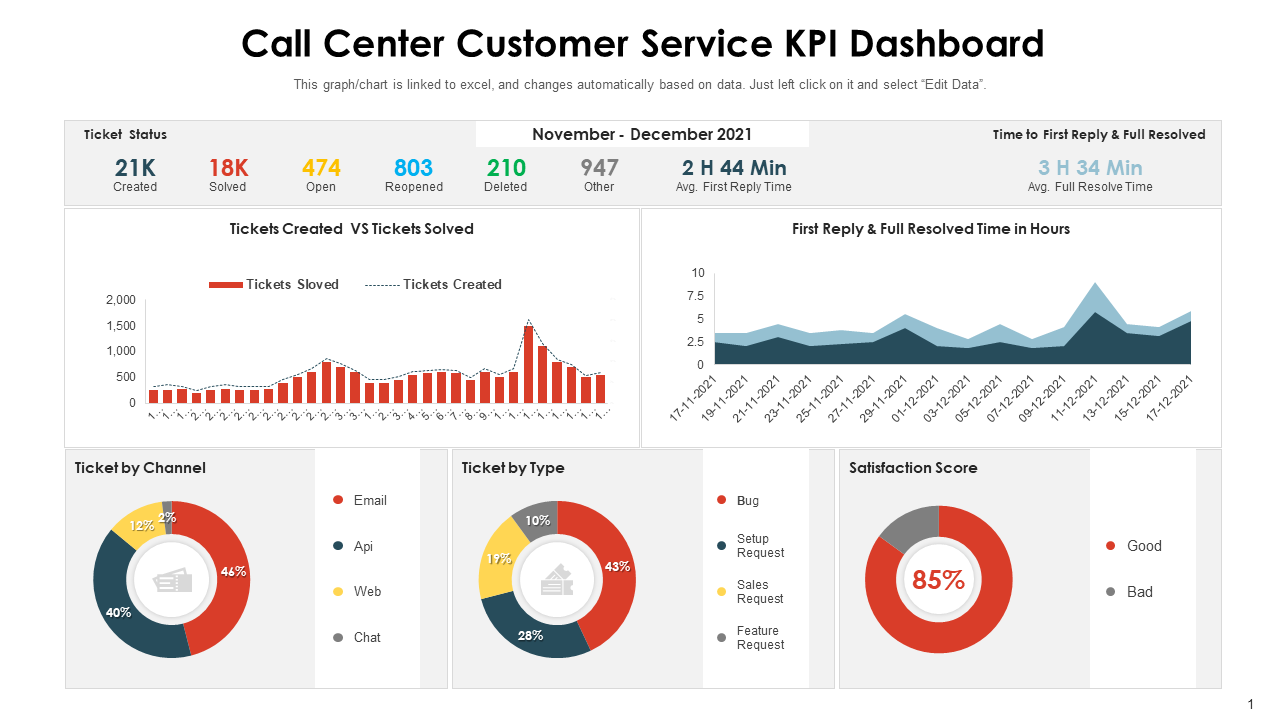
Customer service is in the blood and bones of call centers and Business Process Outsourcing (BPO) employees. They are so passionate about happy customers that they live, sleep, eat, think and dream about this only. This customer support KPI dashboard template has been curated to support the daily operations of call centers and BPOs. It helps in reading the data of ticket status, customer satisfaction (CSAT) score, sorting tickets by channel & type, first resolution time, created vs. resolved ticket, etc. Download it today!
4. Customer Service Revenue Per Call Dashboard Template
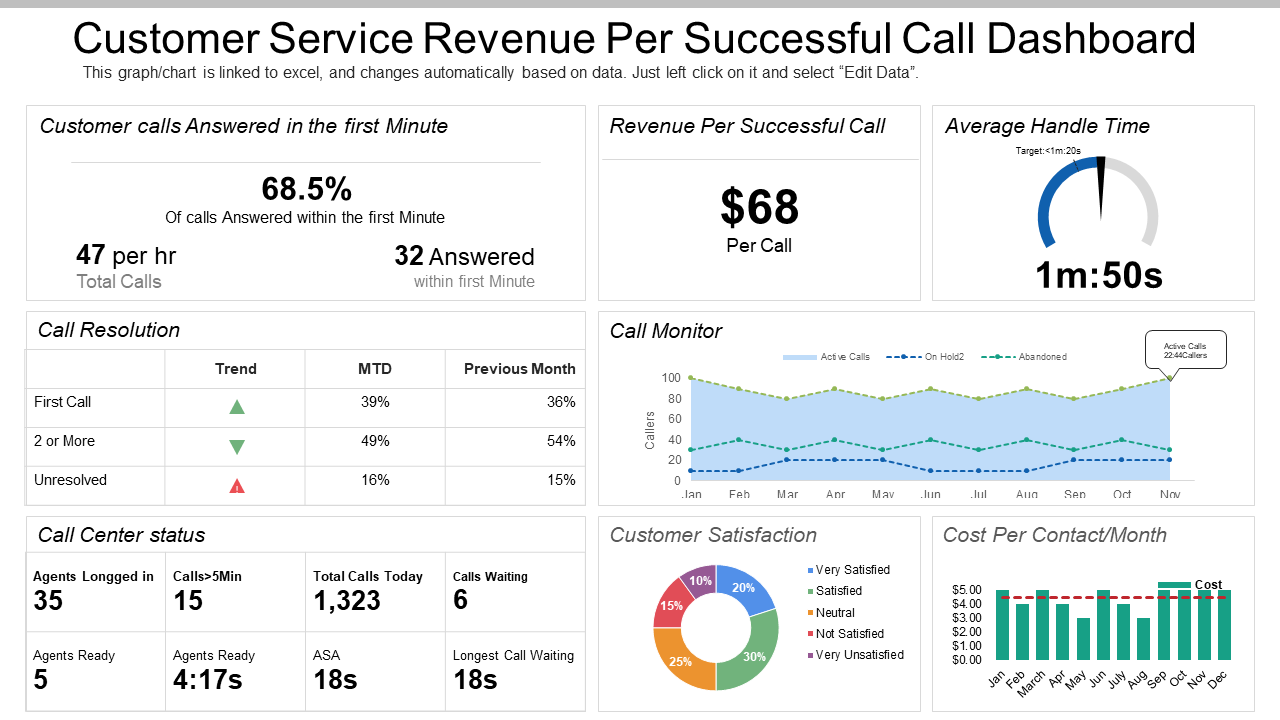
Revenue from customer service is affected by more than one reason, and direct measures cannot calculate it. One way is to measure and compare the percentage of costs to your revenue. It will give you an idea of how much you need to invest in your support teams relative to the generated revenue. This customer service dashboard template includes metrics that have a significant impact and help calculate revenue, like the percentage of calls answered in the first minute, average handling time (AHT), call resolution per number of contacts, CSAT, cost per contact, etc. Grab it now!
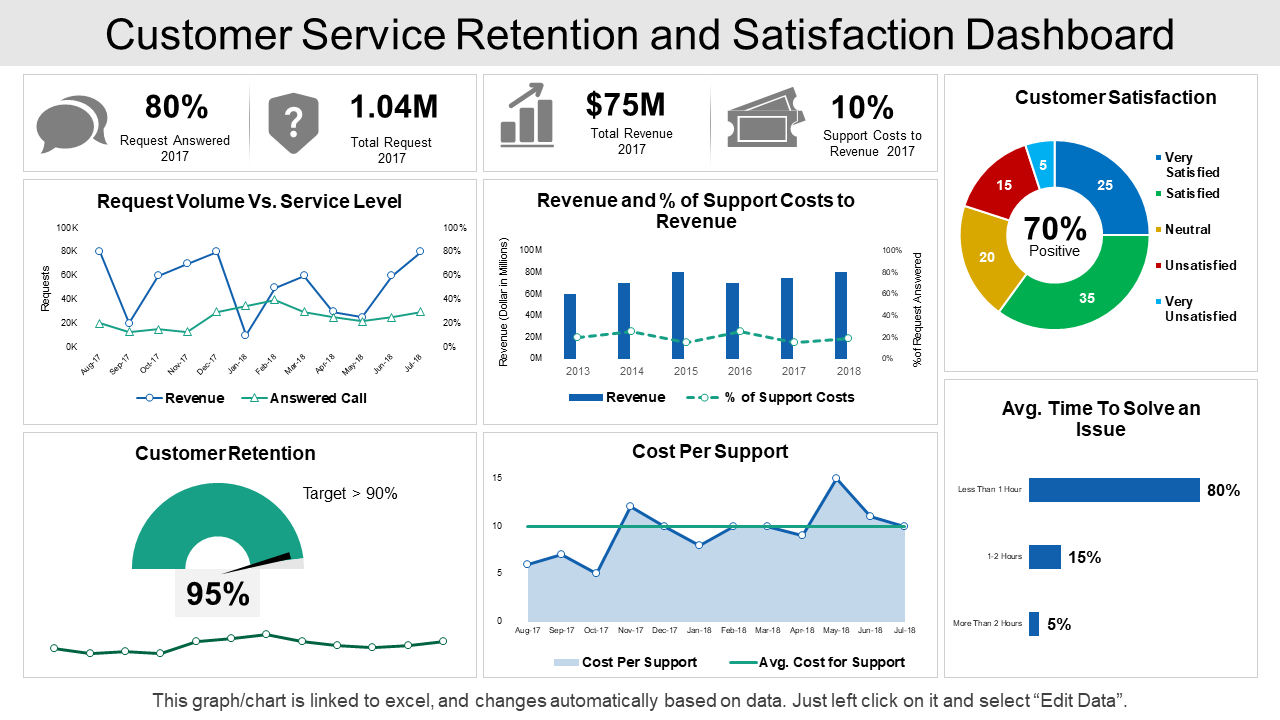
5. Service Dashboard Template for Customer Retention And Satisfaction
Customer retention is the backbone of a successful running business. Acquiring new customers is often more expensive and time-consuming than retaining the older ones. On the other hand, keeping the customers satisfied will minimize the churn rates and increase profit. This customer service dashboard template will help you monitor the data and optimize your strategies according to the business laws and for maximum customer satisfaction. It entails the metrics like average customer satisfaction survey score, retention rate, cost per contact, revenue vs. service level, the average time to resolve issues, etc. Get it now!
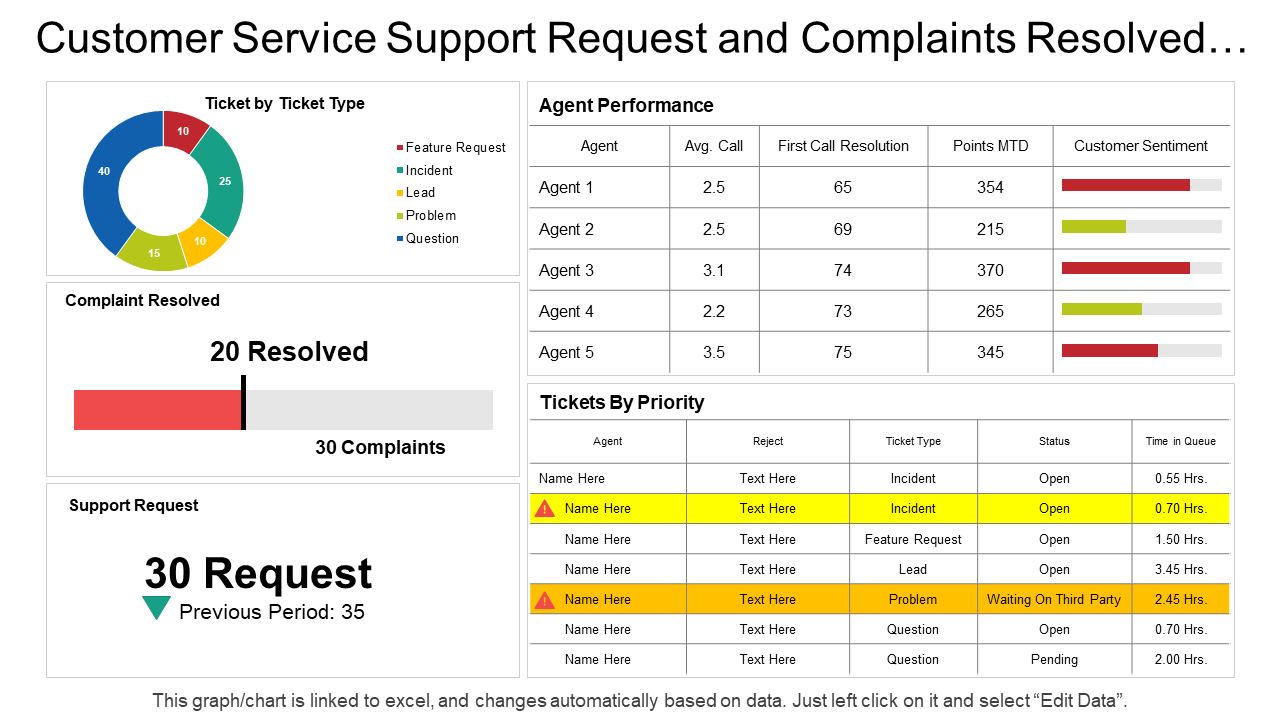
6. Customer Service Dashboard Template for Support Requests & Complaints Resolved
Exceptional customer service is the top priority and a way for businesses nowadays to make a home in their customers’ hearts. Studies show that easily accessible information, excellent customer support, and memorable service experience make people love a brand and persuade them to pay more. This PPT template will help you make a customer-centric process with a service dashboard that records metrics like tickets by priority, complaints resolved, support agent performance, support requests pending, etc. Download it now!
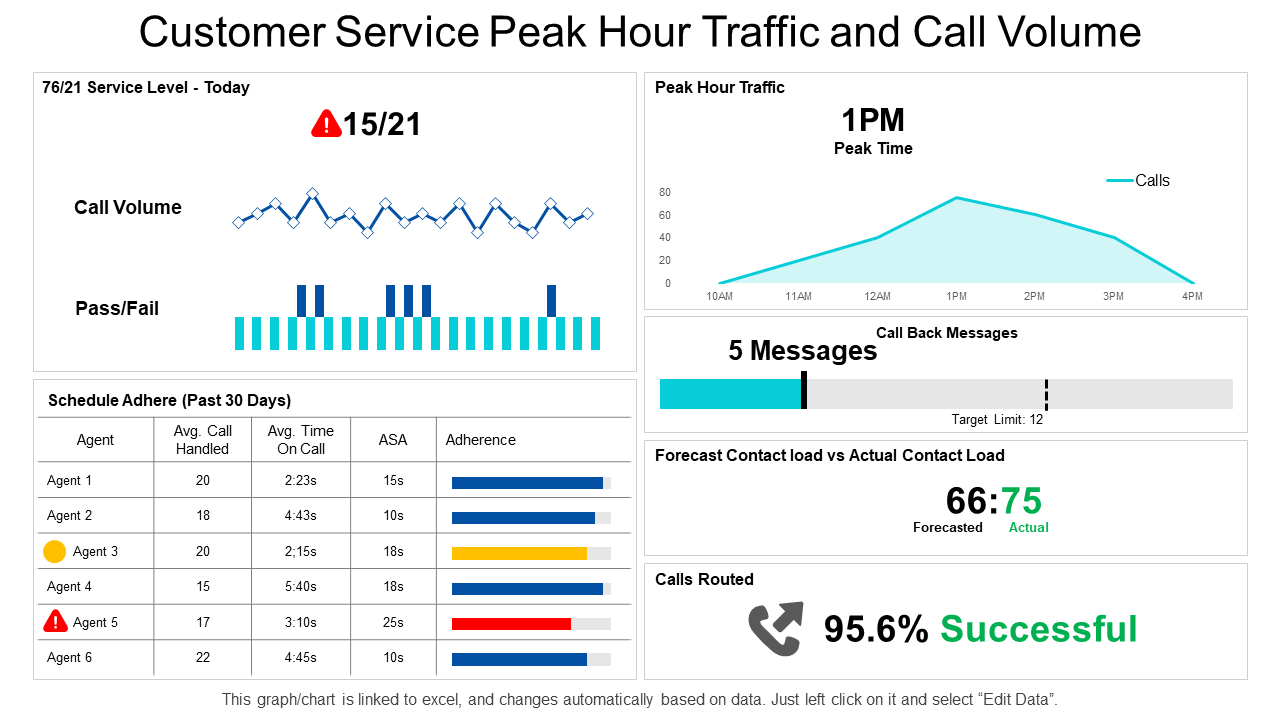
7. Customer Service Dashboard Template Traffic And Call Volume
Immediate and satisfactory support is essential to build a strong customer relationship. If you need to represent how you handle your customers at the peak hour traffic and calls, then we recommend this editable customer service dashboard PowerPoint template. It includes a table highlighting agents; Average call handled, average time on call, ASA, and adherence, and a bar graph for peak time and the number of callback messages. Download it now!
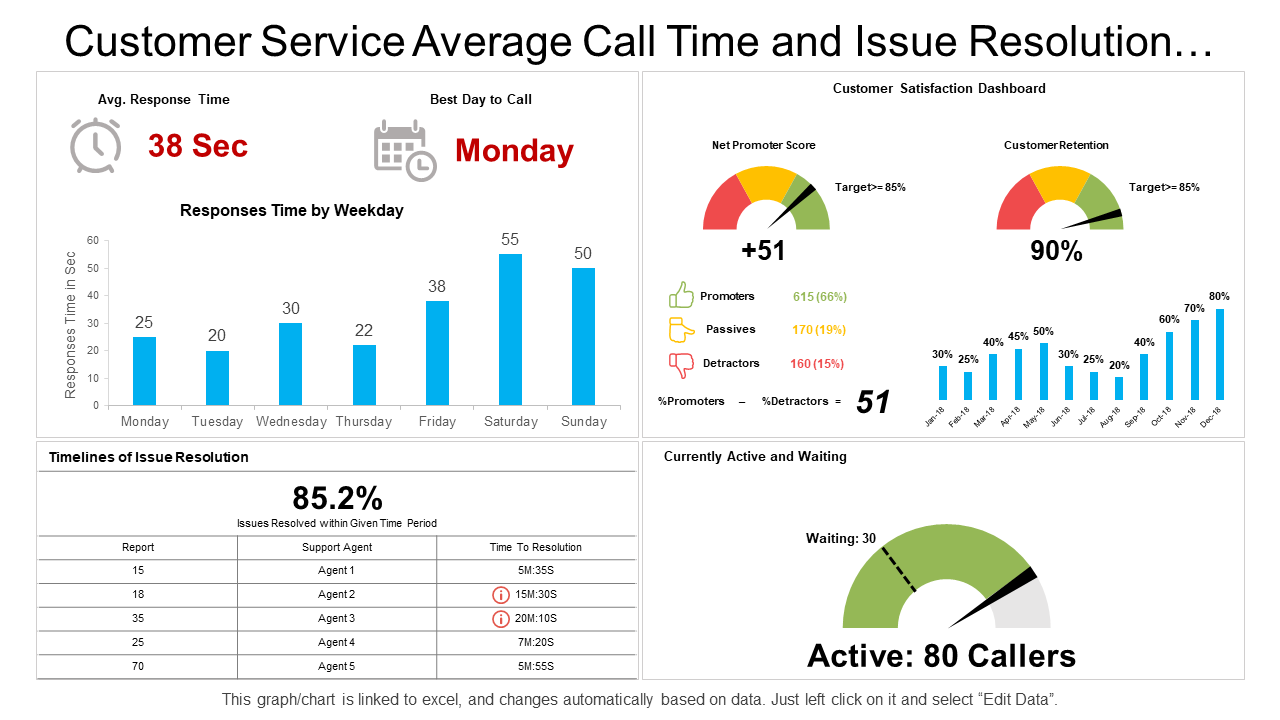
8. Customer Service Dashboard Template for Issue Resolution Timeline
Conceptualize the thought of call management into an effective PPT presentation and illustrate the idea of call management to the executives using this dashboard template. This easy-to-customize resolution timeline dashboard entails tables, bar graphs, and speedometers to present data in a hypnotic manner. This PPT layout depicts reports, support agent count, resolution time, response time, weekly call trends, average response time, currently active and waiting calls, customer satisfaction dashboard, NPS, and CRR. Grab it today!
9. Customer Service Team Performance & Ticket Management Dashboard Template
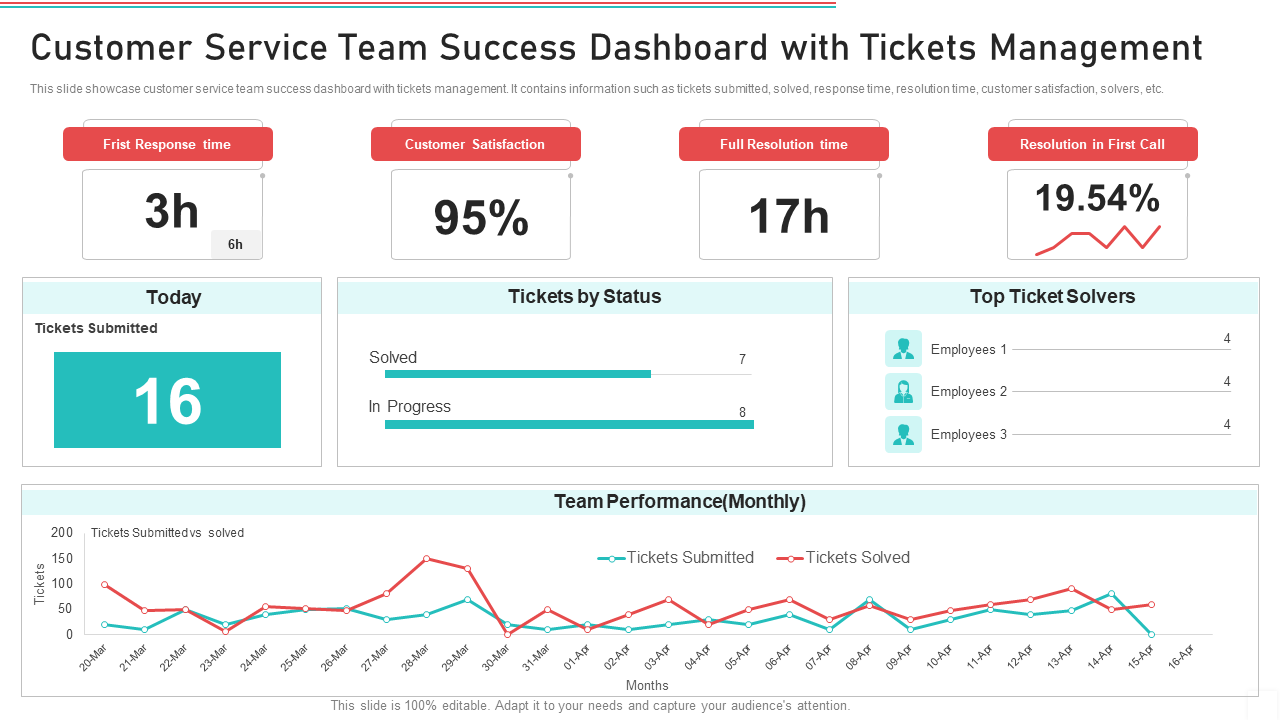
Customer’s set the bar of service expectations often on the higher side, and these standards are challenging to meet for brands. Exceptional customer service means surpassing customers’ expectations with the help of your team. This Customer Service Dashboard Template will help you track the metrics that enhance your team performance and help you reach (even surpass) these expectations. It contains performance indicators like customer satisfaction, full resolution time, resolution in the first call, first response time, top ticket solver, etc. Get it now!
10. Customer Service Dashboard Template For Contact Resolution Rate
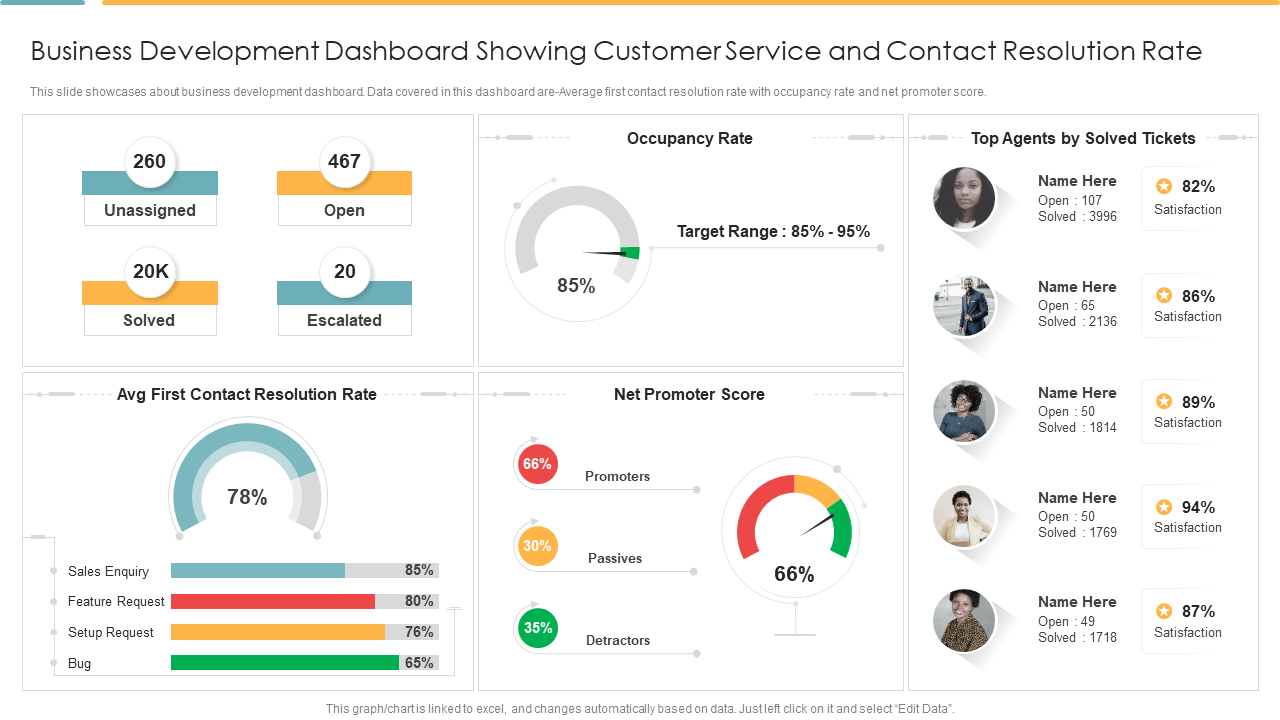
The quality of support provided by the service team determines the customer experience and business image in the market. Exceptional customer support is essential to increase your value and authority in the competitive marketplace constantly. This customer service dashboard template will help your team provide quality support to your loyal consumers. It has pre-designed columns for presenting data on ticket categories, occupancy rate, NPS, average first contact resolution rate, top agents, and more. Grab it today!
The Final Call
Customer Service Dashboards are the businesses’ tools to get a 360-degree view of consumer interactions. It helps businesses develop a system that attracts, acquires, and retains visitors and turns them into loyal customers and advocates.
Another reason to establish an interactive Customer Service Dashboard is to provide your support team with a tool that presents them with real-time data and helps them make informed decisions.
Our customer service dashboard templates are pocket-friendly, easy to use, and take less storage space. These are ideal for creating this monitoring tool that fetches your CRM and customer data into one place and creates valuable insights. These
Create a customer service dashboard today to set industry exceptional customer support and intelligence standards!
FAQs on Customer Service Dashboards
1. What should a customer dashboard include?
A customer service dashboard comprises the qualitative and quantitative metrics you want to monitor or focus on. You can consider adding any or all of these metrics to your dashboard:
1. Ticket volume: How many service requests/complaints are coming?
2. Tickets resolved/pending: Percentage/number of tickets resolved/pending in a day or over a period.
3. Tickets re-open/opening rate: Queries on which customers replied for follow-up.
4. First contact/call resolution: Percentage/number of queries answered in a satisfactory manner on first contact (irrespective of medium — call, message, chats, email, social media) or first call.
5. Average call time: Time taken on all calls/Number of calls taken by an individual — give his/her average call time.
6. Average hold time: Minutes/seconds to which calls were on hold.
7. Customer Retention rate: Percentage of old customers retained by customer service managers.
8. Net promoter score (NPS): Average score given by customers on a scale of 1 to 10 for the question “how much you like to recommend our brand to your friends and family.”
There are more than 20 metrics that can be part of your customer service dashboard. These are a few popular ones on that extensive list.
2. How do I make a customer dashboard?
.
A customer service dashboard contains collaborative data of your CRM tools. It is helpful for understanding and upgrading the level of the customer service process. A time-saving way to create an easy-to-manage and cost-efficient dashboard is using SlideTeam’s ready-to-use PowerPoint templates. Download these templates, customize them by adding required metrics, set them to work with the data platform, and use them to monitor the desired elements.
3. What are the three types of dashboards?
You can create various customer service dashboards based on the elements you want to monitor. All types of dashboards are majorly divided into three categories. These are:
- Operational dashboards: used to monitor the operations and functioning of organizations.
- Strategic dashboards: used to analyze strategy, its effectiveness, and industry trends.
- Analytical dashboards: Analysts use them to read and provide statistics, insights and data.
4. What makes a good executive dashboard?
An excellent executive dashboard must include key performance indicators (KPIs) and process elements useful for employees of every level — support agents, managers, C-suite executives, and stakeholders. The data a dashboard provides should be real-time (lag of 2-3 hours accepted) and easy to read for all.




 Customer Reviews



![Top 10 Customer Service Roadmap Templates with Samples and Examples [Free PDF Attached]](https://www.slideteam.net/wp/wp-content/uploads/2022/11/Customer-Service-Roadmap-Templates-1013x441.png)
![Top 10 Courses on Customer Service with Training Material Included [Free PDF Attached]](https://www.slideteam.net/wp/wp-content/uploads/2022/06/Top-10-Courses-on-Customer-Service-with-Training-Material-Included_1-1013x441.png)
![[Updated 2023] 30 Best Customer Service PowerPoint Templates For Success in Business](https://www.slideteam.net/wp/wp-content/uploads/2020/04/1013x441no-button-1013x441.jpg)
![Top 10 Customer Service Flowchart Templates To Optimize Your Support Operations [Free PDF Attached]](https://www.slideteam.net/wp/wp-content/uploads/2022/06/Top-10-Customer-Service-Flowchart-Templates-493x215.gif)
![[Updated 2023] Top 35 KPI-Dashboard Templates For Performance Tracking](https://www.slideteam.net/wp/wp-content/uploads/2020/11/size1001-436-3-335x146.jpg)
![Top 15 Operational Dashboard Templates to Capture Your Organizational Performance [Free PDF Attached]](https://www.slideteam.net/wp/wp-content/uploads/2022/04/banner-4-1013x441.png)
