

Quality control engineering powerpoint presentation slides




Try Before you Buy Download Free Sample Product
 Impress Your
 Audience
 100%
100% Editable
 Save Hours
 of Time


Quality control engineering is the field of engineering that deals with the identification and prevention of defects in manufactured products. Quality control engineers work to ensure that products meet or exceed the requirements of their customers or clients. Quality control engineers may work in a variety of industries, including automotive, aerospace, food and beverage, pharmaceuticals, and semiconductors.Quality control engineering is a critical process in ensuring that products are made to meet the required standards. The right tools and templates can help you streamline your quality assurance processes and improve your product quality. At SlideTeam, we’re committed to helping professionals like you succeed with our library of high-quality slide templates. Download our technology quality assurance ppt templates now and start putting these principles into practice for yourself. With the right tools in hand, you can confidently achieve success in your next quality control engineering project.
People who downloaded this PowerPoint presentation also viewed the following :
Content of this Powerpoint Presentation
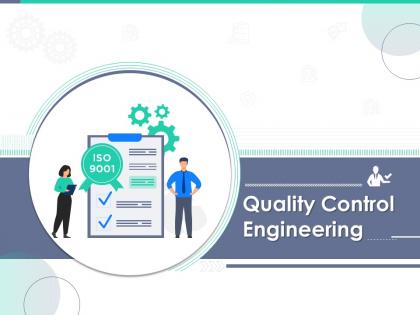
Slide 1: This slide introduces Quality Control Engineering. State Your Company Name and begin.
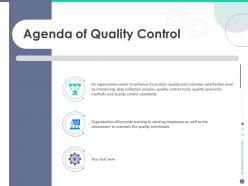
Slide 2: This slide shows Agenda of Quality Control.
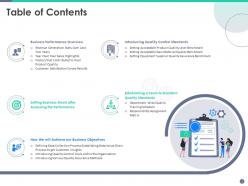
Slide 3: This slide presents Table of Content for the presentation.
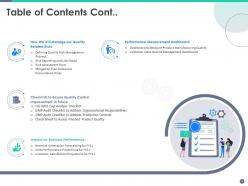
Slide 4: This is another slide continuing Table of Content for the presentation.
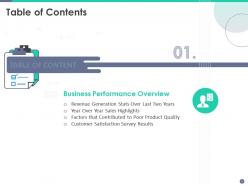
Slide 5: This slide displays Table of Content highlighting Business Performance Overview.
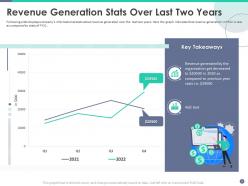
Slide 6: This slide represents Revenue Generation Stats Over Last Two Years.
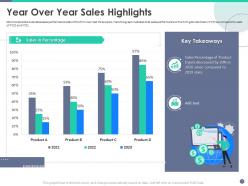
Slide 7: This slide shows sales performance stats of the firm over last three years.
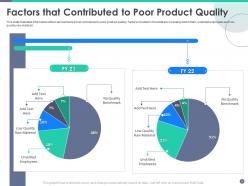
Slide 8: This slide illustrates information about various factors that contributed to poor product quality.
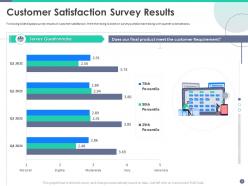
Slide 9: This slide shows survey results of customer satisfaction.
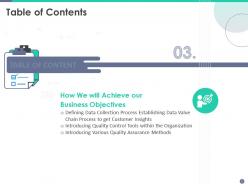
Slide 10: This slide displays Table of Content for the presentation.
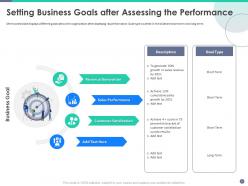
Slide 11: This slide represents Setting Business Goals after Assessing the Performance.
Slide 12: This slide shows Table of Content for the presentation.
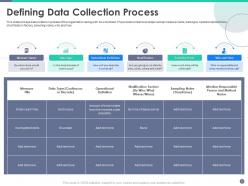
Slide 13: This slide portrays data collection process of the organization along with its worksheet.
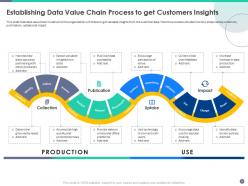
Slide 14: This slide shows Establishing Data Value Chain Process to get Customers Insights.
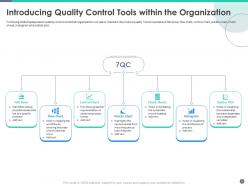
Slide 15: This slide displays seven quality control tools that organization will use to maintain its product quality.
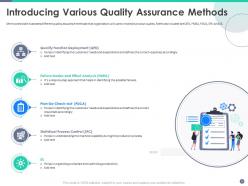
Slide 16: This slide represents different quality assurance methods that organization will use to maintain product quality.
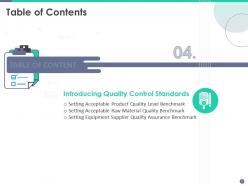
Slide 17: This slide shows Table of Content for the presentation.
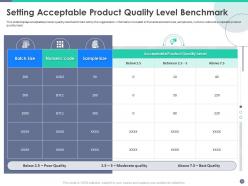
Slide 18: This slide presents acceptable product quality level benchmark set by the organization.
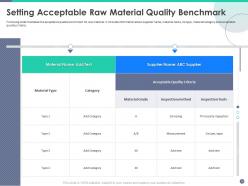
Slide 19: This slide shows Setting Acceptable Raw Material Quality Benchmark.
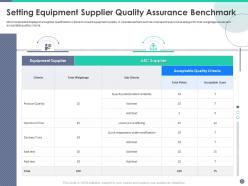
Slide 20: This slide displays the supplier qualification criteria to ensure equipment quality.
Slide 21: This slide represents Table of Content for the presentation.
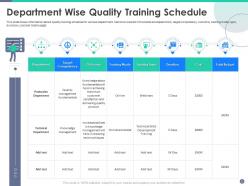
Slide 22: This slide shows information about quality training schedule for various department.
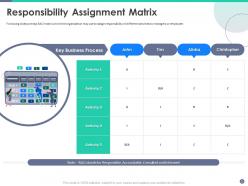
Slide 23: This slide presents RACI matrix which the organization may use to assign responsibility of different activities to managers or employee.
Slide 24: This slide shows Table of Content for the presentation.
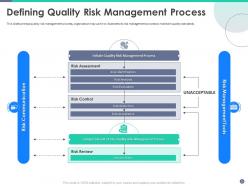
Slide 25: This slide portrays quality risk management process, organization may use it to illustrates its risk management process.
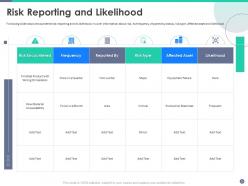
Slide 26: This slide represents risk reporting and its likelihood.
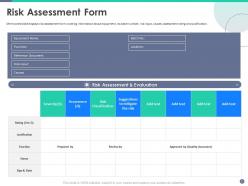
Slide 27: This slide shows risk assessment form covering information about equipment, its batch number, risk input, causes, assessment rating and justification.
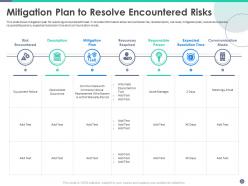
Slide 28: This slide presents mitigation plan for resolving encountered threat.
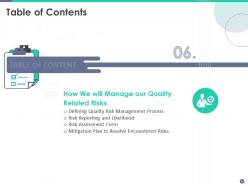
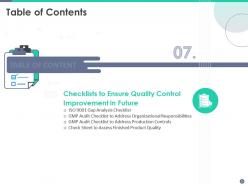
Slide 29: This slide shows Table of Content for the presentation.
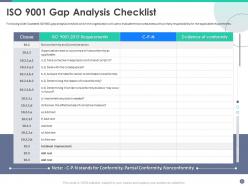
Slide 30: This slide displays gap analysis checklist which the organization will use to evaluate the process areas with primary responsibility for the applicable requirements.
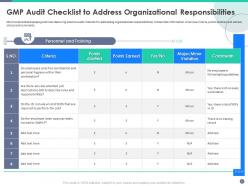
Slide 31: This slide represents GMP Audit Checklist to Address Organizational Responsibilities.
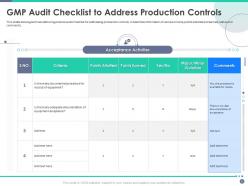
Slide 32: This slides shows good manufacturing practice audit checklist for addressing production controls.
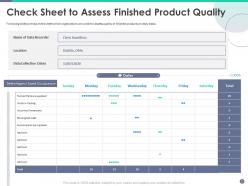
Slide 33: This slide presents Check Sheet to Assess Finished Product Quality.
Slide 34: This slide shows Table of Content for the presentation.
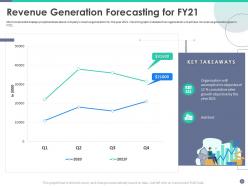
Slide 35: This slide displays projected stats about company’s revenue generation for the year 2021.
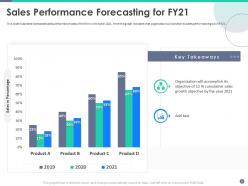
Slide 36: This slide illustrates forecasted sales performance stats of the firm in the year 2021.
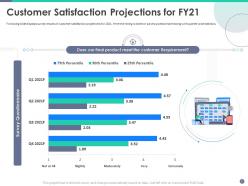
Slide 37: This slide displays survey results of customer satisfaction projections for 2021.
Slide 38: This slide presents Table of Content for the presentation.
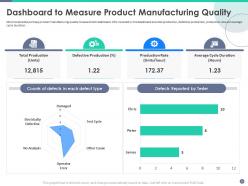
Slide 39: This slide shows product manufacturing quality measurement dashboard.
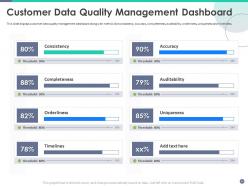
Slide 40: This slide displays customer data quality management dashboard along with metrics like consistency, accuracy, completeness, etc.
Slide 41: This slide represents Quality Control Engineering Icons.
Slide 42: This slide is titled as Additional Slides for moving forward.
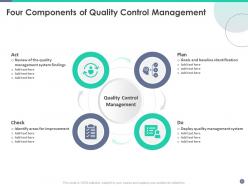
Slide 43: This slide presents Four Components of Quality Control Management.
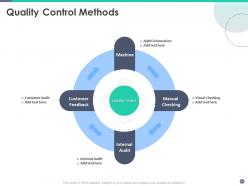
Slide 44: This slide shows Quality Control Methods describing- Quality Control, Visual Checking, Internal Audit, etc.
Slide 45: This is About Us slide to show company specifications etc.
Slide 46: This is Our Mission slide with related imagery and text.
Slide 47: This slide shows Post It Notes. Post your important notes here.
Slide 48: This slide presents Circular Diagram with additional textboxes.
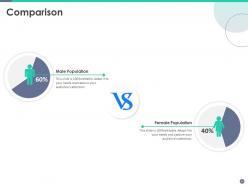
Slide 49: This is a Comparison slide to state comparison between commodities, entities etc.
Slide 50: This slide displays Puzzle with related icons and text.
Slide 51: This slide represents Mind Map with related imagery.
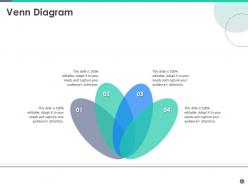
Slide 52: This slide shows Venn diagram with text boxes.
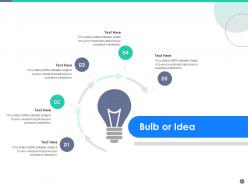
Slide 53: This is an Idea Generation slide to state a new idea or highlight information, specifications etc.
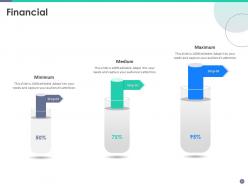
Slide 54: This is a Financial slide. Show your finance related stuff here.
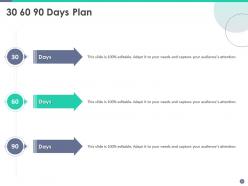
Slide 55: This slide displays 30 60 90 Days Plan with text boxes.
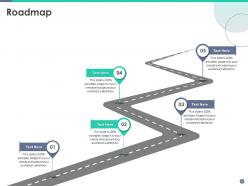
Slide 56: This slide represents Roadmap with additional textboxes.
Slide 57: This is a Thank You slide with address, contact numbers and email address.
Quality control engineering powerpoint presentation slides with all 57 slides:
Use our Quality Control Engineering Powerpoint Presentation Slides to effectively help you save your valuable time. They are readymade to fit into any presentation structure.

FAQs for Quality control engineering
Honestly, it's all about catching problems before they happen instead of playing whack-a-mole later. Way cheaper that route. Build quality right into your processes from day one. Document everything so you can actually repeat what works - I learned this the hard way at my last job. When something does go wrong, don't just slap a band-aid on it. Dig into the real cause. Statistical process control sounds boring but it's actually pretty useful for spotting when things start drifting off track. Map out your current workflow first and see where most defects happen. That's your goldmine right there.
Look, data collection is literally everything for QC - you can't fix what you can't see. Consistent measurements from inspections and tests help you catch problems before they blow up. Garbage in, garbage out, obviously. Your team needs solid collection methods they'll actually stick to (good luck with that part). Quality data lets you spot trends, predict when stuff's gonna fail, and back up your process changes when you're arguing with the boss. Oh, and definitely audit what you're collecting now - half of it's probably useless anyway.
Honestly, statistics are a game-changer for quality control. Control charts let you catch process drift way before it becomes a nightmare - they'll spot patterns you'd totally miss just eyeballing things. For sampling, you don't need to check every single part (thank god), just use statistical plans to hit the sweet spot. Root cause analysis gets so much faster with regression and hypothesis testing too. I'd start simple though - throw some SPC charts on your biggest headache processes first. Way better than the old "cross your fingers and hope" approach most places use.
So Six Sigma is this statistical approach for hunting down defects in processes - super useful in quality control. It follows this DMAIC thing (Define, Measure, Analyze, Improve, Control) to systematically fix quality problems. The target is 3.4 defects per million opportunities, which honestly sounds insane but actually works. Tools like control charts and root cause analysis become your daily bread and butter. Most QC engineers I've met swear by it. You should probably look into getting a Green Belt certification if you haven't already - makes a huge difference when you're troubleshooting quality issues.
Okay so first thing - grab your historical data from when everything was running smoothly and use that to set your baseline control limits. Then just plot your measurements over time and look for anything weird. Points outside the limits are obvious red flags, but also watch for trends or runs of data going the same direction. The real trick is getting everyone to actually stick with it (I swear, people love ignoring their own charts). Sample at regular intervals and when something looks off, jump on it right away. Don't be like my old team who'd collect tons of data then never act on it. Pick one critical parameter to start - you can always add more later once you've got the hang of it.
Dude, the main issues are teams being reactive instead of proactive, terrible documentation (or none at all), and zero consistency between departments. It's like playing whack-a-mole forever. What really gets me is how many places skip training people on QC procedures - I've seen this mess up entire projects. Fix it by creating clear SOPs that people actually use, not just file away. Do regular audits and cross-train your team so everyone's on the same page. Focus on preventing problems before they happen rather than catching them later. Oh, and track your prevention stats alongside defect rates.
Look, audits are basically your wake-up call - they show you where your actual processes differ from what you think you're doing. Yeah, they're annoying when you're swamped, but that's when you need them most honestly. You'll get real data on which problems keep showing up and what root causes you might've missed. The reports help you figure out what to tackle first instead of just winging it. I always tell people to track those findings over time - patterns emerge that you wouldn't notice day-to-day. Use them to prioritize your fixes by impact.
Look, ISO standards are basically your cheat sheet for quality control that actually works worldwide. Think ISO 9001 - it gives you frameworks that don't suck and saves you from figuring everything out yourself. You'll get systematic processes, proper documentation, plus that continuous improvement thing clients love. Honestly, the certification alone opens doors with picky clients who won't work with you otherwise. My old boss was obsessed with this stuff but he wasn't wrong - it really does give you credibility during audits. Just figure out which standards fit your industry first, then build your QC around those.
So instead of just fixing the same issues repeatedly, root cause analysis actually helps you find what's really causing problems. Use tools like 5 Whys or fishbone diagrams to trace defects back to their source. Way more effective than constantly putting out fires, trust me. Could be a process gap, broken equipment, or people need better training - but once you nail down the real issue, you can fix it for good. I'd start with whatever's happening most often and see how those fixes affect your quality numbers overall.
Honestly, AI is changing the game for quality control in some pretty wild ways. Computer vision can catch defects way faster than humans - I've seen it work and it's actually impressive. IoT sensors track everything in real-time across your production line. You can even use predictive analytics to spot problems before they blow up, which is huge for preventing costly mistakes. Digital twins let you test stuff virtually first. The statistical software has gotten crazy sophisticated too, and some companies are doing blockchain for supply chain tracking (though that feels a bit much to me). I'd say start with whatever's giving you the biggest headache and try one solution there.
So here's the thing - QC and risk management are basically joined at the hip. Every time you run FMEA analysis or check your control charts, you're really just asking "what's gonna break and how do I stop it?" I mean, your inspection protocols are literally risk prevention tools. The smart move is prioritizing which quality issues actually matter based on impact and probability. Like, don't waste time fixing tiny problems that won't hurt anything. Focus your QC budget on the stuff that'll actually save your butt if it goes sideways.
Look, supplier quality management is about catching problems before they hit your door instead of dealing with them later. Set clear standards upfront and audit your suppliers regularly - it's way cheaper than fixing stuff after the fact. Think of it like quality checkpoints throughout your supply chain. Your rework costs drop, products stay consistent, and honestly? Your supplier relationships get better too since you're working together on improvements. I'd start by figuring out which suppliers are most critical, then create scorecards to track how they're performing. Way less headache in the long run.
QC training is huge because you're basically the final checkpoint before stuff hits customers. Your team has to keep up with new standards and testing methods - regulations change constantly. Plus QC work gets mind-numbing, and people make mistakes when they're bored out of their minds. Cross-training saves your butt when someone calls in sick during crunch time. Fresh skills sessions keep everyone engaged. Don't skip the monthly refreshers or rotate duties around. Trust me, it's way cheaper than dealing with recalls later.
Look at support tickets and surveys to spot patterns in complaints - that's where the gold is. Most companies think they know what customers want but they're usually wrong. Sort feedback into categories so you can track trends over time. Fix the stuff that comes up most often first, obviously. But here's the thing people miss - you gotta circle back to customers after making changes. Let them know you actually listened. I've seen this turn angry customers into super loyal ones. The whole point is finding that gap between what you deliver and what people actually experience.
Track both your leading and lagging indicators to get the full picture. Defect rates, first-pass yield, and cost of poor quality are the basics. Customer complaint trends too - that one's obvious but people forget. Detection vs prevention costs is honestly my favorite metric because it shows exactly where you're wasting energy. Also watch cycle times for corrective actions, audit scores, and how your suppliers are performing. The key is mixing real-time process stuff with actual outcomes. Start with maybe 3-4 metrics that connect to your business goals, then add more once you've got decent data flowing.
-
Informative design.
-
Unique and attractive product design.
-
Graphics are very appealing to eyes.
-
Great experience, I would definitely use your services further.
-
Helpful product design for delivering presentation.
-
Very unique and reliable designs.
-
Innovative and attractive designs.
-
Easily Understandable slides.
-
Appreciate the research and its presentable format.