


Quality Management System Powerpoint Presentation Slide
Quality management systems are required in all areas of business activity, regardless of the size of the institution. Keeping this in mind our quality management system PPT slideshow has been crafted consisting of various Quality Management templates and can be customized as per your business requirements as the slides are fully editable. Using this quality management PowerPoint deck can be helpful for all your marketing and business-related presentations and can help in attracting the attention of your audience. Quality management systems provide a structure for doing things properly, efficiently and effectively. They aid both short- and long-term strategies to help a business run smoothly, whatever the size of the business. By incorporating our quality management system presentation template, you can review the operations, products and services of a business - with the objective to identify areas that may require quality improvement. Download the fruitful template now. To improve the business visibility and growth rate, describe your business quality management system with a professional theme with our privileged PPT design on quality management system PowerPoint Presentation slides. Using this PPT ensure that the quality structure of your business will be effectively analyzed and evaluated with them. With this informational quality management Presentation design, you can define its relevance, structure and the effectiveness of the same in the business framework. It will help your organization management to add the elements of improvement in the quality process. This quality management PPT layout can also be used for illustrating other essential business concepts like sales quality analysis, production quality analysis’s and many more. Further this PPT diagram represents various elements of TQM system for better understanding. Thus, download our ready-to-use quality management PowerPoint slideshow and check on the quality of the products and services with our PowerPoint slide. Emerge as the epicenter with our Quality Management System Powerpoint Presentation Slide. Be considered the hub of growth generating ideas.
Quality management systems are required in all areas of business activity, regardless of the size of the institution. Keep..

































-

- Google Slides is a new FREE Presentation software from Google.
- All our content is 100% compatible with Google Slides.
- Just download our designs, and upload them to Google Slides and they will work automatically.
- Amaze your audience with SlideTeam and Google Slides.
-

Want Changes to This PPT Slide? Check out our Presentation Design Services
-

- WideScreen Aspect ratio is becoming a very popular format. When you download this product, the downloaded ZIP will contain this product in both standard and widescreen format.
-

- Some older products that we have may only be in standard format, but they can easily be converted to widescreen.
- To do this, please open the SlideTeam product in Powerpoint, and go to
- Design ( On the top bar) -> Page Setup -> and select "On-screen Show (16:9)” in the drop down for "Slides Sized for".
- The slide or theme will change to widescreen, and all graphics will adjust automatically. You can similarly convert our content to any other desired screen aspect ratio.
Compatible With Google Slides

Get This In WideScreen
You must be logged in to download this presentation.


Do you want to remove this product from your favourites?
PowerPoint presentation slides
Presenting quality management system PPT template. The presentation is consisting of 72 slide designs. Convertible into numerous format options like JPEG, JPG or PDF. Provides a professional outlook to your PowerPoint presentation. Customization of each PowerPoint graphic and text according to your desire and want. Multiple display option such as Standard and Widescreen view. Freedom to customize it with company name and logo. Beneficial for business professionals, students, teachers, business analysts and strategists. Compatible with Google slides as well.

People who downloaded this PowerPoint presentation also viewed the following :
Content of this Powerpoint Presentation
Slide 1: This slide introduces Quality Management System . State Your Company Name and begin.
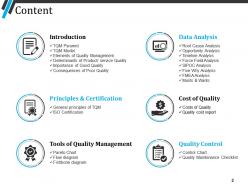
Slide 2: This slide showcases Content with these points- Introduction, Principles & Certification, Tools of Quality Management, Data Analysis, Quality Control, Cost of Quality.
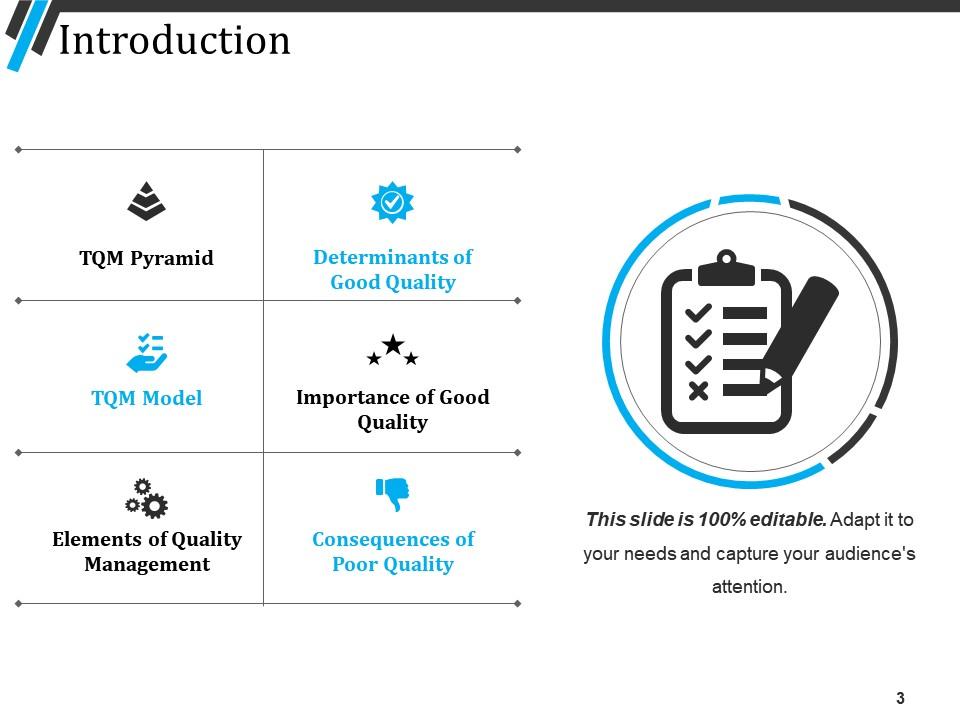
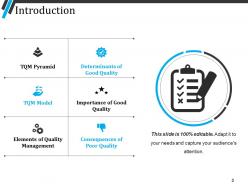
Slide 3: This slide presents Introduction with these following parameters- TQM Pyramid, TQM Model, Elements of Quality Management, Determinants of Good Quality, Importance of Good Quality, Consequences of Poor Quality.
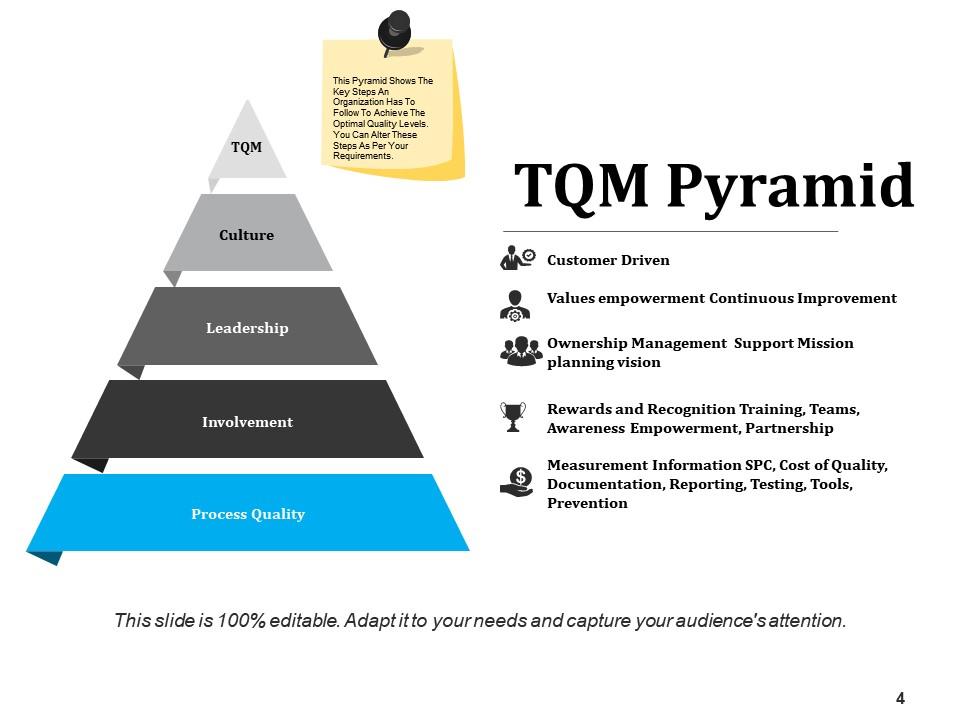
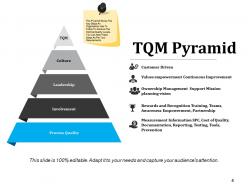
Slide 4: This slide presents TQM Pyramid . This pyramid shows the key steps an organization has to follow to achieve the optimal quality levels. You can alter these steps as per your requirements.
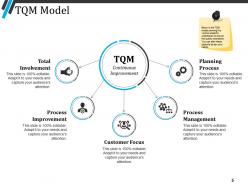
Slide 5: This slide showcases TQM Model with these six parameters- Customer Focus, Planning Process, Process Management, Total Involvement, Process Improvement, TQM, Continuous Improvement, TQM model showing the various aspects undertaken to ensure the quality standards. You can alter these aspects as per your needs.
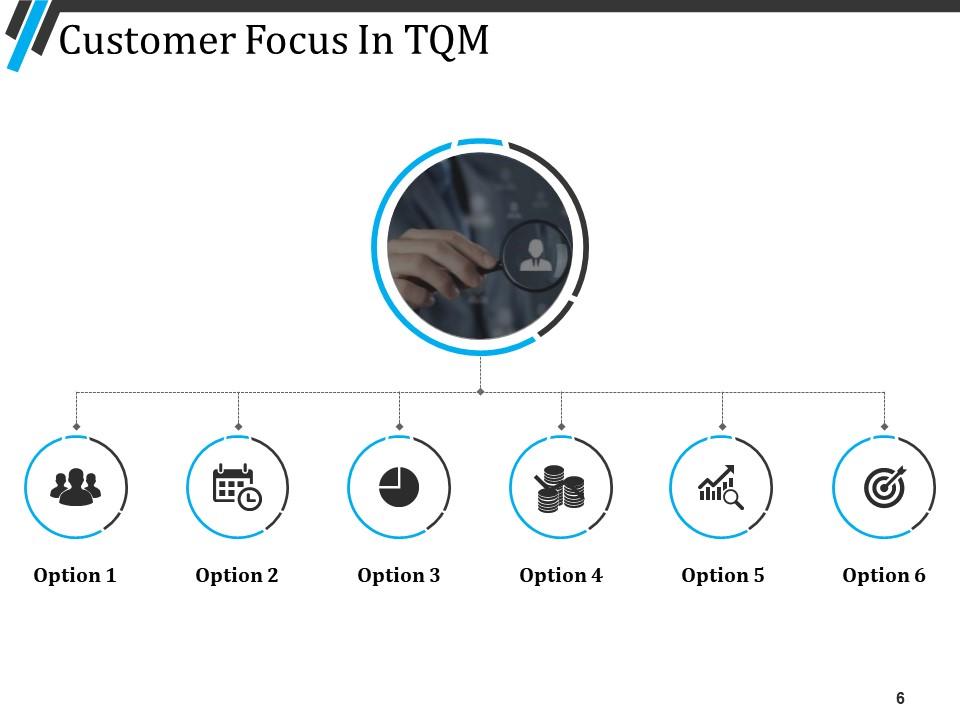
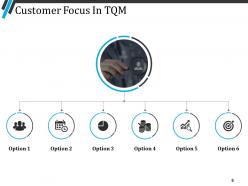
Slide 6: This slide presents Customer Focus in TQM. You can add your options and use as per requirement.
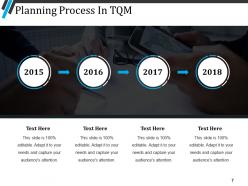
Slide 7: This slide showcases Planning Process in TQM. You can use it with as we have added years in it.
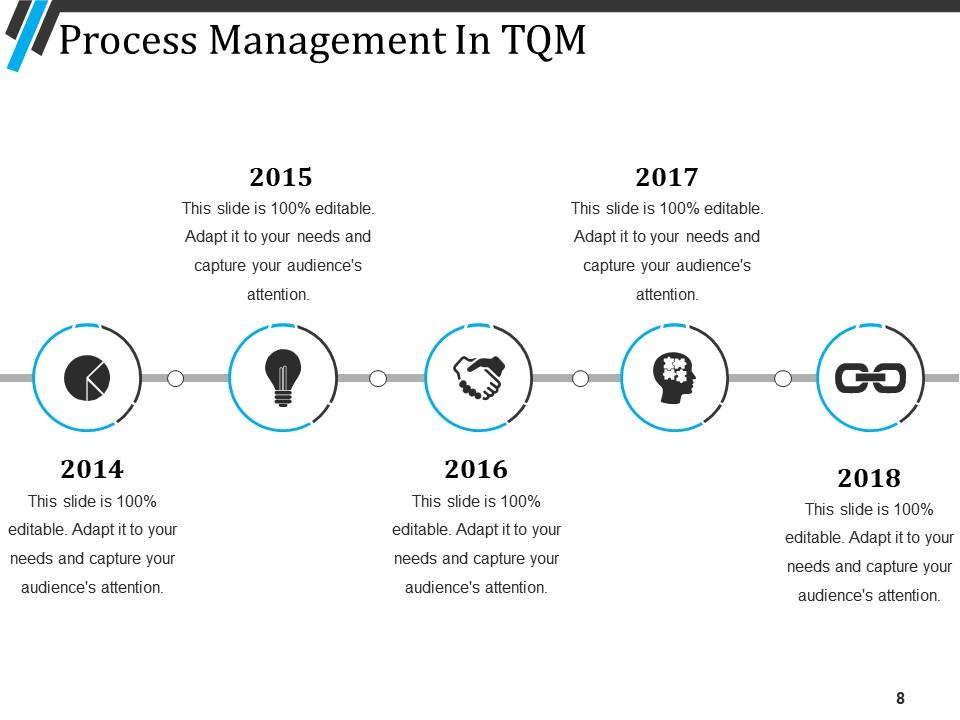
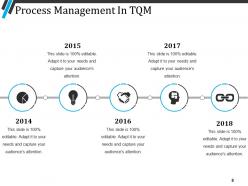
Slide 8: This slide diplays Process Management in TQM. Add the content with five yearly variations.
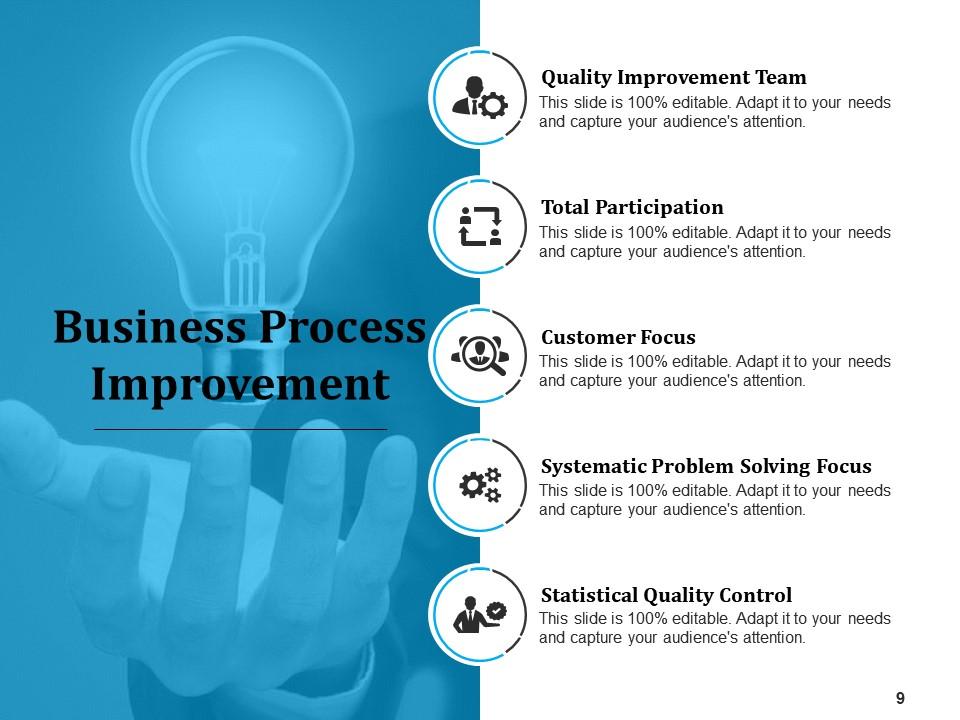
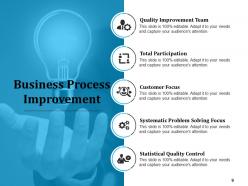
Slide 9: This slide shows Business Process Improvement with these steps to use- Quality Improvement Team, Total Participation, Systematic Problem Solving Focus, Statistical Quality Control, Customer Focus.
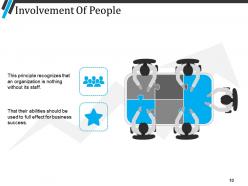
Slide 10: This slide includes Involvement of People and mentioned these two main points- This principle recognizes that an organization is nothing without its staff, That their abilities should be used to full effect for business success.
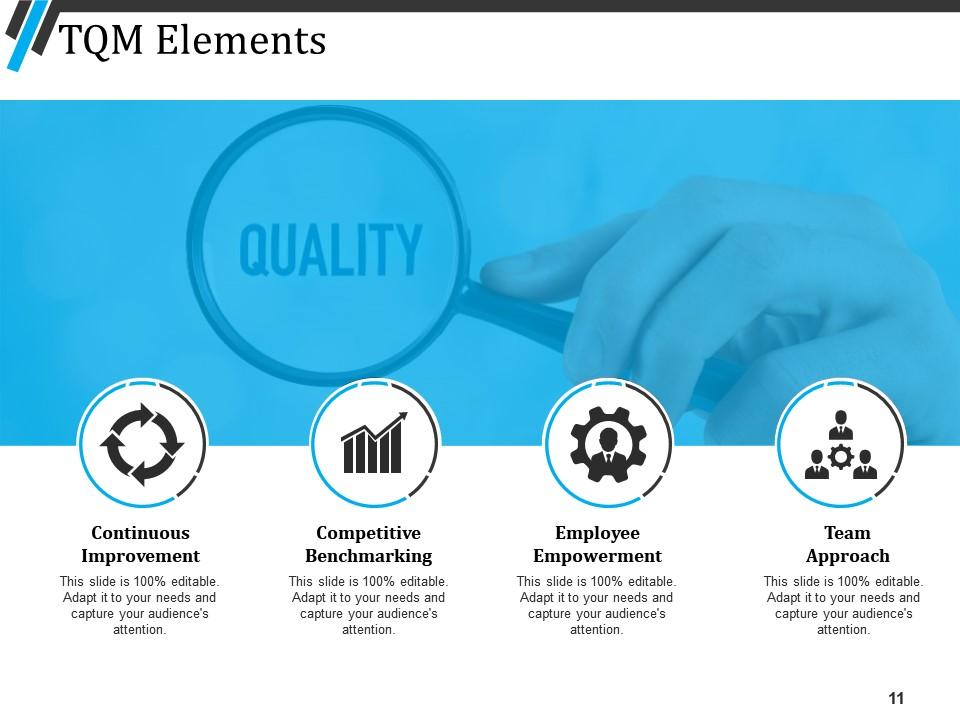
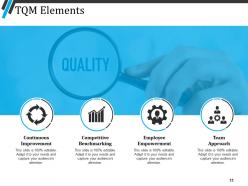
Slide 11: This slide showcases TQM Elements with four elements- Continuous Improvement, Competitive Benchmarking, Employee Empowerment, Team Approach.
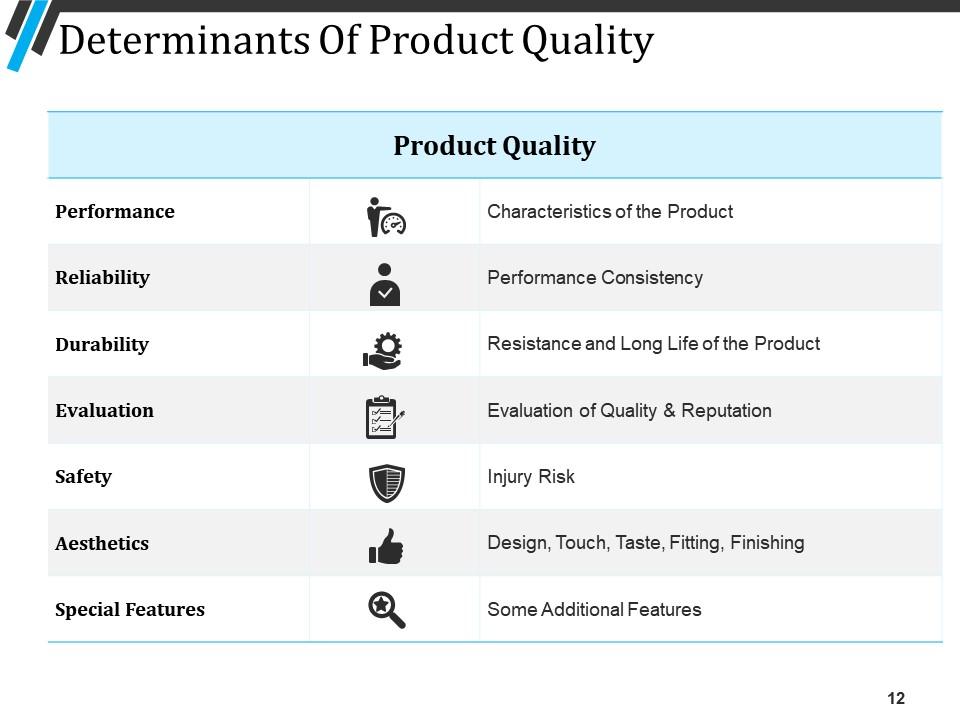
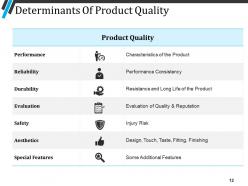
Slide 12: This slide shows Determinants of Product Quality with these factors- Performance, Reliability, Durability, Evaluation, Safety, Aesthetics, Special Features, Product Quality.
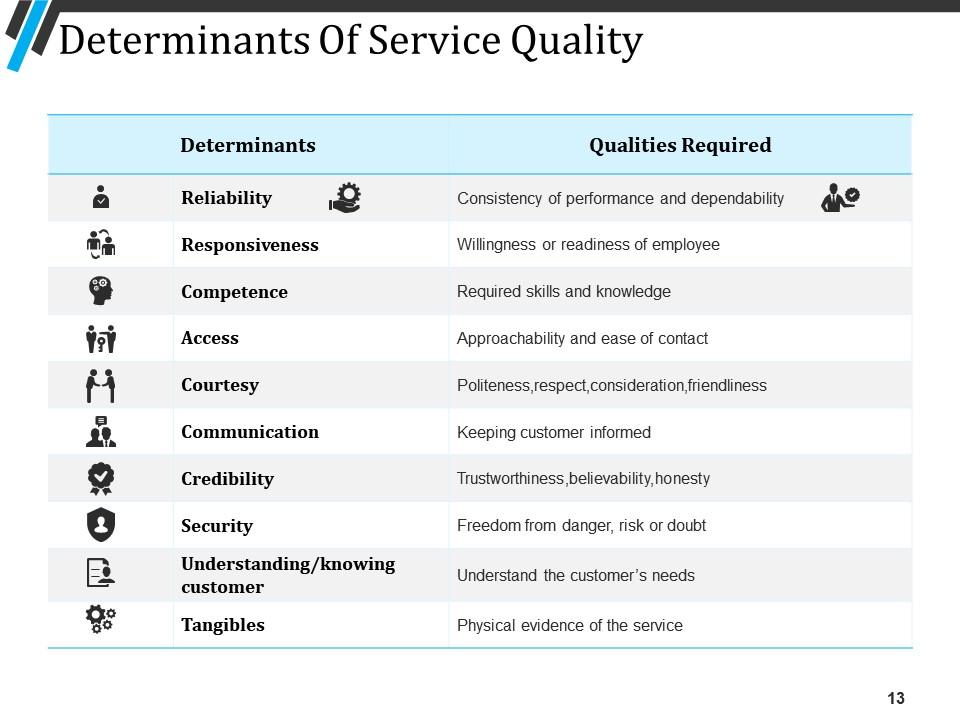
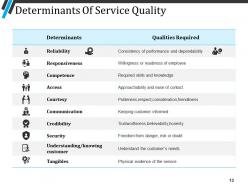
Slide 13: This slide showcases Determinants of Service Quality with these two points to consider- Determinants, Qualities Required.
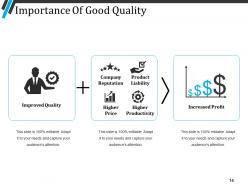
Slide 14: This slide presents Importance of Good Quality with these factors- Improved Quality, Product Liability, Company Reputation, Higher Productivity, Higher Price, Increased profit.
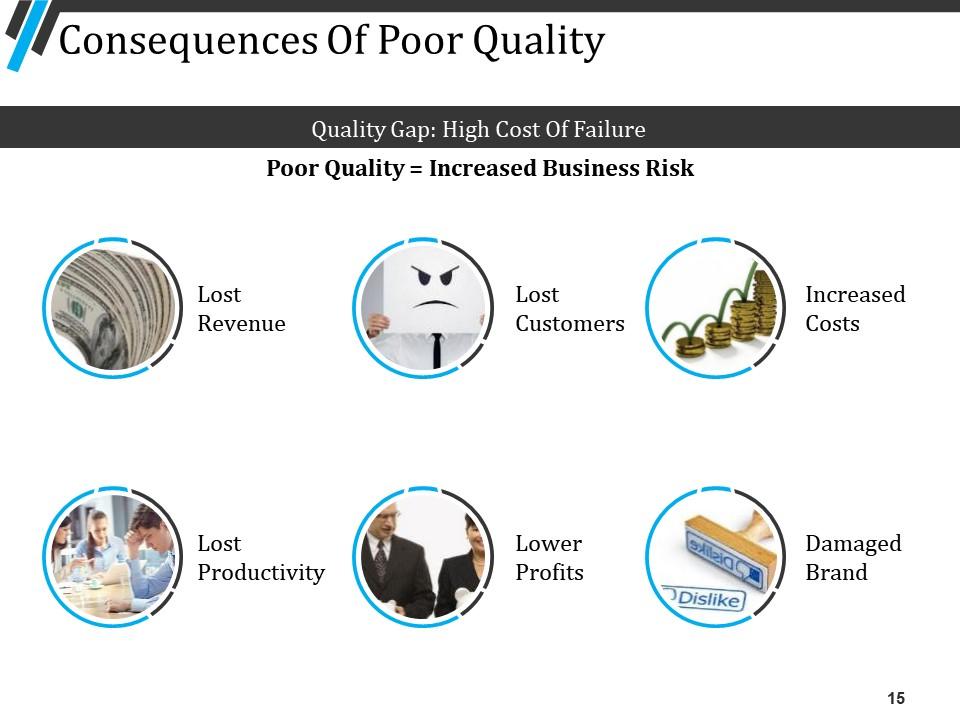
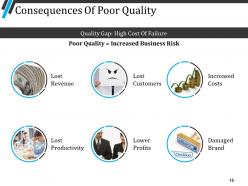
Slide 15: This slide displays Consequences of Poor Quality with these six elements- Lost Revenue, Lost Customers, Increased Costs, Lost Productivity, Lower Profits, Damaged Brand.
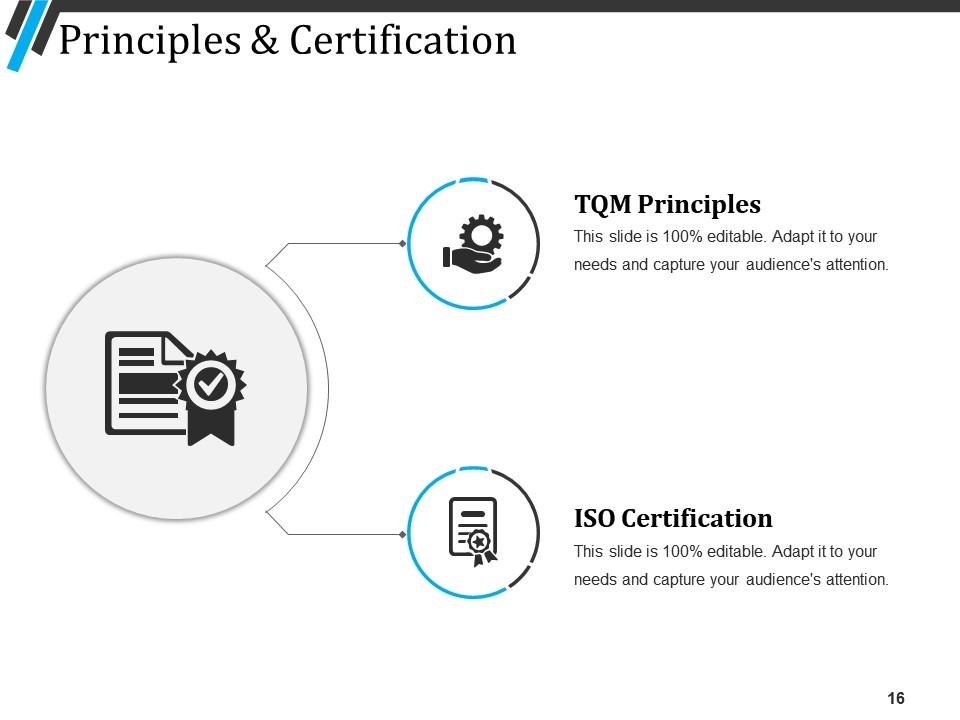
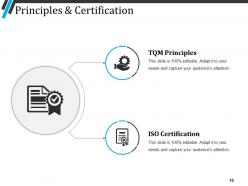
Slide 16: This slide shows Principles & Certification with these two factors- TQM Principles, ISO Certification.
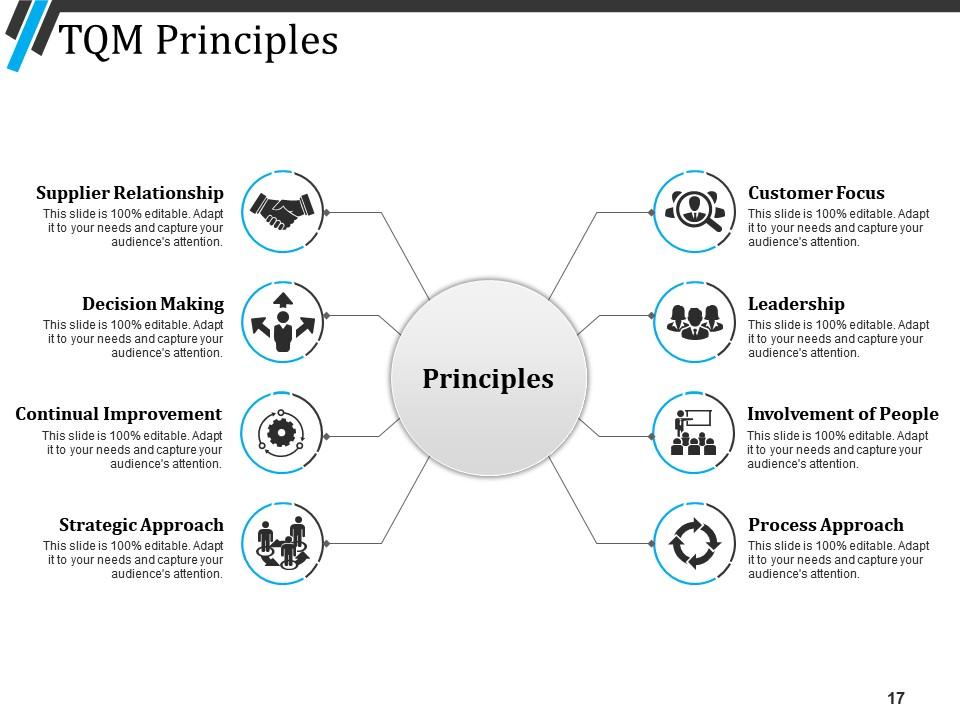
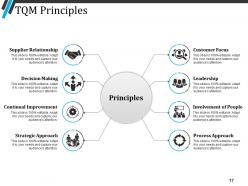
Slide 17: This slide presents TQM Principles with these features you can use- Principles & certifications, Customer Focus, Leadership, Involvement of People, Process Approach, Strategic Approach, Continual Improvement, Decision Making, Supplier Relationship.
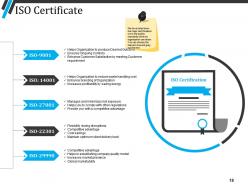
Slide 18: This slide shows ISO Certifications. We have listed down the major certifications wrt to the quality standards which an organization can attain. You can choose the relevant one and grey out the rest.
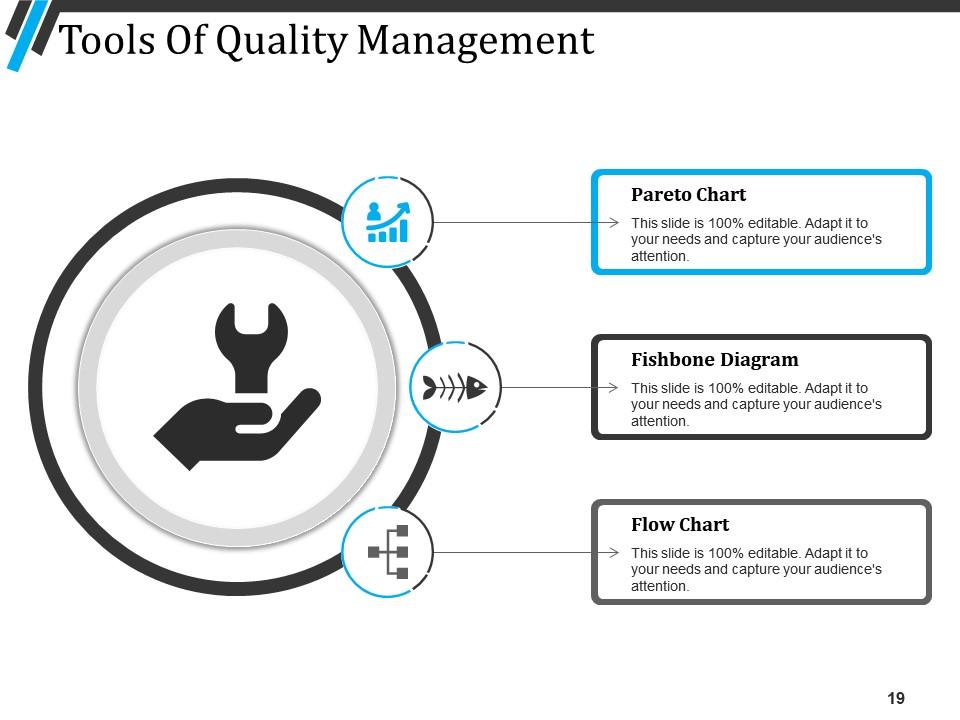
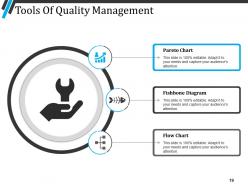
Slide 19: This slide displays Tools of Quality Management with these three parameters- Pareto Chart, Fishbone Diagram, Flow Chart.
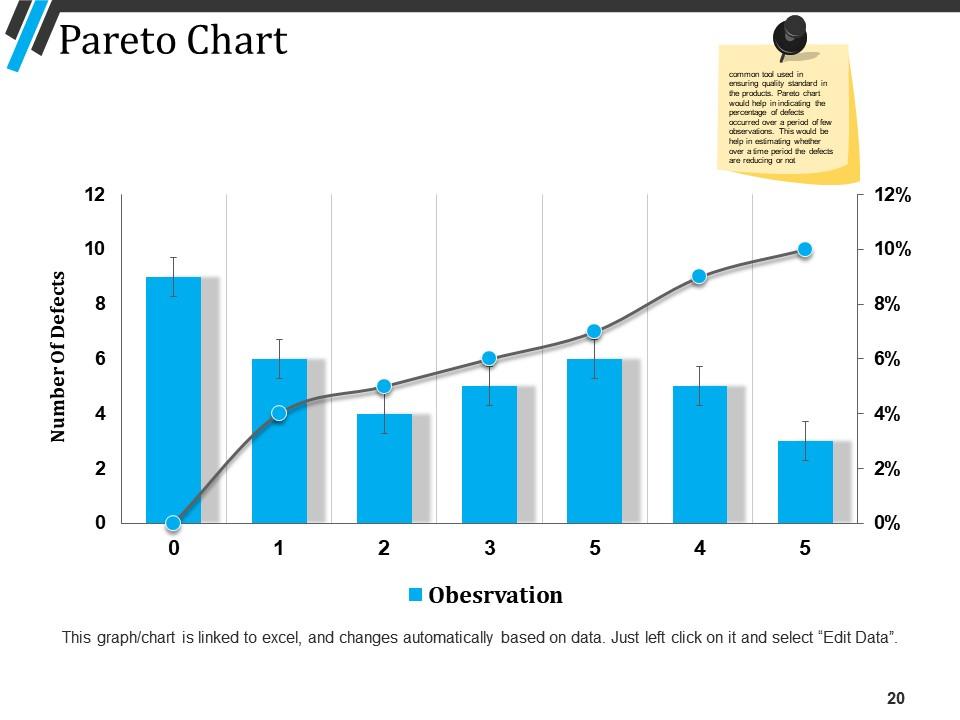
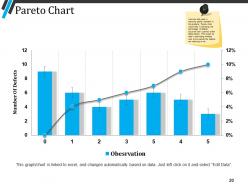
Slide 20: This slide showcases Pareto Chart with Number of defects and observation. This is one of the most common tool used in ensuring quality standard in the products. Pareto chart would help in indicating the percentage of defects occurred over a period of few observations. This would be help in estimating whether over a time period the defects are reducing or not.
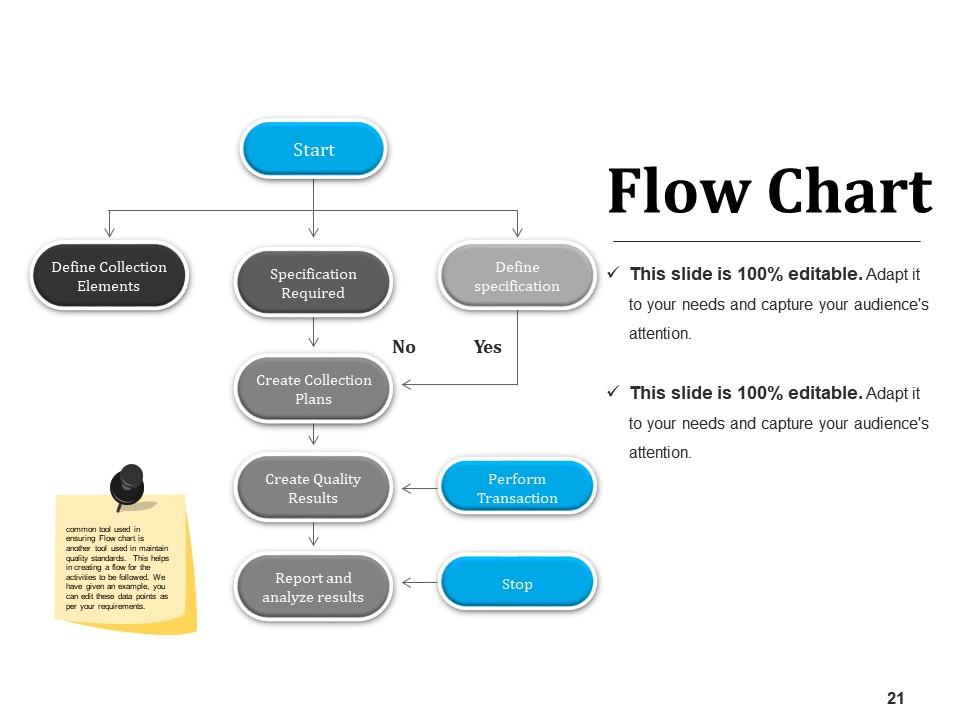
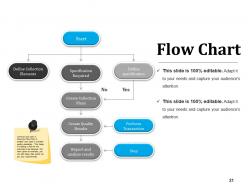
Slide 21: This slide presents Flow Chart. Flow chart is another tool used in maintain quality standards. This helps in creating a flow for the activities to be followed. We have given an example, you can edit these data points as per your requirements.
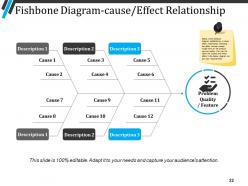
Slide 22: This slide showcases Fishbone Diagram- Cause/ Effect Relationship. This is the fishbone diagram establishing a cause effect relationship indicating the effect various causes might have on the product/ service quality. You can list down the causes and there effect in the below diagram as per your requirements.
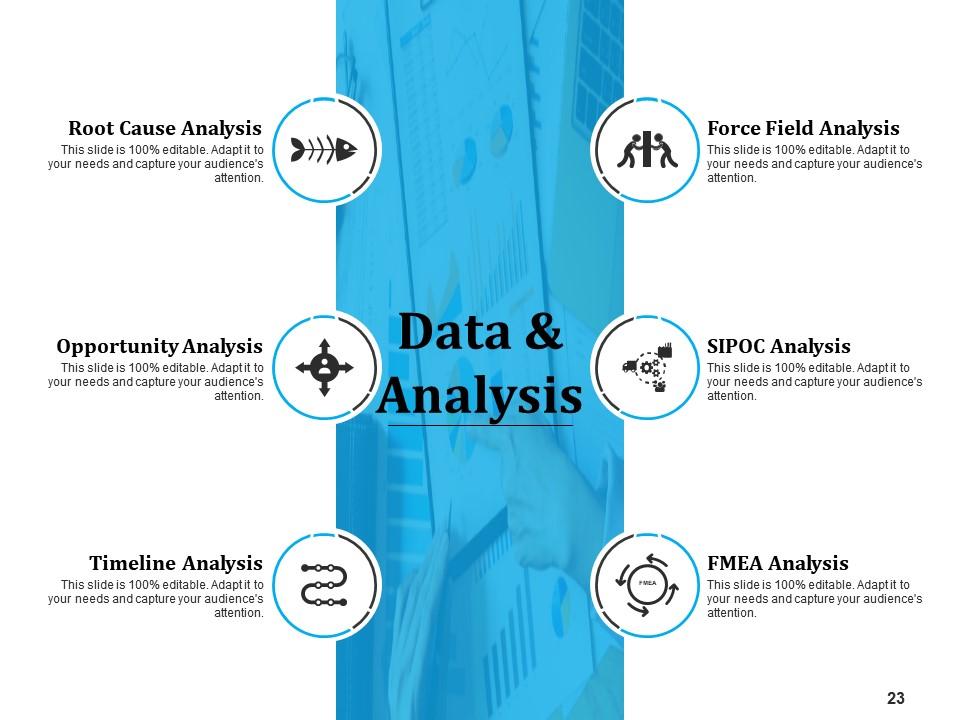
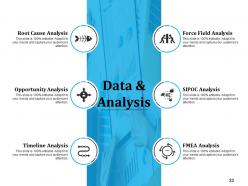
Slide 23: This slide Data & Analysis with the data we have presented- Root Cause Analysis, Opportunity Analysis, Timeline Analysis, Force Field Analysis, FMEA Analysis, SIPOC Analysis.
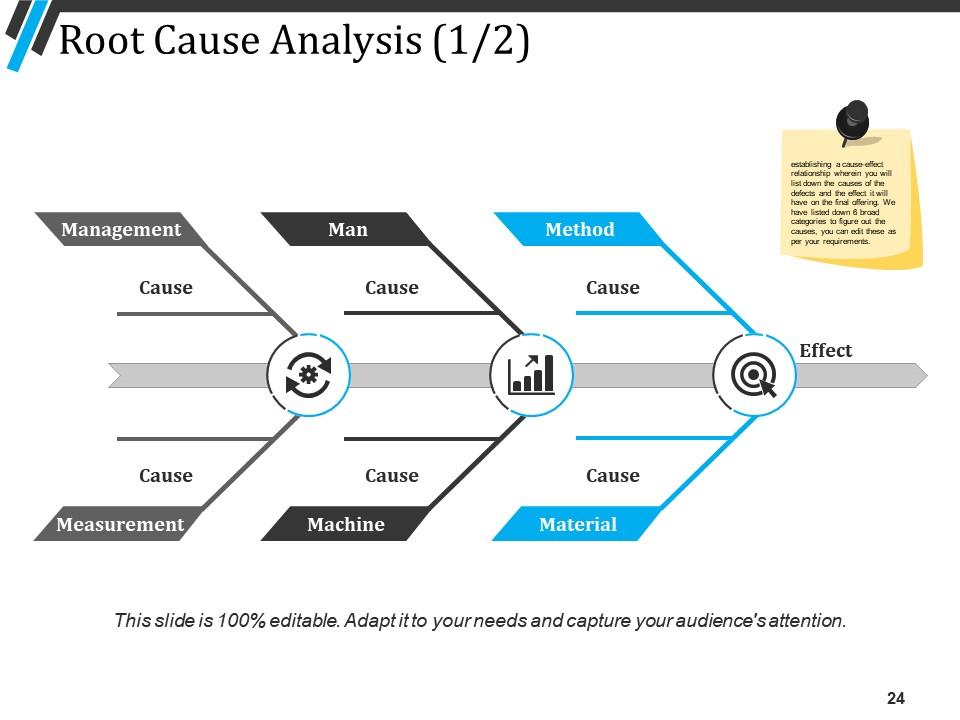
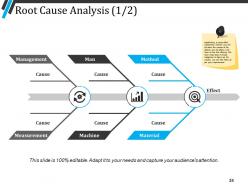
Slide 24: This slide presents Root Cause Analysis. This analysis helps in establishing a cause-effect relationship wherein you will list down the causes of the defects and the effect it will have on the final offering. We have listed down 6 broad categories to figure out the causes, you can edit these as per your requirements.
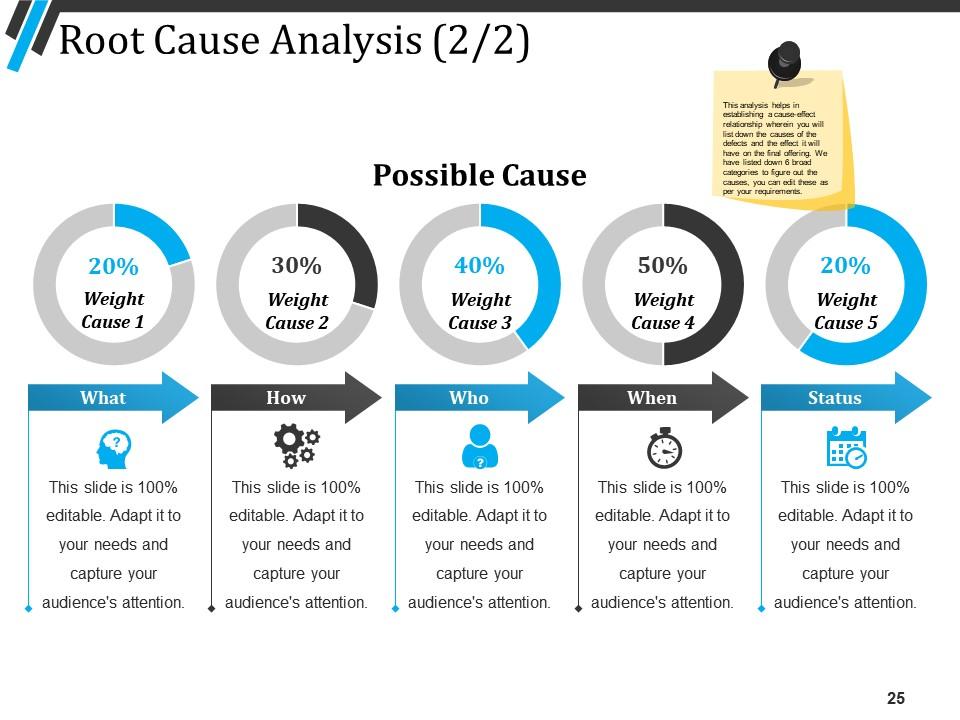
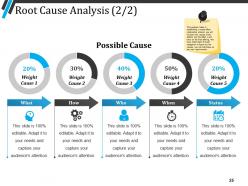
Slide 25: This slide showcases Root Cause Analysis. List down the various causes of problem and their weightage in the table below. Also mention in detail the causes and their present status.
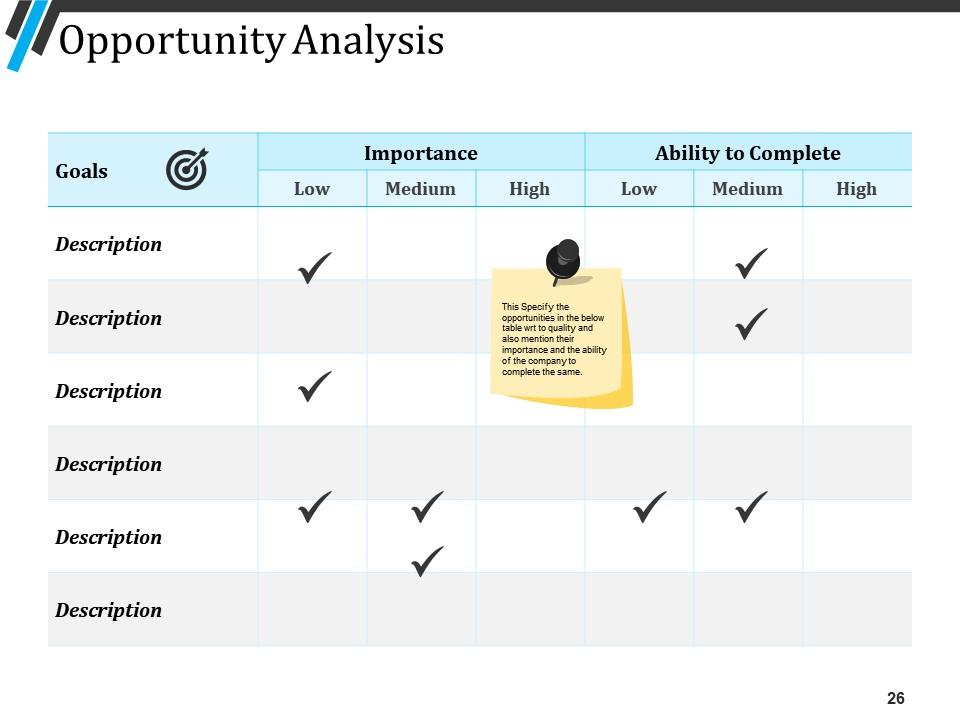
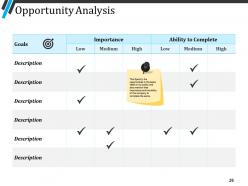
Slide 26: This slide presents Opportunity Analysis. Specify the opportunities in the below table wrt to quality and also mention their importance and the ability of the company to complete the same.
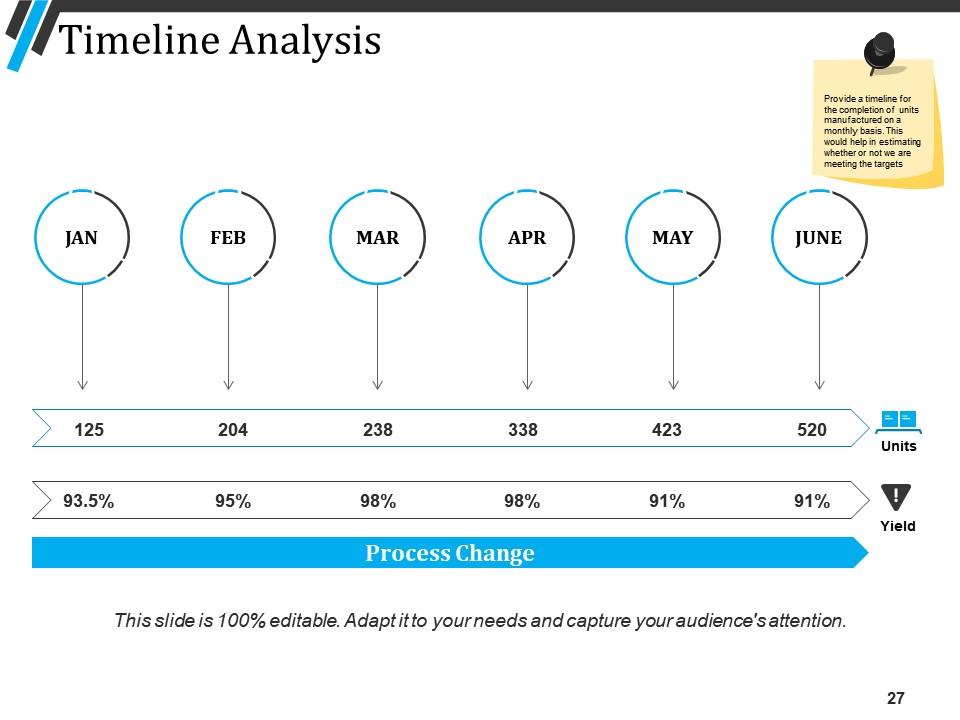
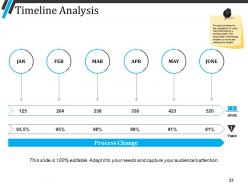
Slide 27: This slide displays Timeline Analysis. Provide a timeline for the completion of units manufactured on a monthly basis. This would help in estimating whether or not we are meeting the targets.
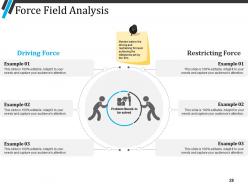
Slide 28: This slide showcases Force Field Analysis. Mention below the driving and restraining forces in achieving the milestones set by the firm.
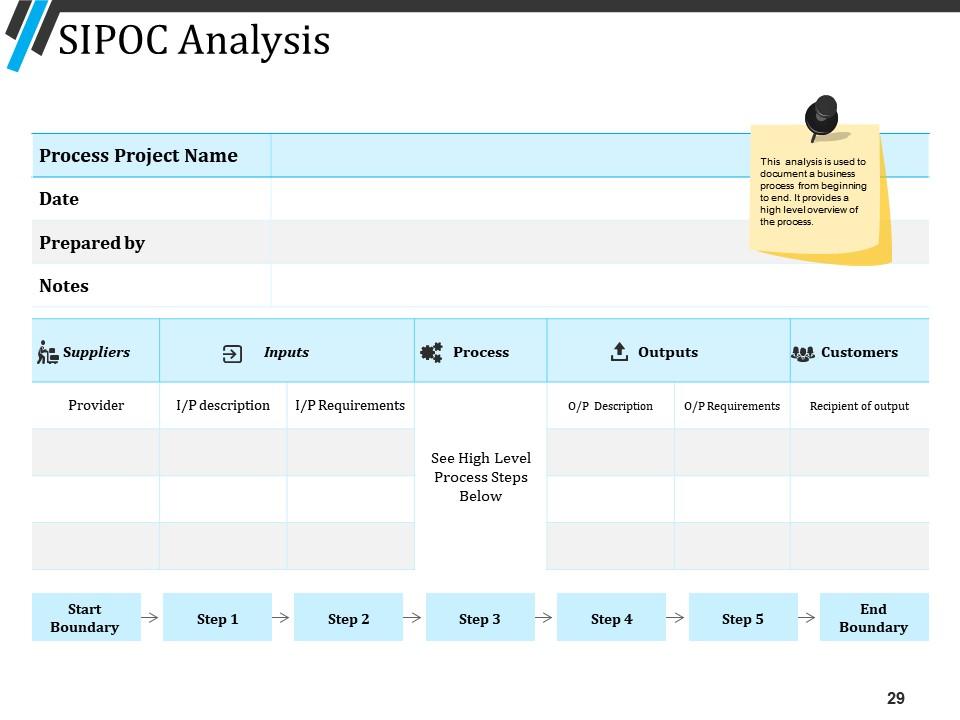
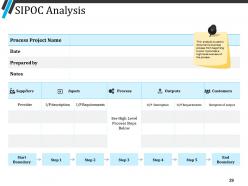
Slide 29: This slide showcases SIPOC Analysis. This analysis is used to document a business process from beginning to end. It provides a high level overview of the process.
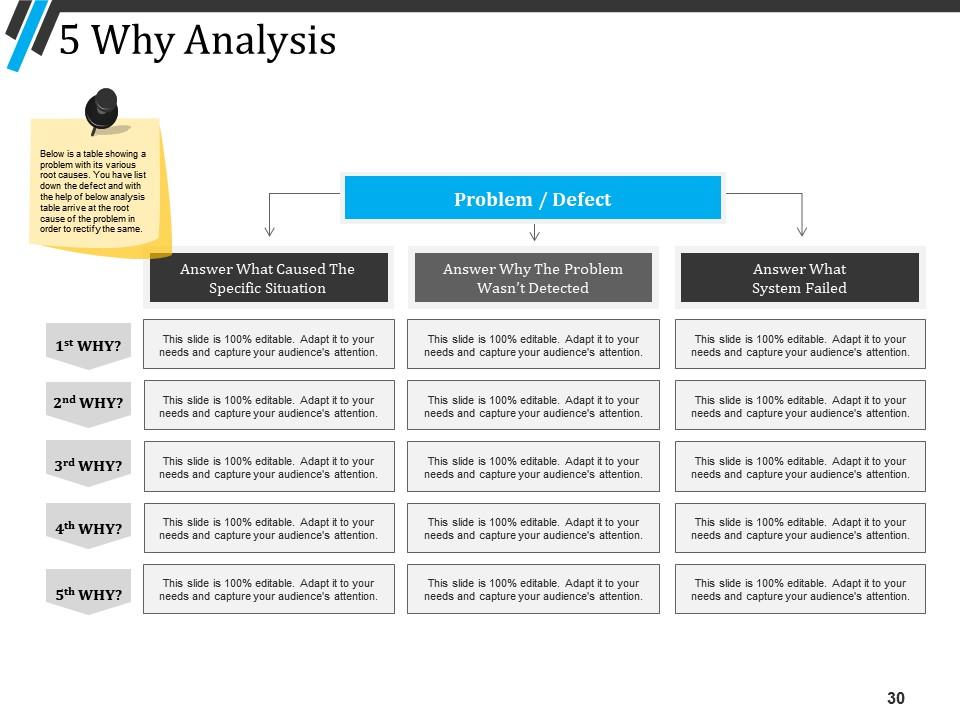
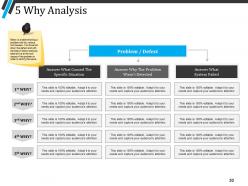
Slide 30: This slide shows 5 Why Analysis. This is a table showing a problem with its various root causes. You have list down the defect and with the help of below analysis table arrive at the root cause of the problem in order to rectify the same.
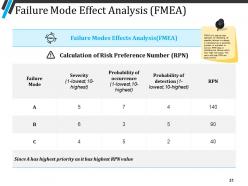
Slide 31: This slide presents Failure Mode Effect Analysis (FMEA). approach for identifying all possible failures in a design, a manufacturing or assembly process, or a product or service. RPN helps in indicating the failures which have high risk impact. The one’s with high RPN are given priority.
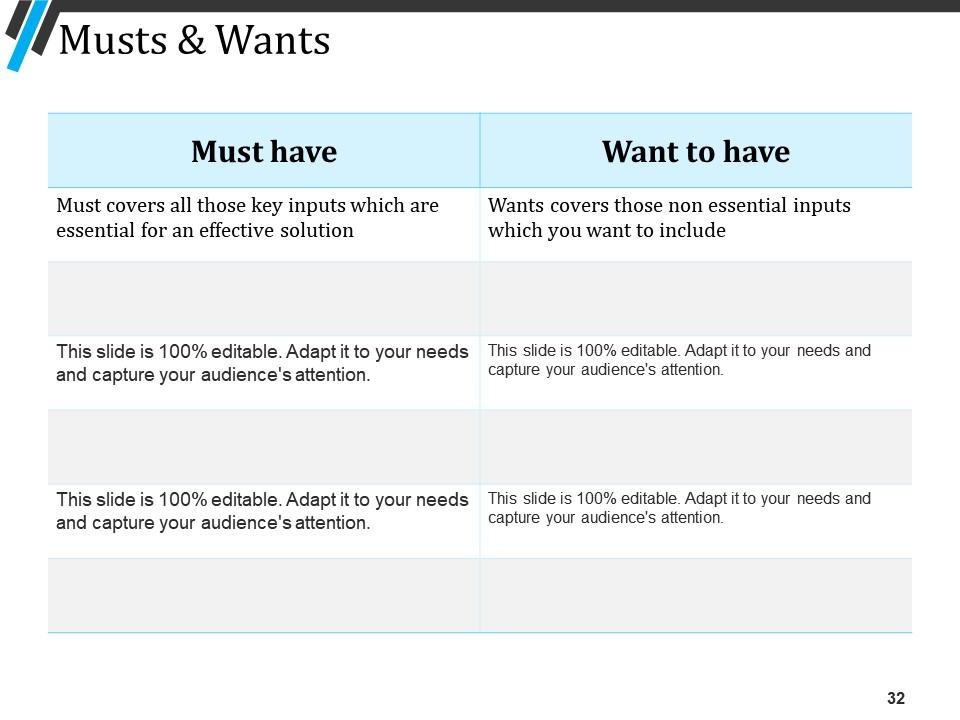
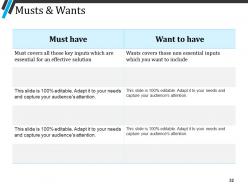
Slide 32: This slide shows Musts & Wants. You can add the data in this as your requirement.
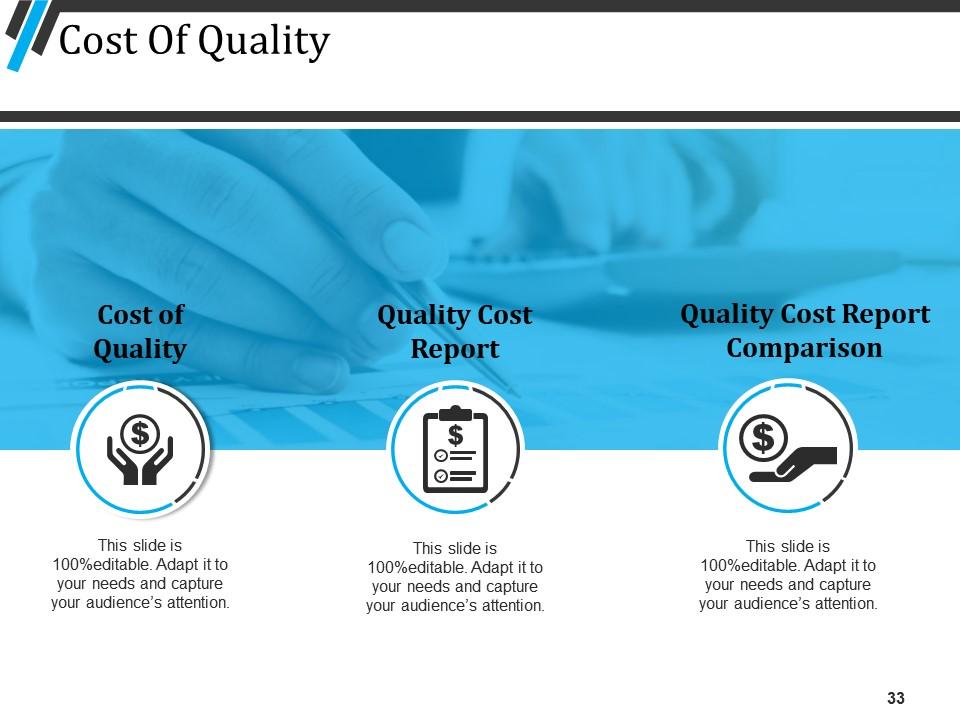
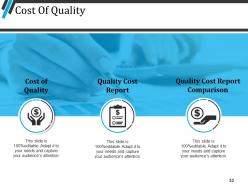
Slide 33: This slide displays Cost of Quality with these three factors- Quality Cost Report, Cost of Quality, Quality Cost Report Comparison.
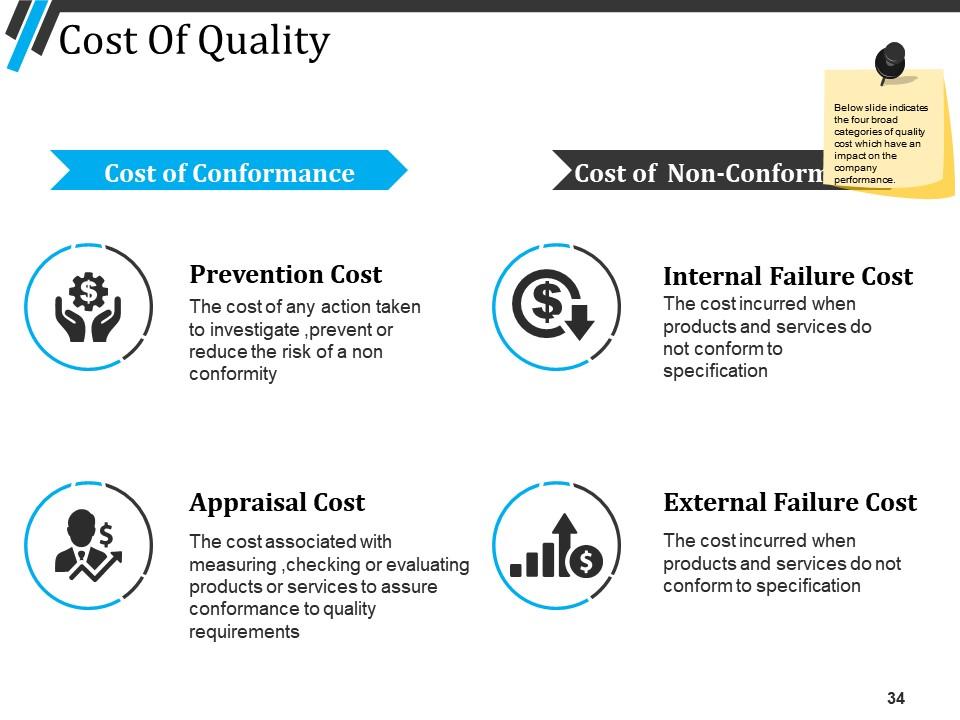
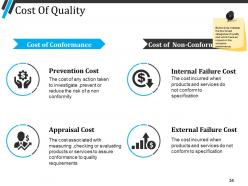
Slide 34: This slide presents Cost of Quality. We have listed in slide indicates the four broad categories of quality cost which have an impact on the company performance.
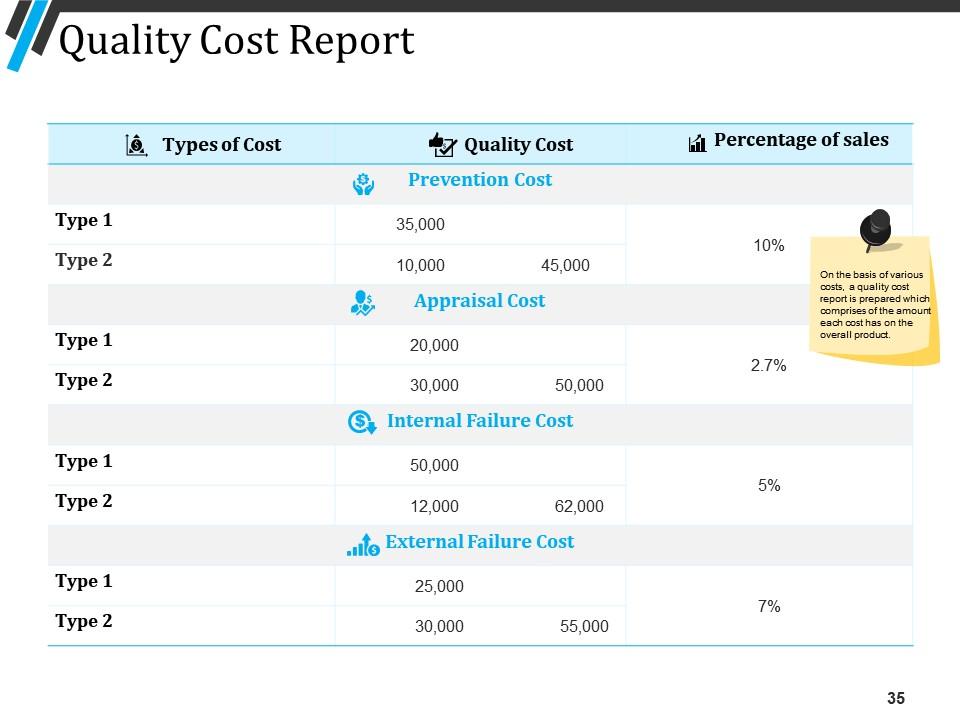
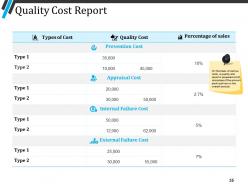
Slide 35: This slide showcases Quality Cost Report. On the basis of various costs, a quality cost report is prepared which comprises of the amount each cost has on the overall product.
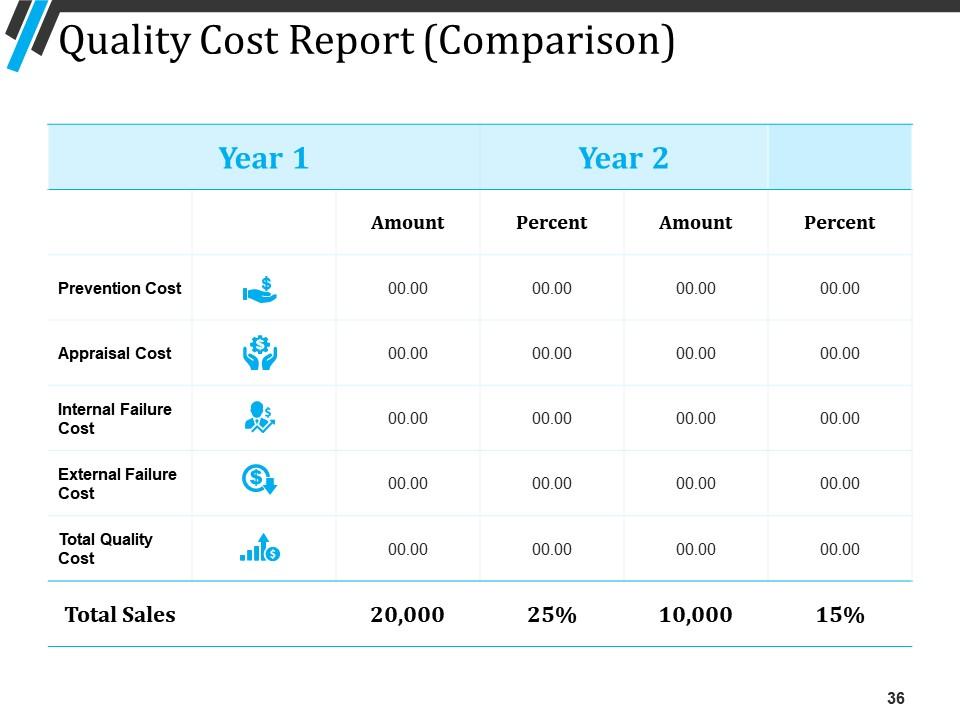
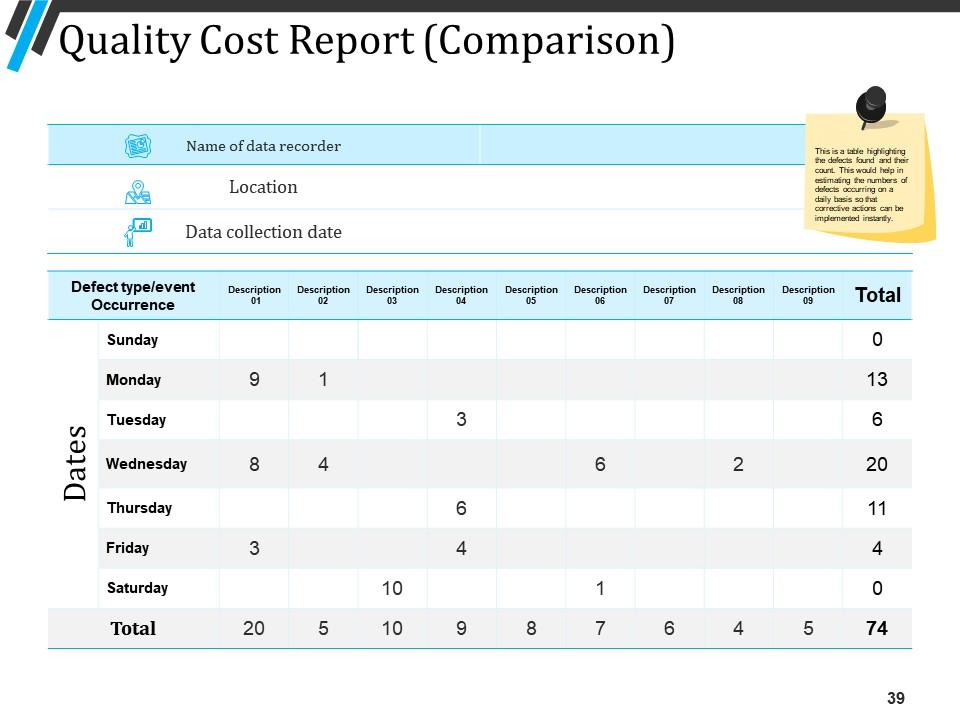
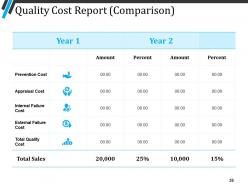
Slide 36: This slide presents Quality Cost Report (Comparison). You can add your information as you require.
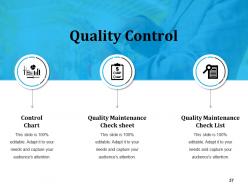
Slide 37: This slide shows Quality Control with these three parameters- Quality Maintenance Check sheet, Quality Maintenance Check List, Control Chart.
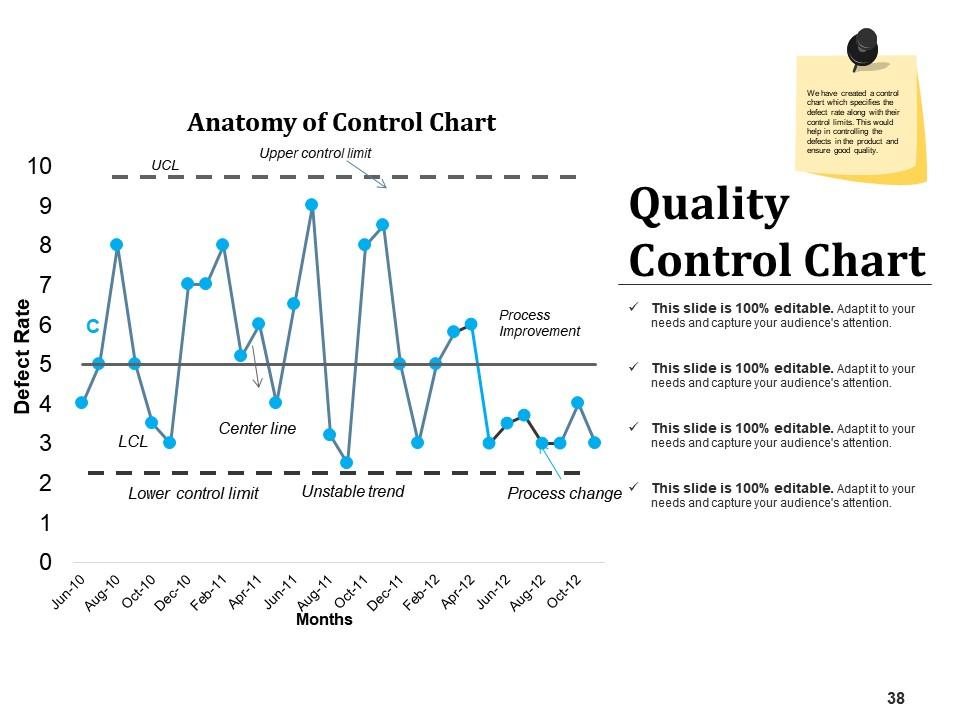
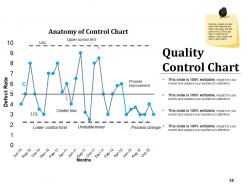
Slide 38: This slide presents Quality Control Chart. We have created a control chart which specifies the defect rate along with their control limits. This would help in controlling the defects in the product and ensure good quality.
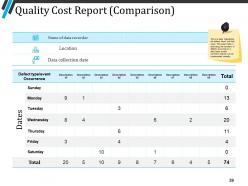
Slide 39: This slide displays Quality Cost Report. This is a table highlighting the defects found and their count. This would help in estimating the numbers of defects occurring on a daily basis so that corrective actions can be implemented instantly.
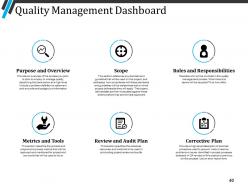
Slide 40: This slide shows Quality Management Dashboard. You can add the information as per your own requirement.
Slide 41: This slide reminds about a 15 minutes coffee break.
Slide 42: This slide is titled as Charts and graphs for moving forward.
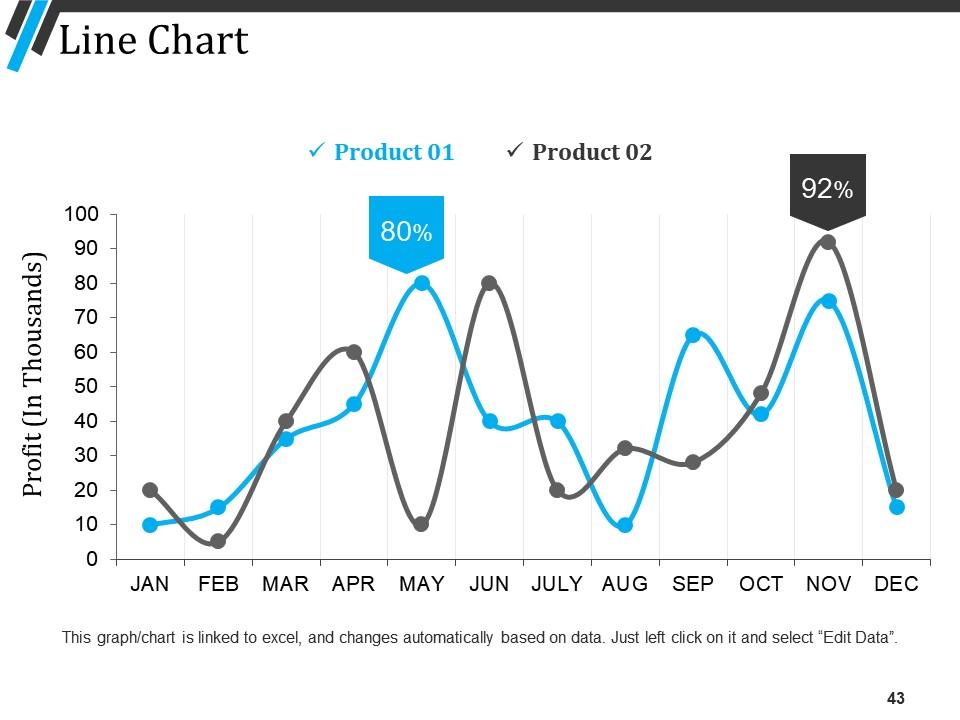
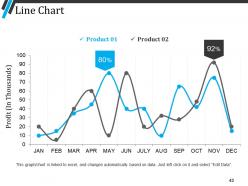
Slide 43: This slide shows line chart with two products comparison.
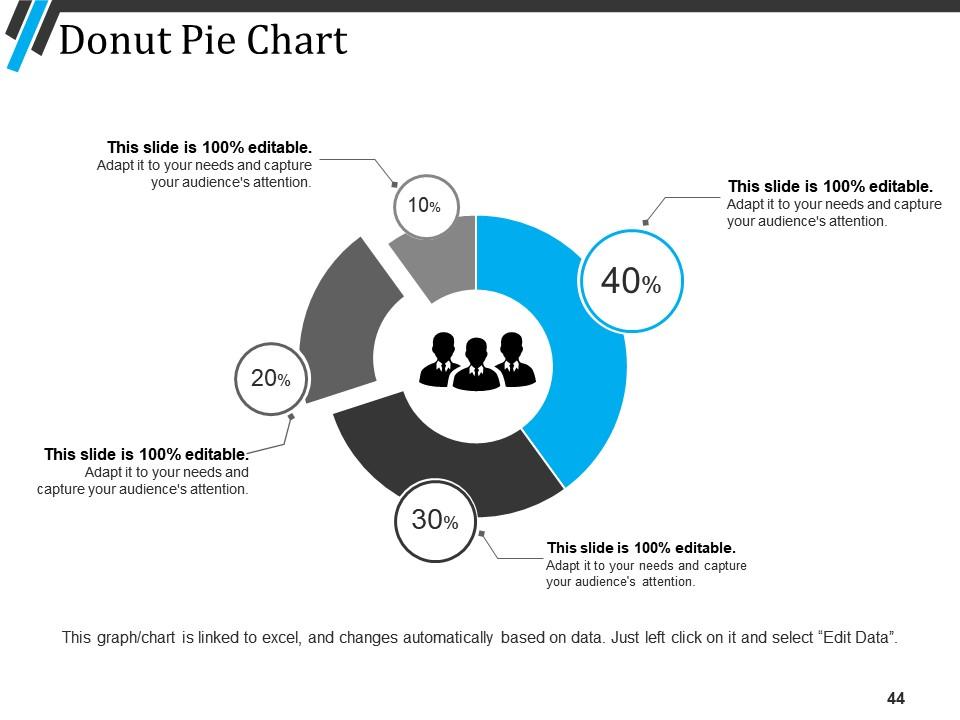
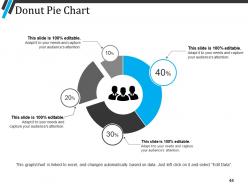
Slide 44: This slide displays Donut Pie Chart with four products comparison.
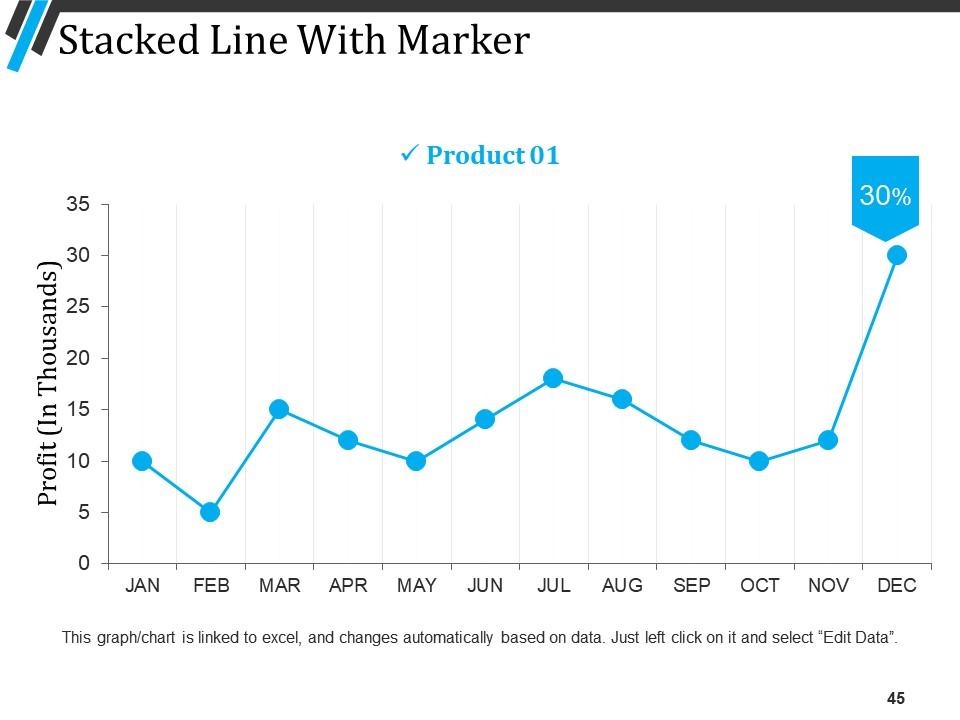
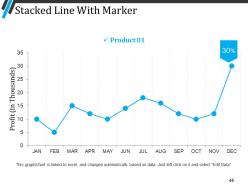
Slide 45: This slide presents Stacked line graph with marker.
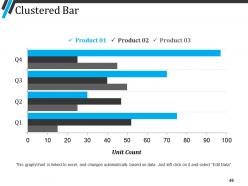
Slide 46: This slide displays Clustered Bar chart with three products comparison.
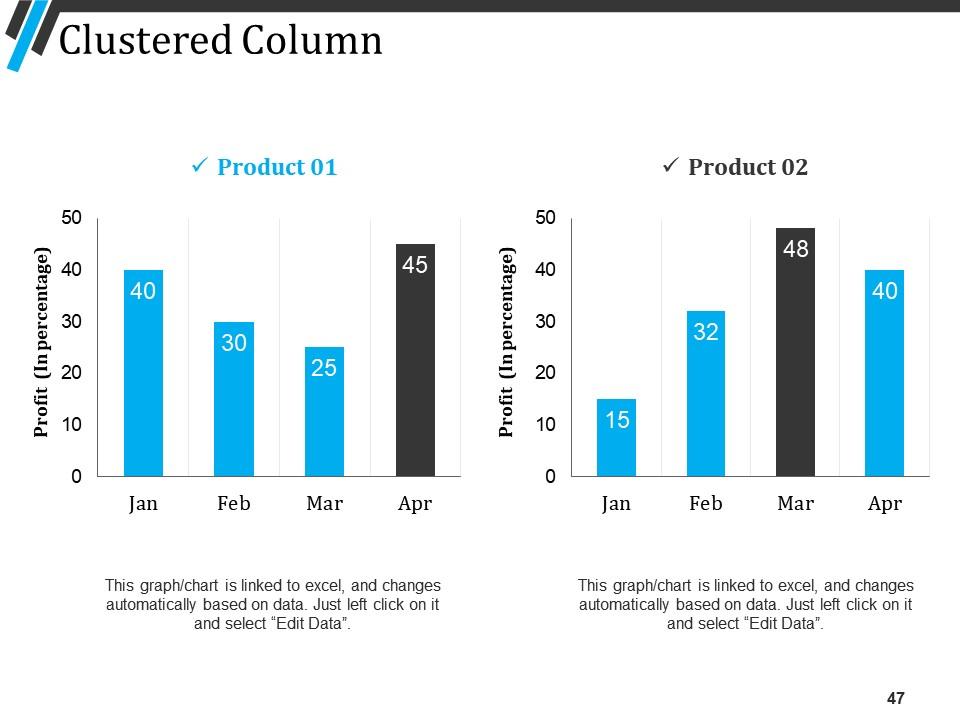
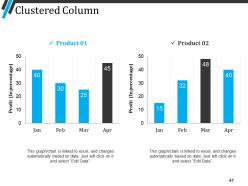
Slide 47: This slide represents Clustered Column chart with two products comparison.
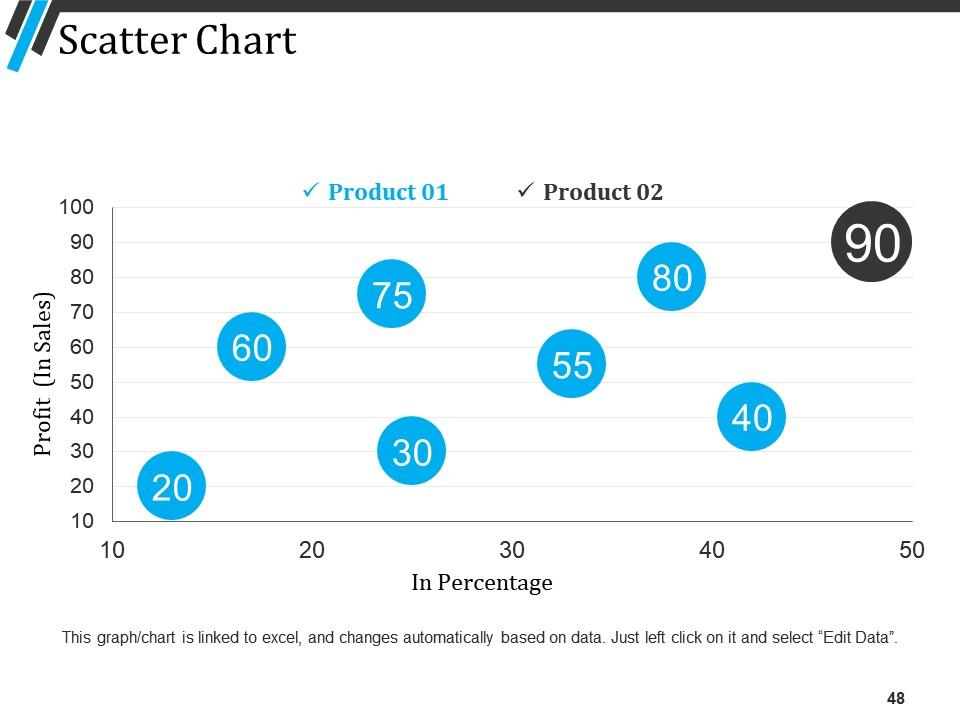
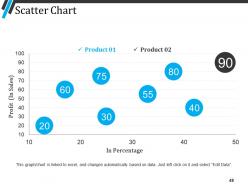
Slide 48: This slide shows Scatter Chart with two products comparison.
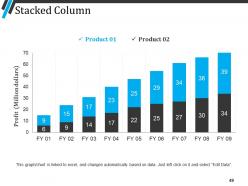
Slide 49: This slide presents Stacked Column chart with two products comparison.
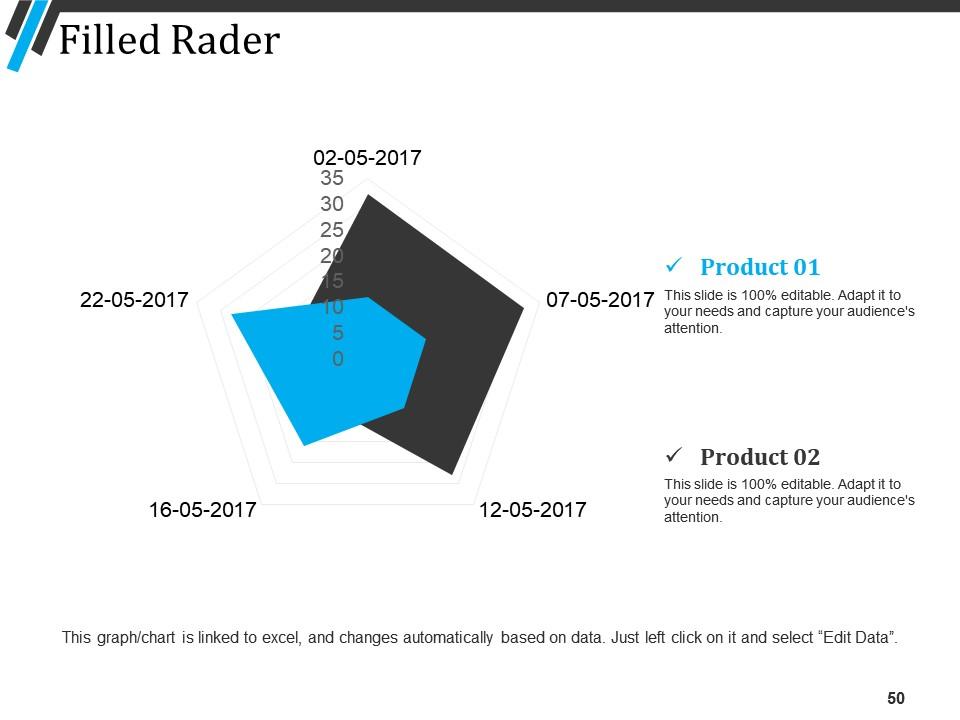
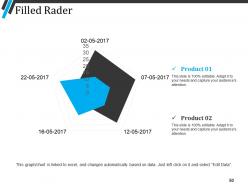
Slide 50: This slide displays Filled Rader chart with two products comparison.
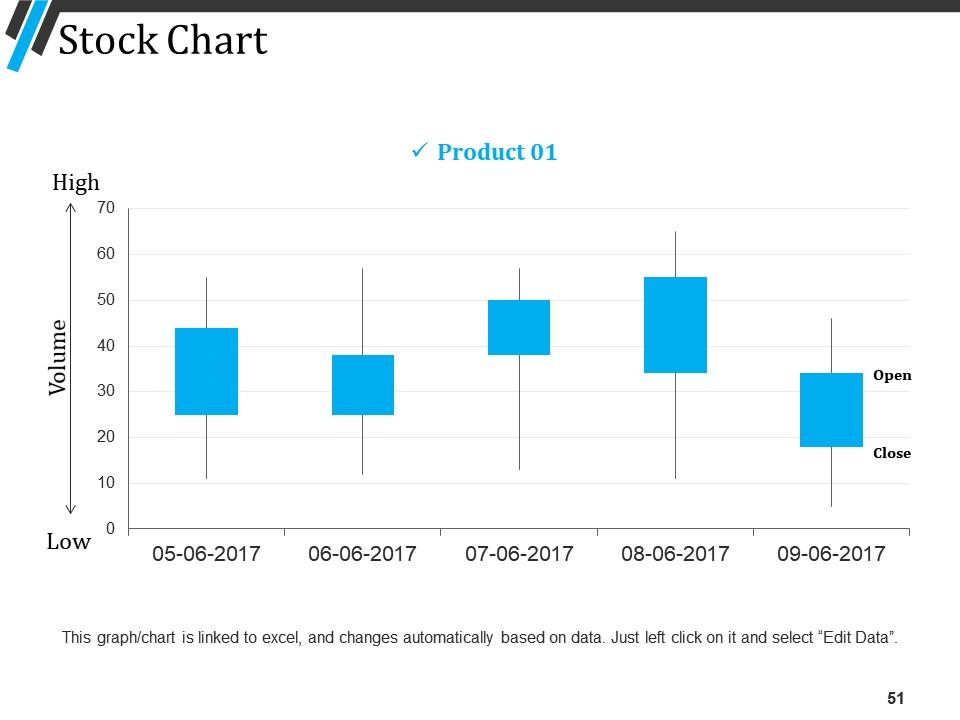
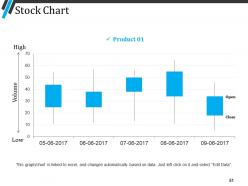
Slide 51: This slide represents Stock Chart.
Slide 52: This slide is titled as Additional Slides for moving forward.
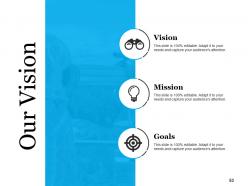
Slide 53: This is Our Vision slide with imagery and text boxes.
Slide 54: This is Our Team slide with names and designation.
Slide 55: This is About Us slide to show company specifications etc.
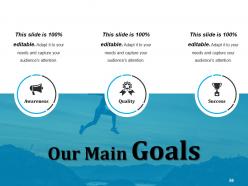
Slide 56: This is Our Main Goals slide. Show your important goals here.
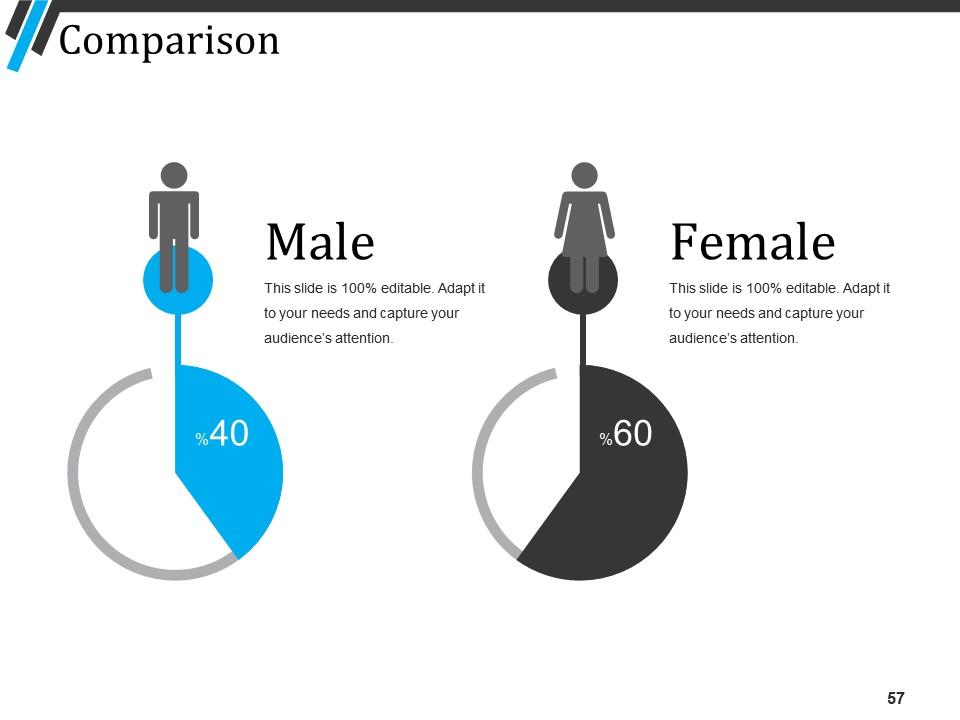
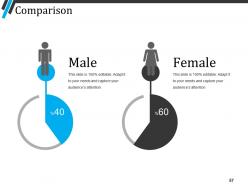
Slide 57: This is a Comparison slide to state comparison between commodities, entities etc.
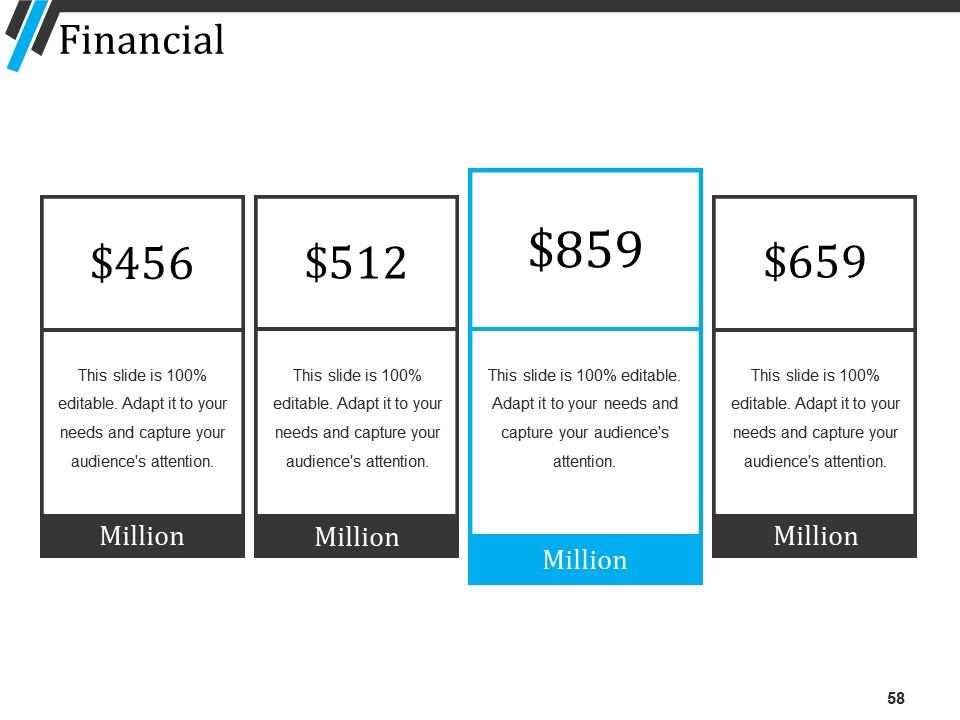
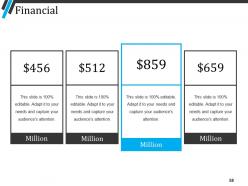
Slide 58: This is a Financial slide. Show finance related stuff here.
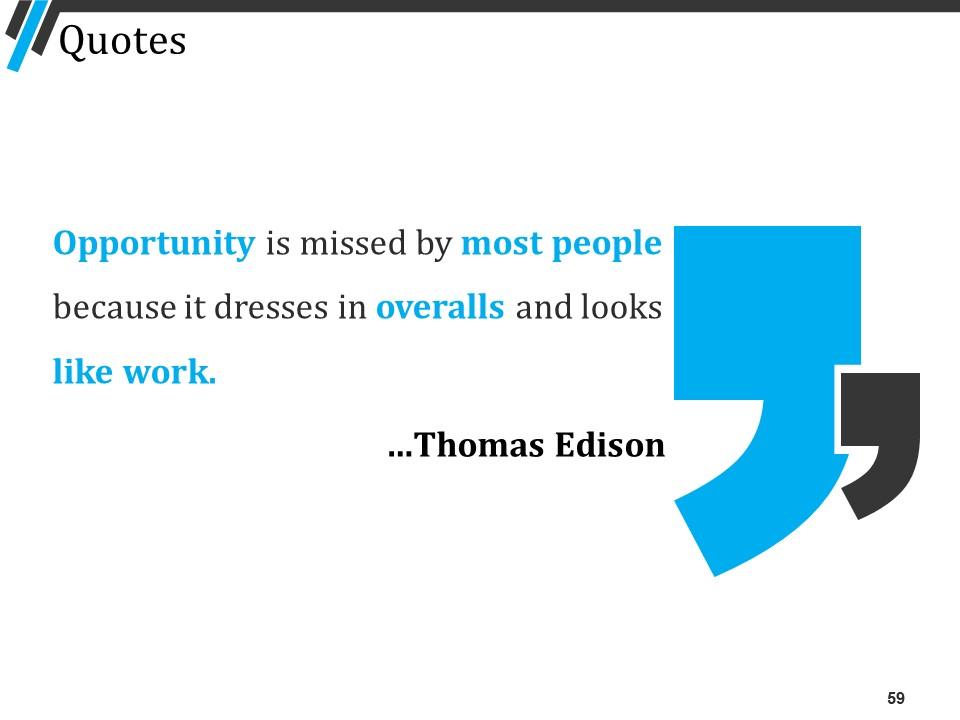
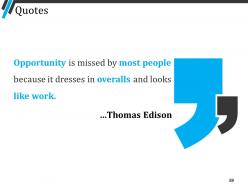
Slide 59: This is a Quotes slide to highlight or state anything specific.
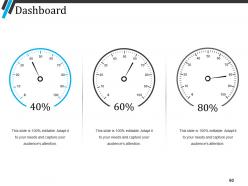
Slide 60: This is a Dashboard slide with text boxes.
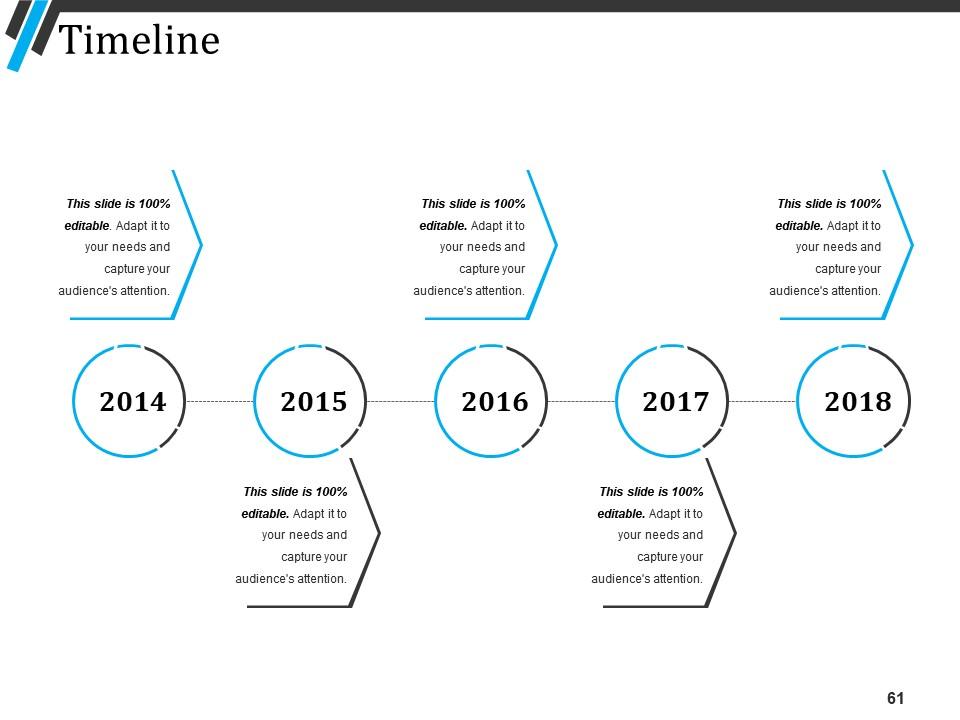
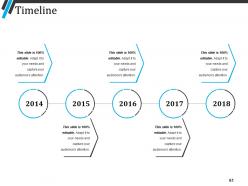
Slide 61: This is a Timeline slide. Show information related with time period here.
Slide 62: This is a Puzzle slide with text boxes.
Slide 63: This is Our Target slide. Show your targets here.
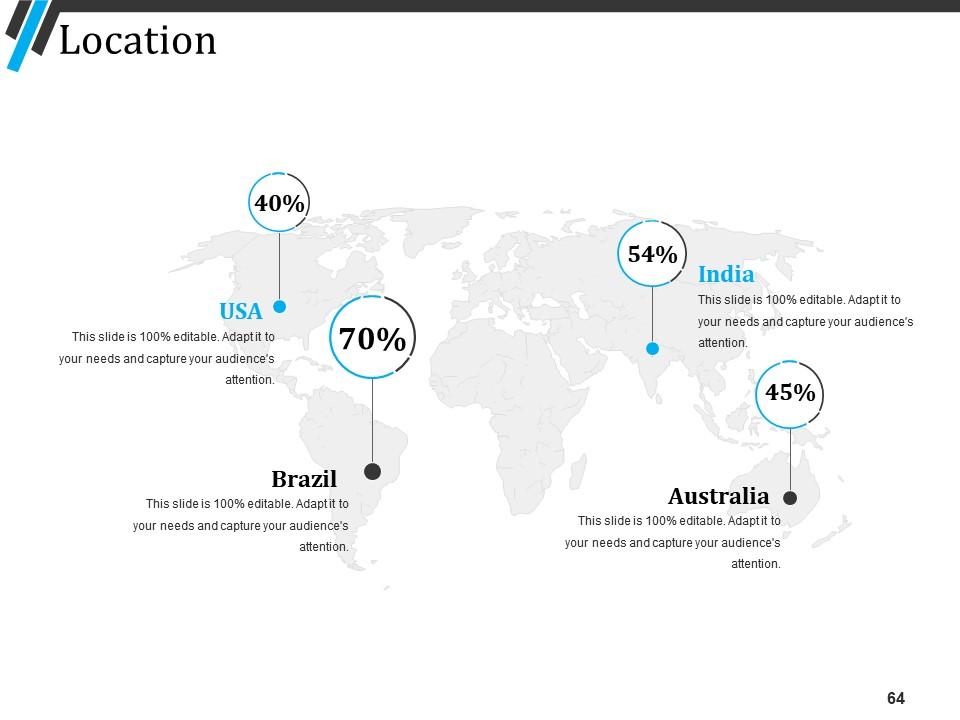
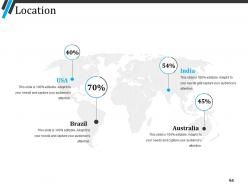
Slide 64: This is a Location slide with maps to show data related with different locations.
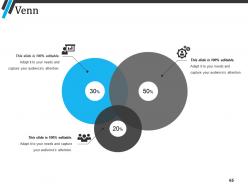
Slide 65: This is a Venn slide with text boxes.
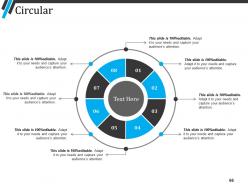
Slide 66: This slide shows Circular diagram with text boxes.
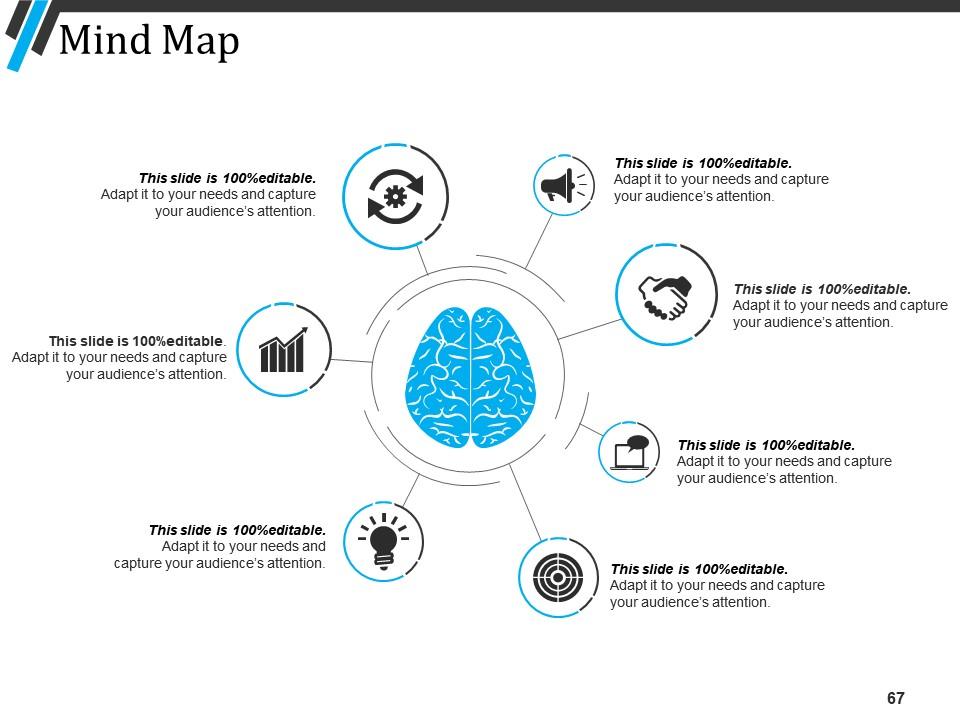
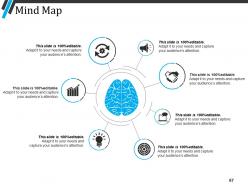
Slide 67: This slide shows Mind Map for representing entities.
Slide 68: This is a Silhouettes slide to show people specific information etc.
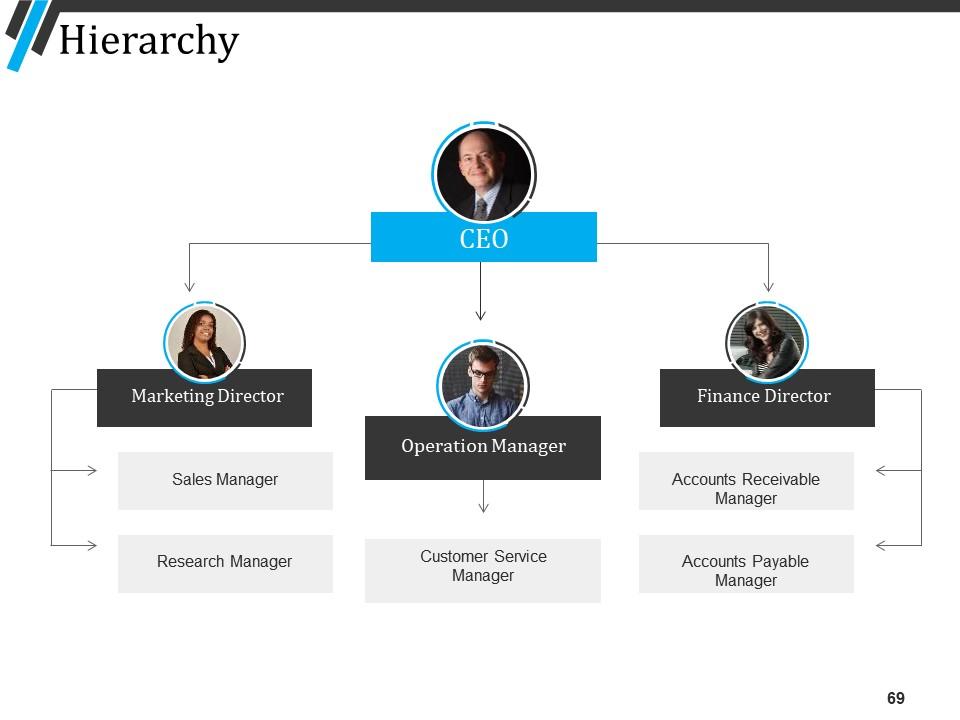
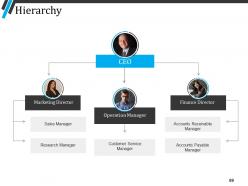
Slide 69: This is a Hierarchy slide with names and designation.
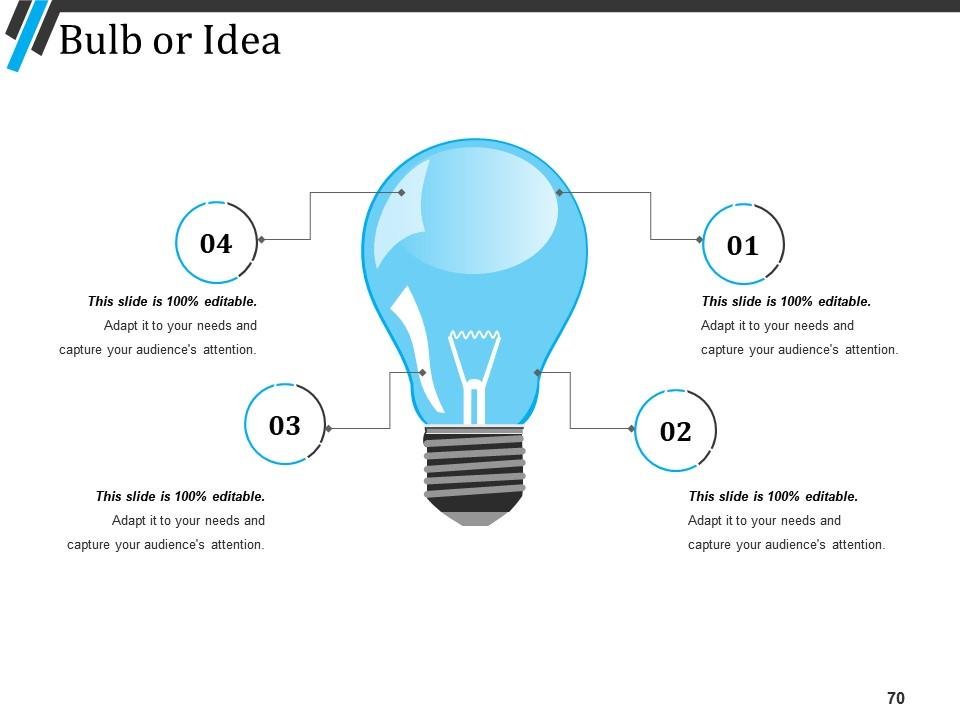
Slide 70: This is a Bulb or Idea slide to state a new idea.
Slide 71: This slide displays Magnifying Glass with text boxes.
Slide 72: This is a Thank You slide with address, contact numbers and email address.
Quality Management System Powerpoint Presentation Slide with all 72 slides:
Handle your assets with our Quality Management System Powerpoint Presentation Slide. You will be delighted with the greater dividends.
-
Amazing product with appealing content and design.
-
Amazing product with appealing content and design.
