


Quality Process And Procedures Powerpoint Presentation Slide




Try Before you Buy Download Free Sample Product
 Impress Your
 Audience
 100%
100% Editable
 Save Hours
 of Time


Use quality process and procedures PowerPoint presentation to eliminate the waste and increase the efficiency to meet the customers’ requirements. With the assistance of this quality improvement PPT presentation, you will be able to implement a quality control process, boost the quality of your products and deliver high-quality products to the consumers. This professionally designed quality assurance process presentation PPT makes sure that the organization must reach the optimal quality levels. This content ready quality management PowerPoint presentation covers a template on TQM pyramid, TQM model, customer focus in TQM, planning process, process management, business process improvement, involvement of people, TQM elements, determinants of product quality and service quality, importance of good quality, consequences of poor quality, principles and certification, TQM principles, ISO certificate, quality management tools, and root cause analysis. Use these quality improvement presentation slides to support your organization tasks while distinguishing the problems or challenges impacting your organization capacities effectively. You can highlight the concept of quality improvement, quality management, quality assurance using these quality process and procedures PPT slides. Rough design can kill even the best planned presentation. Our Quality Process And Procedures Powerpoint Presentation Slide will lend your projects world class design.
People who downloaded this PowerPoint presentation also viewed the following :
Video for Quality Process And Procedures Powerpoint Presentation Slide
Content of this Powerpoint Presentation
Slide 1: This slide introduces Quality Process And Procedures. State Your Company Name and get started.
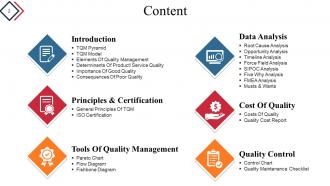
Slide 2: This slide displays Content showcasing the following sub points- Cost Of Quality: Costs Of Quality, Quality Cost Report. Quality Control: Control Chart, Quality Maintenance Checklist. Data Analysis: Root Cause Analysis, Opportunity Analysis, Timeline Analysis, Force Field Analysis, SIPOC Analysis, Five Why Analysis, FMEA Analysis, Musts & Wants. Tools Of Quality Management Pareto Chart Flow Diagram Fishbone Diagram Introduction: TQM Pyramid, TQM Model, Elements Of Quality Management, Determinants Of Product/ Service Quality, Importance Of Good Quality, Consequences Of Poor Quality. Principles & Certification: General Principles Of TQM, ISO Certification.
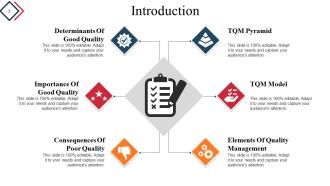
Slide 3: This slide showcases Introduction displaying- TQM Pyramid, Determinants Of Good Quality, TQM Model, Importance Of Good Quality, Elements Of Quality Management, Consequences Of Poor Quality.
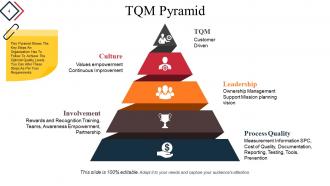
Slide 4: This slide presents a TQM Pyramid displaying- TQM: Customer Driven Culture: Values empowerment Continuous Improvement Leadership: Ownership Management Support Mission planning vision Involvement: Rewards and Recognition Training, Teams, Awareness Empowerment, Partnership Process Quality: Measurement Information SPC, Cost of Quality, Documentation, Reporting, Testing, Tools, Prevention This Pyramid Shows The Key Steps An Organization Has To Follow To Achieve The Optimal Quality Levels. You Can Alter These Steps As Per Your Requirements.
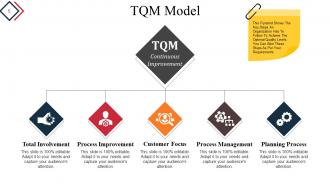
Slide 5: This slide showcases a TQM Model displaying- TQM, Continuous Improvement, Process Improvement, Total Involvement, Customer Focus, Process Management, Planning Process. This Pyramid Shows The Key Steps An Organization Has To Follow To Achieve The Optimal Quality Levels. You Can Alter These Steps As Per Your Requirements.
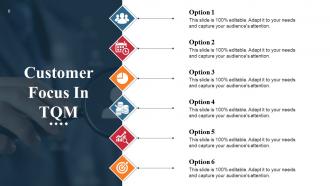
Slide 6: This slide shows Customer Focus In TQM.
Slide 7: This slide shows Planning Process In TQM.
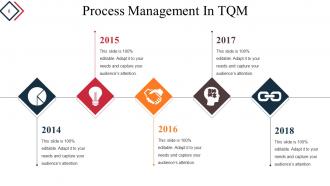
Slide 8: This slide presents Process Management In TQM.
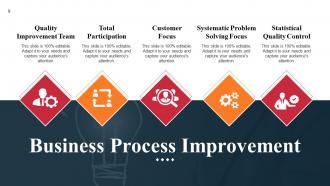
Slide 9: This slide shows Business Process Improvement with- Quality Improvement Team, Total Participation, Customer Focus, Systematic Problem Solving Focus, Statistical Quality Control.
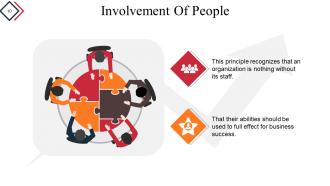
Slide 10: This slide shows Involvement Of People. This principle recognizes that an organization is nothing without its staff. That their abilities should be used to full effect for business success.
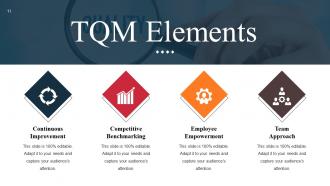
Slide 11: This slide shows TQM Elements with the following subheadings- Continuous Improvement, Competitive Benchmarking, Employee Empowerment, Team Approach.
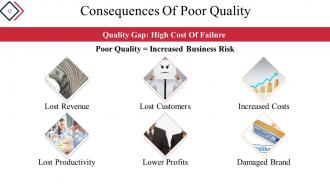
Slide 12: This slide shows Consequences Of Poor Quality Increased Costs, Damaged Brand, Lost Customers, Lower Profits, Lost Revenue, Lost Productivity, Quality Gap: High Cost Of Failure, Poor Quality = Increased Business Risk.
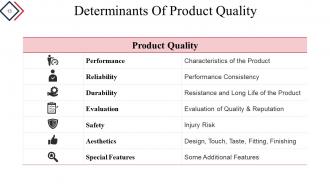
Slide 13: This slide presents Determinants Of Product Quality in tabular form.
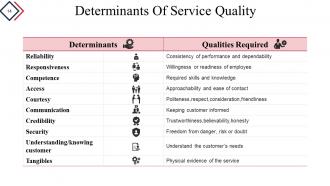
Slide 14: This slide presents Determinants Of Service Quality in tabular form.
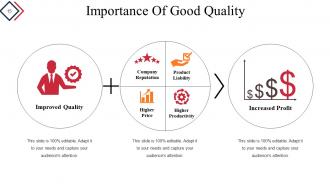
Slide 15: This slide shows Importance Of Good Quality such as- Improved Quality, Increased Profit, Product Liability, Higher Productivity, Company Reputation, Higher Price.
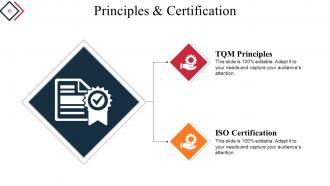
Slide 16: This slide shows Principles & Certification displaying- TQM Principles and ISO Certification.
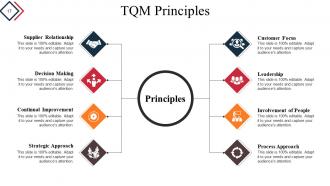
Slide 17: This slide presents TQM Principles such as- Process Approach, Strategic Approach, Involvement of People, Continual Improvement, Leadership, Decision Making, Customer Focus, Supplier Relationship.
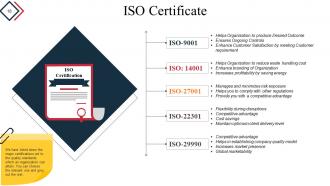
Slide 18: This slide shows ISO Certificate displaying- ISO Certification ISO-9001 Helps Organization to produce Desired Outcome Ensures Ongoing Controls Enhance Customer Satisfaction by meeting Customer requirement ISO: 14001 Helps Organization to reduce waste handling cost Enhance branding of Organization Increases profitability by saving energy ISO-27001 Manages and minimizes risk exposure Helps you to comply with other regulations Provide you with a competitive advantage ISO-22301 Flexibility during disruptions Competitive advantage Cost savings Maintain optimum client delivery level ISO-29990 Competitive advantage Helps in establishing company quality model Increases market presence Global marketability We have listed down the major certifications wrt to the quality standards which an organization can attain. You can choose the relevant one and grey out the rest.
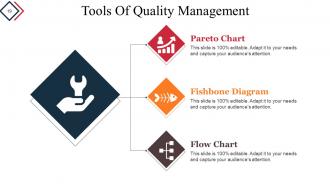
Slide 19: This slide shows Tools Of Quality Management such as- Pareto Chart, Fishbone Diagram, Flow Chart.
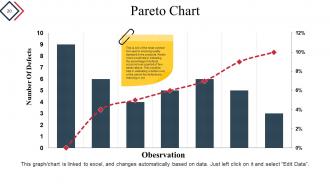
Slide 20: This is a Pareto Chart slide.
Slide 21: This is a Flow Chart slide showing- Define Collection Elements, Define Specification, Start, Specification Required, Create Collection Plans, Create Quality Results, Report And, Analyze Results, Perform Transaction, Stop, Yes, No. Flow chart is another tool used in maintain quality standards. This helps in creating a flow for the activities to be followed. We have given an example, you can edit these data points as per your requirements.
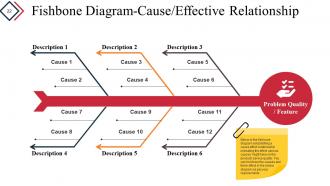
Slide 22: This is a Fishbone Diagram-Cause/Effective Relationship slide.
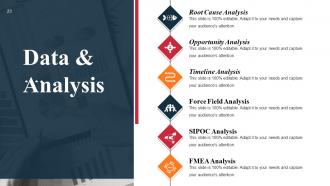
Slide 23: This is Data & Analysis slide displaying- Root Cause Analysis, Opportunity Analysis, Timeline Analysis, Force Field Analysis, SIPOC Analysis, FMEA, FMEA Analysis.
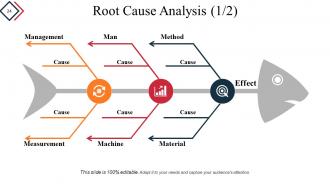
Slide 24: This slide presents Root Cause Analysis showcasing- Material, Cause, Measurement, Machine, Management, Man, Method, Effect.
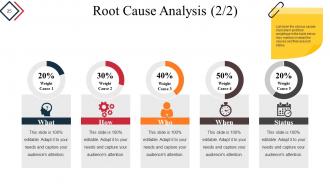
Slide 25: This is a Root Cause Analysis slide showing- What, How, Who, When, Status aspects.
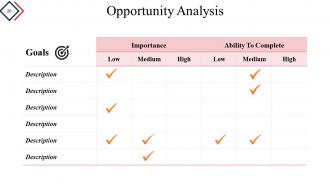
Slide 26: This is an Opportunity Analysis slide in tabular form.
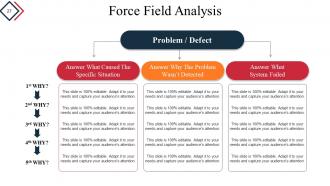
Slide 27: This slide presents Force Field Analysis displaying- Problem / Defect.
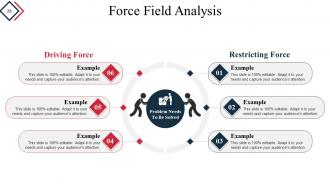
Slide 28: This slide shows Force Field Analysis showcasing- Problem Needs To Be Solved and Driving Force.
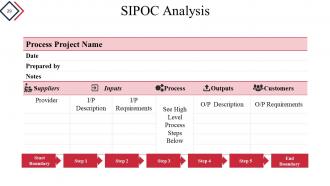
Slide 29: This slide shows SIPOC Analysis with- End Boundary, Start Boundary.
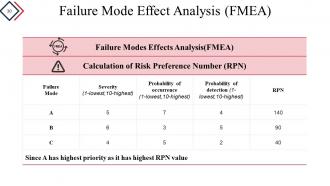
Slide 30: This is Failure Mode Effect Analysis (FMEA) slide.
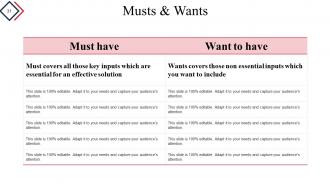
Slide 31: This is Musts & Wants slide in tabular form.
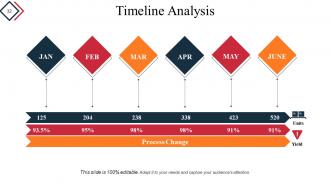
Slide 32: This is a Timeline Analysis slide for presenting milestones, business journey etc.
Slide 33: This slide showcases Cost Of Quality with- Cost of Quality, Quality Cost Report, Quality Cost Report Comparison.
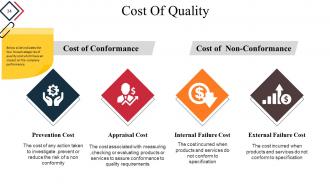
Slide 34: This slide shows Cost Of Quality with the following subheadings- Cost of Conformance, Cost of Non-Conformance, Prevention Cost, Appraisal Cost, Internal Failure Cost, External Failure Cost. Below slide indicates the four broad categories of quality cost which have an impact on the company performance.
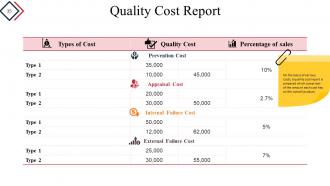
Slide 35: This is a Quality Cost Report slide. On the basis of various costs, a quality cost report is prepared which comprises of the amount each cost has on the overall product.
Slide 36: This is Quality Cost Report (Comparison) slide in tabular form.
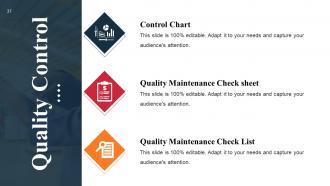
Slide 37: This slide shows Quality Control with- Control Chart, Quality Maintenance Check sheet, Quality Maintenance Check List.
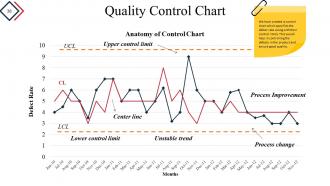
Slide 38: This slide shows Quality Control Chart displaying- Lower control limit, Process Improvement, Upper control limit, Center line, Unstable trend, Process change. We have created a control chart which specifies the defect rate along with their control limits. This would help in controlling the defects in the product and ensure good quality.
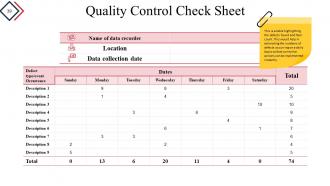
Slide 39: This is a Quality Control Check Sheet slide. This is a table highlighting the defects found and their count. This would help in estimating the numbers of defects occurring on a daily basis so that corrective actions can be implemented instantly.
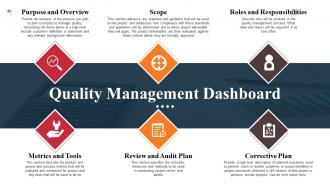
Slide 40: This slide presents a Quality Management Dashboard displaying- Scope, Purpose and Overview, Roles and Responsibilities, Review and Audit Plan, Metrics and Tools, Corrective Plan, Provide a high level description of planned procedure used to prevent ,track or resolve problems or issues identified in project processes detected in QA reviews of this project or previous similar projects. Use an error report form
Slide 41: This is a Coffee Break slide to halt. You can change the image as per requirement/need.
Slide 42: This slide is titled Graphs and Charts to move forward. You can alter the slide content as per need.
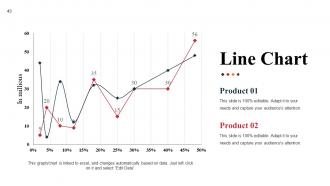
Slide 43: This is a Line chart slide. State specifications, comparison of products/entities here.
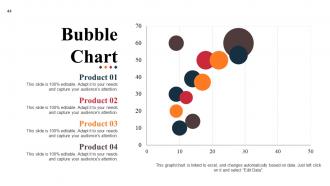
Slide 44: This is a Bubble chart slide. State specifications, comparison of products/entities here.
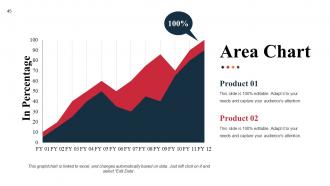
Slide 45: This is an Area chart slide. State specifications, comparison of products/entities here.
Slide 46: This is a Stock chart slide to show product/entity comparison, specifications etc.
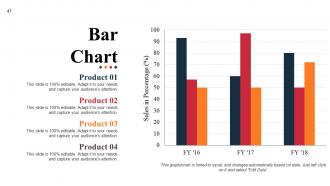
Slide 47: This is a Bar chart slide to show product/entity comparison, specifications etc.
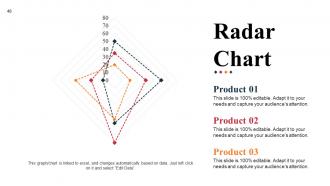
Slide 48: This is a Radar Chart slide to show product/entity comparison, specifications etc.
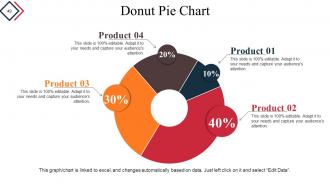
Slide 49: This is a Donut Pie chart slide to show product/entity comparison, specifications etc.
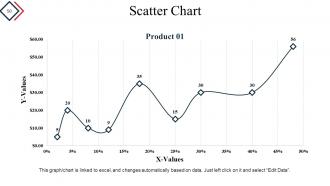
Slide 50: This is a Scatter Chart slide to show product/entity comparison, specifications etc.
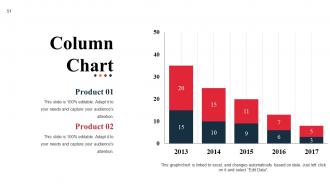
Slide 51: This is a Column chart slide to show product/entity comparison, specifications etc.
Slide 52: This slide is titled Additional Slides to move forward. You may change the slide content as per need.
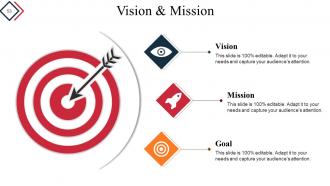
Slide 53: This is Vision & Mission and Goals icon imagery to go with. State them here.
Slide 54: This is an About us slide. State team/company specifications here.
Slide 55: This is Our team slide with names and designation to fill information for.
Slide 56: This is Our Main Goal slide. State goals, targets etc. here.
Slide 57: This is a Comparison slide to show comparison, information, specifications etc.
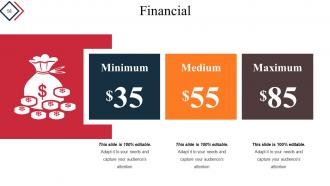
Slide 58: This is a Financial Score slide. State financial aspects etc. here.
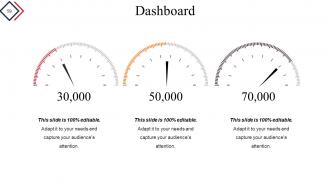
Slide 59: This is a Dashboard slide for showing information, kpis, metrics, specifications etc.
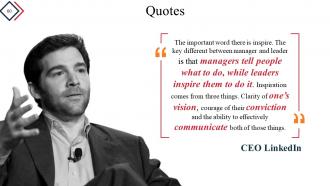
Slide 60: This is a Quotes slide. Convey message, beliefs etc. here. You may change the slide content as desired.
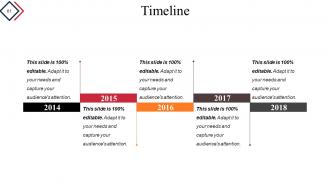
Slide 61: This is a Timeline slide to show milestones, evolution, growth highlights etc.
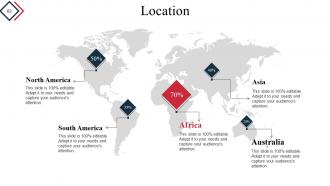
Slide 62: This is a Location slide of world map to show global marketing, growth, presence etc.
Slide 63: This is a Puzzle image slide. State information, specifications etc. here.
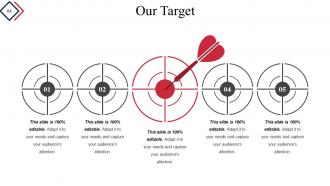
Slide 64: This is Our Target slide. State your targets, aspirations etc. here.
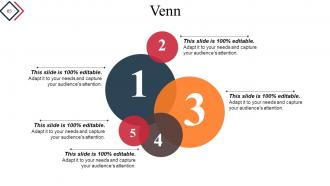
Slide 65: This is a Venn diagram image slide. State information, specifications etc. here.
Slide 66: This is a Mind Map image slide to show information, specifications etc.
Slide 67: This is a Silhouettes slide. State audience/market related information, specification etc. here.
Slide 68: This is a Circular image slide. State information, specification etc. here.
Slide 69: This is a Hierarchy slide. State team structure, organizational information, specification etc. here.
Slide 70: This is an Idea bulb slide. State information, specification, innovative aspects etc. here.
Slide 71: This is a Magnifying glass image slide. State information, specification, scoping aspects etc. here.
Slide 72: This is a Thank You slide with Address # street number, city, state, Contact Numbers, Email Address.
Quality Process And Procedures Powerpoint Presentation Slide with all 72 slides:
Foster business alliances with our Quality Process And Procedures Powerpoint Presentation Slide. Forge bonds that last forever.











FAQs for Quality Process And Procedures
So the big ones are customer focus, getting everyone involved, process thinking, continuous improvement, data-driven decisions, and leadership buy-in. Instead of just checking quality at the end, build it into each step - saves you tons of headaches later. Leadership has to set the example, but honestly? Quality can't just be the QA team's problem. Everyone's gotta care about it. Use real data when you're making calls, not just what feels right. Oh, and always be tweaking your processes. I'd start by mapping what you're doing now and spotting where things usually go wrong.
Dude, TQM works because it gets your whole team obsessed with making things better for customers. Instead of just the quality control people caring, suddenly everyone owns their piece of the process. You'll see way less waste and fewer screw-ups. People actually get more engaged too - there's something about being responsible for quality that makes work feel less soul-crushing, you know? Start with just one process though. Measure what happens, then expand from there. I've seen companies try to flip everything at once and it's a disaster. Your team will hate you.
Dude, customer feedback is like your reality check - shows you if your quality stuff actually works or if you're just fooling yourself. Teams get obsessed with their fancy dashboards but miss the obvious problems staring them in the face. If customers are still griping about defects while your internal metrics look perfect, something's broken in the middle. That feedback is pure gold though. Gives you real examples of what needs fixing instead of guessing. Oh, and definitely check it weekly with your other quality data - I learned that one the hard way.
Six Sigma basically gives you a solid framework to hunt down defects using actual data instead of guessing. The DMAIC process breaks it down - Define, Measure, Analyze, Improve, Control. Sounds corporate-y but it works. You're looking at statistical patterns that would fly right past you normally. Honestly, the math part isn't as painful as it sounds. Focus on reducing variation and fixing root problems, not just patching symptoms. You can hit crazy good quality levels - like 99.99966% defect-free. Just pick one messy process and walk through DMAIC step by step.
So QA is more about setting up good processes upfront to prevent bugs from happening in the first place. QC comes later - that's when you're actually testing and inspecting to catch whatever slipped through. I always think of it like this: QA builds the guardrails, QC is your safety net. Both matter, just at different points. QA runs throughout your whole development cycle to keep everyone following best practices. Then QC jumps in at the end to verify everything actually works right. Honestly, most teams I've worked with need both. Try mapping out what you're currently doing in each bucket - it'll make roles way clearer.
Honestly, leadership buy-in is everything - without it you're screwed from the start. Map your current processes first (and be brutally honest about what's broken). Don't try fixing everything at once though, that's a recipe for disaster. Pick one area and nail it before moving on. Training is huge - people need to get WHY they're doing something, not just following steps blindly. Oh, and those internal audits everyone hates? They'll save your butt by catching problems early. The whole "quality is everyone's job" thing sounds cheesy but it's true. Start small and build from there.
Honestly, most places start with the obvious stuff - defect rates, customer satisfaction, and first-pass yield (basically how much you nail on the first try). Cost of quality is huge too - like, what you're spending to fix screwups versus preventing them upfront. On-time delivery and return rates are pretty standard. Everyone's obsessed with SLA compliance metrics lately, which makes sense I guess. But here's the thing - don't go crazy tracking everything. Pick maybe 3-5 that actually relate to your biggest pain points right now. I've seen teams drown in spreadsheets and accomplish nothing. Start with whatever's making your life miserable and go from there.
Honestly, ISO 9001 is pretty solid if you're serious about quality. You'll get a framework that forces you to document everything and spot problems early. The certification itself is like a trust badge - clients eat that stuff up when you're pitching new business. But here's the real kicker: your whole operation becomes way more efficient and you stop making expensive stupid mistakes. Oh, and you have to keep improving constantly, which sounds annoying but actually works out great. Before you dive in though, map out what quality processes you already have so you know what you're missing.
Honestly, start with getting your executives on board first - if they don't care, nobody will. Make those quality metrics visible and actually tie them to reviews so people have skin in the game. Training's super important too, but focus on teaching people how to fix problems, not just spot them. Oh and don't try to flip the whole company overnight (trust me on this one lol). Celebrate the small wins when teams catch stuff early. Pick one department to be your guinea pigs and get them excited about it first, then expand from there. Way less overwhelming.
Tech is honestly a lifesaver for quality management stuff. It handles all the boring data collection and scheduling automatically, plus you get live dashboards instead of waiting around for those weekly reports (which always felt outdated anyway). The AI thing is pretty cool too - catches defect patterns we'd totally miss. Nothing slips through cracks with automated workflows, and digital audit trails make compliance so much less of a headache. My advice? Start with whatever manual process is driving your team crazy and find a simple tool for that first. Don't try to overhaul everything at once.
Honestly, people will fight you on new processes - it's just human nature. Leadership buy-in is make-or-break too. Training always gets rushed, which bites you later. Communication between departments? Good luck with that mess. The money and time investment upfront can be brutal, especially when you're trying to prove ROI. Oh, and document management will drive you insane if you don't nail down systems early. I'd say start with small pilot programs first. Get your leadership actually showing face, not just sending emails about it. Pour resources into training early - seriously, don't cheap out there.
So quality management is like your early warning system - catches problems before they blow up into disasters. You're constantly checking for defects and inconsistencies that could snowball later. It's way better than playing catch-up after everything goes wrong, honestly. Your audits and quality checks reveal weak spots in operations and supply chains before they bite you. The data patterns are pretty revealing once you start tracking them. Map your current quality metrics against potential risk areas - you'll probably find connections you didn't expect. Basically smoke detectors vs waiting for the fire department to show up.
Look, continual improvement is what keeps quality management from getting stale. Small, regular tweaks beat massive overhauls every time - think gym routine vs crash diet, you know? Your team starts hunting down problems before they explode into real issues. Plus customers stay happier when you're always fine-tuning things. Honestly, most companies skip this part and wonder why their processes suck. Pick one thing this week that's bugging you and ask: what's the tiniest fix we could make right now? Those little changes add up fast.
Honestly, training your people is make-or-break for quality stuff. I've watched companies blow serious cash on these elaborate quality systems that just sit there because nobody knows what they're doing with them. Your team needs to understand the standards and how to spot problems before they get out of hand. Confident employees do better work - it's pretty straightforward. Figure out where your knowledge gaps are first, then build training around whatever processes and tools you're actually using. Btw, don't skip the problem-solving part - that's where you'll see the biggest difference.
Honestly, everything's moving toward AI and automation now. You're seeing predictive quality management replacing those old reactive approaches. Real-time monitoring is standard, and digital twins let you test stuff virtually before production - pretty cool actually. COVID definitely pushed remote auditing and cloud systems into overdrive. Sustainability metrics are getting mixed into quality frameworks too, which makes sense I guess. The whole industry's shifting from periodic check-ins to continuous automated processes. My advice? Start small with AI tools for your data analysis. Even basic automation beats manual work every time.
-
Excellent products for quick understanding.
-
The content is very helpful from business point of view.