


Quaterly business growth analysis and development powerpoint presentation slides






Try Before you Buy Download Free Sample Product
 Impress Your
 Audience
 100%
100% Editable
 Save Hours
 of Time


Want to build an amazing quarterly business growth preparation PPT model? No need to wrestle much as we have come up with a pre-designed 80 slides Quarterly Business Growth Analysis And Development Powerpoint Presentation Slides. With support of this PowerPoint show file you can set the right tone of a quarterly business growth and development meeting agenda to discuss next quarter plans or future forecasting for effective business growth steps. In addition, this PowerPoint presentation supports to underline significant factors of a business overview, performance management, performance review or performance evaluation for future success, updates on client and project. Well, this business growth plan presentation PPT deck also helps to clarify on competitor’s analysis as there are slides like competitor analysis revenue, market share, cost of goods sold, net profit margin etc. which is a major part for any successful business. Big picture here is that exclusive slide templates like financial summary, geographically revenue split, key developments/milestones achieved, P&L – KPIs, balance sheet, cash flow statement, funding updates, project update etc. are included to give edge to presenter. In short, this business growth plan PowerPoint template has all sorts of presentation slides that are required to deliver a stunning quarterly business growth and development analysis presentation. So, don’t think, simply click to download and amaze the audience. Develop a clearer image of how the future will evolve due to our Quaterly Business Growth Analysis And Development Powerpoint Presentation Slides. Increase your grasp of events.
People who downloaded this PowerPoint presentation also viewed the following :
Content of this Powerpoint Presentation
Slide 1: This slide introduces Quarterly Business Growth Analysis And Development with image. Add your company name to get started.
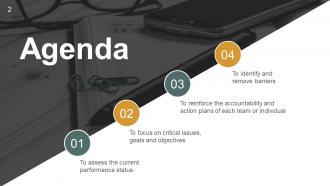
Slide 2: This is an Agenda slide. State company agendas here in a professional manner.
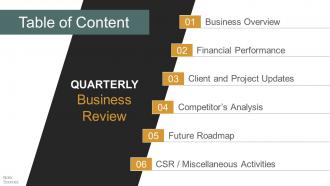
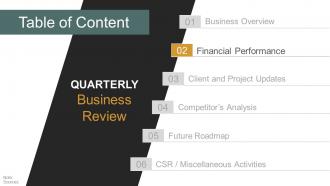
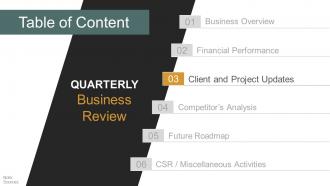
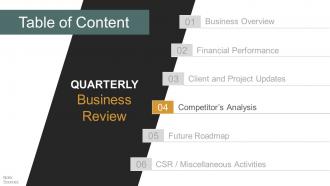
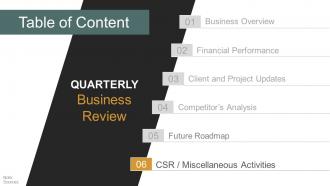
Slide 3: This is Table of Content slide with- Business Overview, Financial Performance, Client and Project Updates, Competitor’s Analysis, Future Roadmap, CSR / Miscellaneous Activities.
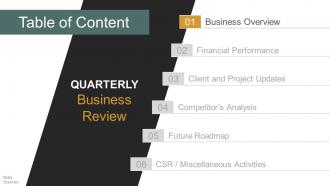
Slide 4: This slide also showcases the Table of Content.
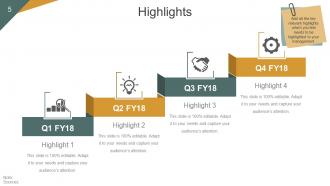
Slide 5: This is Highlights slide with icons. Add all the key relevant highlights which you feel needs to be highlighted to your management.
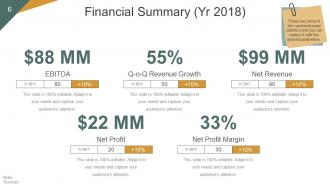
Slide 6: This slide presents Financial Summary (Yr 2018) stats of the company. These are some of the commonly used statistics and you can replace it with the desired parameters.
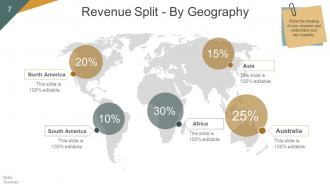
Slide 7: This is Revenue Split - By Geography slide on a world map image. Show the breakup of your revenue and understand your key markets.
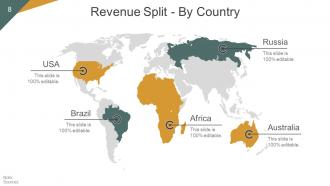
Slide 8: This slide also shows Revenue Split - By Country on a world map image.
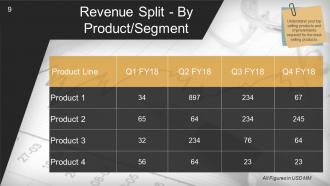
Slide 9: This slide shows Revenue Split - By Product/Segment. Understand your top selling products and improvements required for the least selling products.
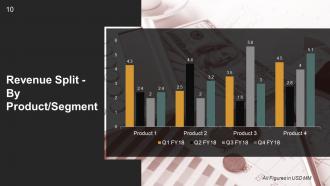
Slide 10: This slide also shows Revenue Split - By Product/Segment in a bar graph/ chart form.
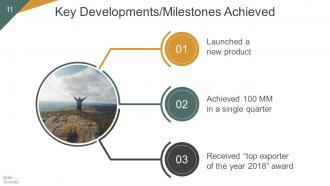
Slide 11: This slide showcases Key Developments/Milestones Achieved in a circular image form.
Slide 12: This is another Table of Content slide to state.
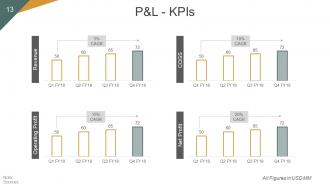
Slide 13: This slide presents P&L - KPIs in a bar graph/ chart form showcasing- Revenue, Operating Profit, Net Profit, COGS.
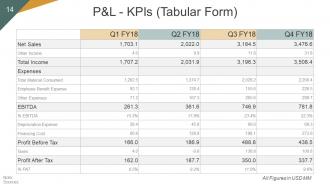
Slide 14: This slide also presents P&L - KPIs in a tabular form.
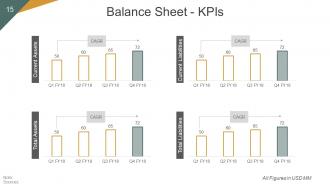
Slide 15: This slide showcases Balance Sheet - KPIs in a bar graph/ chart form.
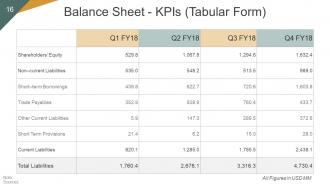
Slide 16: This slide also showcases Balance Sheet - KPIs in a tabular form.
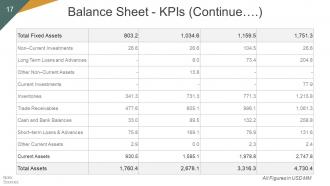
Slide 17: This slide also shows Balance Sheet - KPIs.
Slide 18: This slide presents the Cash Flow Statement - KPIs in a bar graph/ chart form showing- Operations, Investing Activities, Net Increase in Cash, Financing Activities.
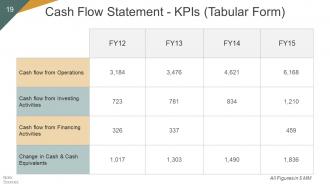
Slide 19: This slide presents Cash Flow Statement - KPIs in a tabular form.
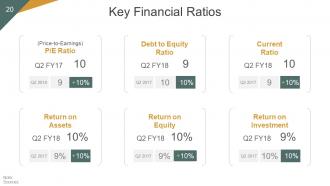
Slide 20: This slide states Key Financial Ratios which include- Return on Assets, Return on Equity, (Price-to-Earnings) P/E Ratio, Debt to Equity Ratio, Return on Investment, Current Ratio.
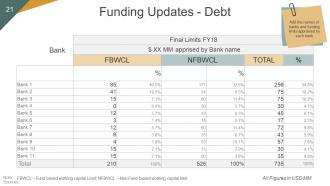
Slide 21: This is Funding Updates - Debt slide. Add the names of banks and funding limits appraised by each bank.
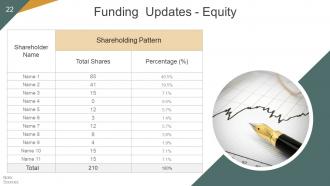
Slide 22: This is Funding Updates - Equity slide showing Shareholding Pattern in a tabular form.
Slide 23: This slide is also titled Table of Content.
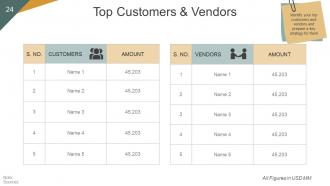
Slide 24: This slide showcases company Top Customers & Vendors. Identify your top customers and vendors and prepare a key strategy for them.
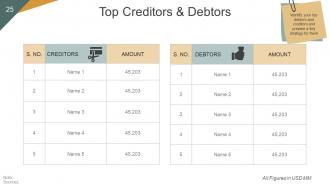
Slide 25: This slide showcases company Top Creditors & Debtors. Identify your top debtors and creditors and prepare a key strategy for them
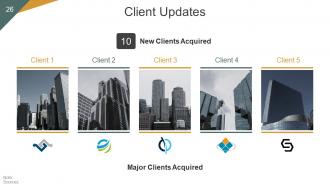
Slide 26: This slide presents Client Updates with their respective icons.
Slide 27: This slide showcases Project Updates which include information on- Major Projects Bagged, Major orders in hand, Major Projects Lost, Pipeline Orders.
Slide 28: This slide also shows the Table of Content.
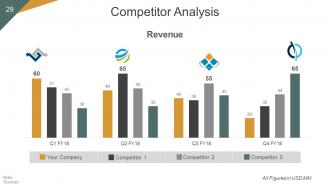
Slide 29: This is Competitor Analysis slide in a bar graph/ chart form.
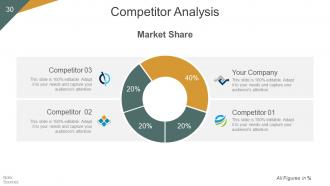
Slide 30: This slide also shows Competitor Analysis in a donut chart form.
Slide 31: This is also a Competitor Analysis slide in a bar graph/ chart form with respect to Cost of Goods Sold.
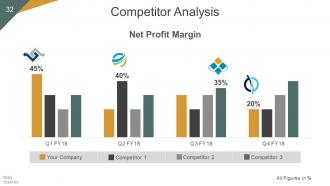
Slide 32: This is also a Competitor Analysis slide in bar graph/ chart form showing Net Profit Margin.
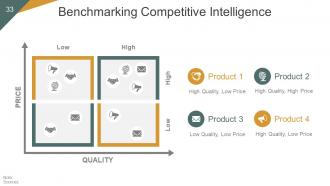
Slide 33: This is Benchmarking Competitive Intelligence slide in a matrix form with Price and Quality as its parameters.
Slide 34: This slide also showcases Table of Content.
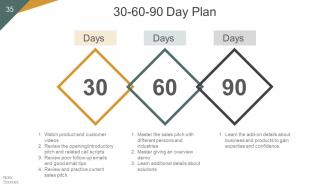
Slide 35: This slide shows company 30-60-90 Day Plan.
Slide 36: This slide showcases Light Bulb With Time Planning Ideas to state.
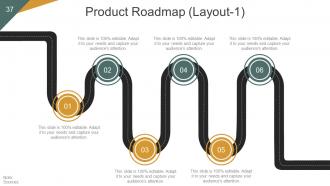
Slide 37: This is a Product Roadmap slide to state product growth, information etc.
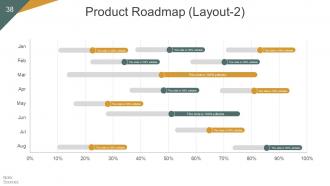
Slide 38: This slide also showcases a Product Roadmap (Layout-2). Use as per need.
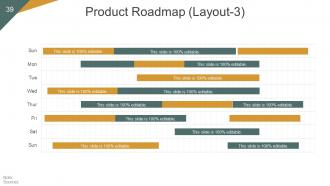
Slide 39: This is also a Product Roadmap (Layout-3) showcasing slide.
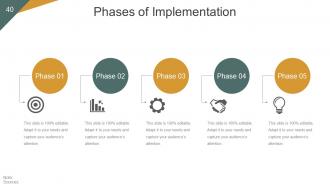
Slide 40: This slide states the various Phases of Implementation with their respective icons.
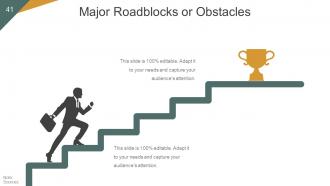
Slide 41: This slide states Major Roadblocks or Obstacles with human imagery.
Slide 42: This slide showcases Major Roadblocks or Obstacles with relevant imagery.
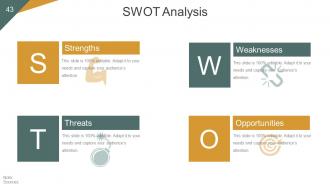
Slide 43: This slide presents SWOT Analysis.
Slide 44: This is another Table of Content slide.
Slide 45: This is Corporate Social Responsibility slide with imagery and text boxes.
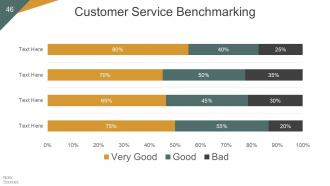
Slide 46: This slide shows Customer Service Benchmarking with Very Good, Good and Bad parameters.
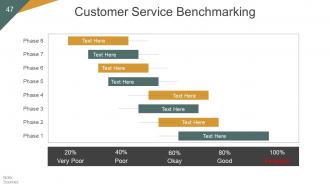
Slide 47: This slide also showcases Customer Service Benchmarking in terms of Phases.
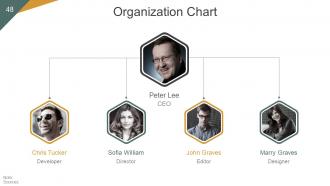
Slide 48: This slide showcases the Organization Chart in a flow chart with name and designation to fill.
Slide 49: This slide showcases a flow chart of Goals and Success Metrics.
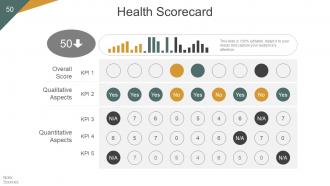
Slide 50: This slide displays Health Scorecard.
Slide 51: This slide presents Icons for Quarterly Business Growth Analysis and Development. It can be altered based on your requirement.
Slide 52: This slide is titled Additional Slides to move forward. Use as per need.
Slide 53: This is Our Vision slide with imagery. State company mission, vision and goals here.
Slide 54: This is Our Team slide with text boxes to present team related information, specifications etc.
Slide 55: This is an About Us slide to present company information, specifications etc.
Slide 56: This is Our Goal slide with target imagery to state company goals, aspirations etc.
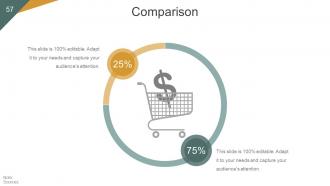
Slide 57: This is a Comparison slide in a circular image form to compare entities/products etc.
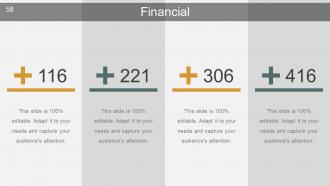
Slide 58: This slide is titled as Financials. Show finance related stuff here.
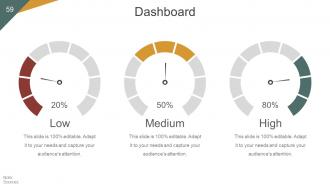
Slide 59: This is a Dashboard slide with High, Medium and Low parameters.
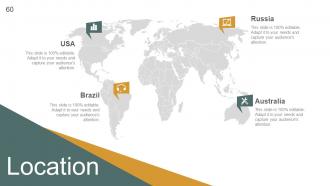
Slide 60: This is a Location slide to show global growth, presence etc. on a world map.
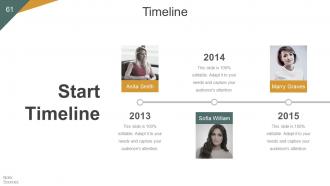
Slide 61: This is a Timeline slide showcasing the Start point for important milestones, highlights etc.
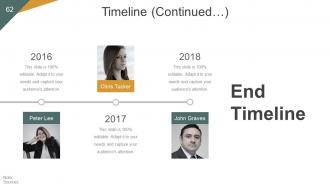
Slide 62: This is also a Timeline slide with End point to state important milestones, highlights etc.
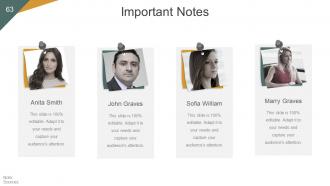
Slide 63: This is Important Notes slide to mark something important, specific etc.
Slide 64: This is a Newspaper slide to highlight something or add memorabilia.
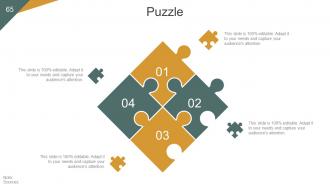
Slide 65: This is a Puzzle image slide to show information, specification etc.
Slide 66: This is a Target image slide. State targets, goals, etc. here.
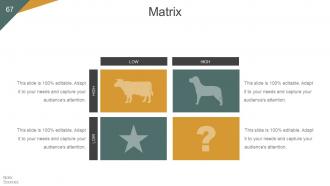
Slide 67: This is a Matrix image slide. State information, specificiations etc. in terms of high-low here.
Slide 68: This is Silhouettes image slide to present people specific information, specifications etc.
Slide 69: This is Our Charts slide to proceed forward. Use as per need.
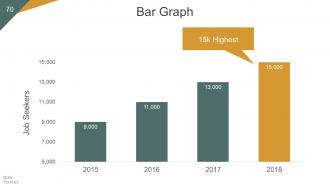
Slide 70: This is a Bar Graph image slide to show product comparison, growth etc.
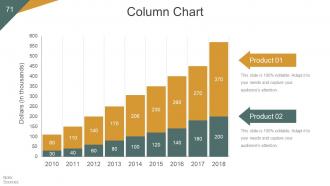
Slide 71: This is Column Chart slide to showcase product comparison, information, specifications etc.
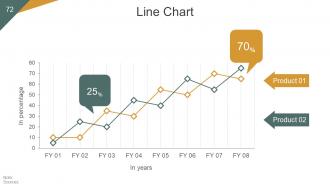
Slide 72: This slide shows a Line Chart for two product/ entity comparison.
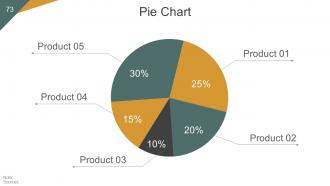
Slide 73: This is a Pie Chart slide to show product/ entity comparison etc.
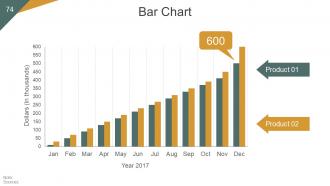
Slide 74: This is a Bar Chart slide to present product/entity comparison, specifications etc.
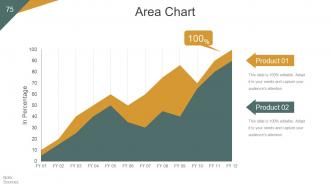
Slide 75: This is an Area Chart slide to present product/entity comparison, specifications etc.
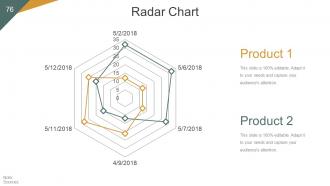
Slide 76: This is a Radar Chart to present product/entity comparison, specifications etc.
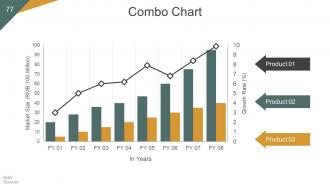
Slide 77: This is a Combo Chart slide to present product/entity comparison, specifications etc.
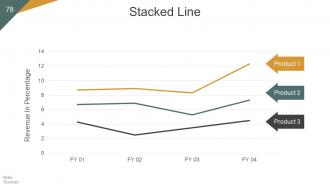
Slide 78: This is a Stacked Line chart slide to present product/entity comparison, specifications etc.
Slide 79: This is a Contact Us slide with Address# Street number, city, state, Email address, Contact numbers.
Slide 80: This is a Thank You slide for acknowledgement.
Quaterly business growth analysis and development powerpoint presentation slides with all 80 slides:
Give them a bigger greeting than expected with our Quaterly Business Growth Analysis And Development Powerpoint Presentation Slides. They will believe you are actually glad.













FAQs for Quaterly business growth analysis and development
Revenue growth rate and customer acquisition cost are your bread and butter for quarterly reports. Cash flow too - that stuff genuinely stresses me out more than it should lol. Customer lifetime value matters a ton. Don't track everything though, you'll go crazy. Maybe 5-7 metrics tops? Employee productivity and retention rates are solid picks since they actually drive those financial numbers. Market share's good if you can get reliable competitor data (big if). Compare quarter-over-quarter and year-over-year to catch real patterns instead of just noise.
So basically you wanna compare your sales to the total market size at quarter start vs end. IBISWorld has solid industry reports - pricey as hell but worth it. Calculate your market share for both periods and see what changed. Track competitors through earnings calls too. Honestly the hardest part is getting market data fast enough to actually use it. Set up Google alerts for competitor news, that helps. Oh and do this monthly instead of waiting till quarter-end - you'll catch trends way earlier. Sometimes I wonder why more companies don't do this basic math regularly.
Dude, you NEED customer feedback in those quarterly reviews. Sure, revenue's up 15% - but why? Feedback tells you if it's your new features killing it or just dumb luck. Most companies totally ignore this goldmine of data, which is crazy to me. Look for patterns in what people are saying. If everyone's complaining about the same thing, that's your next quarter's problem right there. Track sentiment scores next to your financial stuff. Short feedback bursts can predict retention issues way before they show up in the numbers.
Look, your financial numbers basically show you where to put your time and money next quarter. Revenue trends? That's how you know which products are actually hitting. Profit margins tell you if you're growing smart or just throwing cash around - honestly, nothing gets me more pumped than seeing those margins improve because it means the growth will stick. Compare everything quarter to quarter so you catch problems early. You'll spot the dead weight that needs fixing and the wins worth doubling down on. Way better than just winging it with your growth decisions.
So here's the thing - competitor analysis basically shows you if your quarterly numbers are actually decent or if everyone's having a rough time. Track what 3-5 direct competitors are doing with their growth rates and market share. That way you're not just staring at your own data wondering if you suck or if it's an industry thing (which honestly happens way too often). You'll catch trends that explain weird spikes or dips in your performance. I'd just make a simple dashboard comparing the key stuff from their quarterly reports. Way better than flying blind.
Yeah, seasonal stuff will totally mess with your quarterly numbers if you don't watch out. Holiday shopping makes Q4 retail look amazing compared to Q1, but that's not real growth - it's just Christmas. I always do year-over-year comparisons instead of quarter-to-quarter. Moving averages help smooth out those predictable ups and downs too. Honestly, half the battle is just figuring out which months are consistently weird for your business. Once you know your patterns, you can separate actual growth from the seasonal noise. Oh, and seasonally adjusted data is your friend if you can get it.
Definitely go with line charts for tracking stuff over time - revenue, customer numbers, whatever your main KPIs are. Bar charts are solid for comparing different segments or year-over-year numbers. Waterfall charts are honestly my favorite though, they show exactly what's pushing your numbers up or down between periods. Heat maps work well if you've got regional data to show. Oh, and throw in some simple percentage indicators for the obvious wins. Start with your biggest metric as the main visual, then maybe 2-3 supporting charts that fill in the gaps.
Yeah you definitely want to focus on year-over-year stuff first. Comparing Q3 2024 to Q3 2023 gives you the real picture since you're not dealing with seasonal weirdness. Like Q4 always looks crazy because of holidays, right? Quarter-to-quarter can totally mess with your head - I've seen people panic over normal dips. Pull maybe 2-3 years of data so you can actually see what's going on. YoY shows the real growth, then you can use the quarterly changes as extra context. Trust me on this one.
Start with Excel or Google Sheets - they're solid for building custom dashboards and doing your calculations. Tableau's incredible if you want fancy visualizations, though it might be overkill at first. Power BI works too. I spent way too much time making pretty charts when I first discovered Tableau, haha. For automated data pulls, check out HubSpot Analytics or Salesforce Analytics. QuickBooks works great if you're tracking financial stuff. Pick whatever plays nice with your current data setup. Honestly, just begin with spreadsheets and upgrade later when things get complicated.
Productivity metrics are honestly like having a heads up on your quarterly numbers. When you notice things slipping - fewer calls made, projects dragging on, output per hour tanking - that's usually when revenue projections start looking way too rosy. Your team literally drives the growth, so watching their performance tells you what's coming. I've seen productivity improvements predict revenue wins before they even hit the books. Track stuff like revenue per employee and task completion rates. Then tweak your forecasts based on those trends instead of scrambling later to explain why you missed targets to leadership.
Honestly, the worst mistake is obsessing over one bad quarter and freaking out. Like, businesses do this all the time - they either panic or get way too cocky from a single good period. Also watch out for cherry-picking data that makes you feel better about your decisions (we've all been there). Seasonality screws people up constantly too. You can't compare Q4 holiday sales to January and expect meaningful insights. Set consistent benchmarks and always dig into what's actually causing the changes. The numbers don't tell the whole story by themselves.
Look at your quarterly numbers to build your actual strategy - revenue, customer acquisition, operations stuff. Monthly data is just noise most of the time. I mean, I've watched teams chase shiny monthly wins while missing the bigger picture completely. Quarterly trends show what's really working vs what looks good but isn't moving the needle. Compare year-over-year too, not just quarter to quarter, because seasonal stuff will throw you off otherwise. Use all this to either back up your current plan or realize you need to pivot. Then set goals that aren't totally unrealistic for next quarter.
So macro stuff definitely messes with your quarterly numbers. Interest rates go up? People borrow less, spend less - your revenue takes a hit. Inflation's weird though - might pump up your sales numbers but then your costs spike faster than you can raise prices. Honestly, inflation is the worst because it tricks you into thinking you're doing better than you actually are. The trick is watching these big economic indicators right next to your quarterly data. That way you know if you're actually crushing it or if it's just the economy doing its thing around you.
Okay so look at your quarterly numbers and figure out which channels actually made you money - then throw more budget at those. Cut the stuff that's not working, obviously. Your hot-selling products? Push those harder next quarter. If getting new customers got more expensive, focus on keeping the ones you have instead - way cheaper that way. Also Q4 numbers are always kinda wonky with holidays and stuff, so factor that in. Don't just guess what'll work next time. Set real targets based on what actually happened, not what you hoped would happen.
So I'd break down each segment first - way easier than trying to juggle everything at once. Track the usual stuff like revenue growth and profit margins for each unit. Don't compare segments against each other though, that's kinda pointless if they're in different markets. Instead, compare each one to its own past performance and industry standards. Hunt for trends and weird outliers, figure out which segments are actually growing your business vs. the ones holding you back. Oh and definitely make scorecards for each segment - helps a ton when you're deciding where to put your money.
-
Very unique, user-friendly presentation interface.
-
Attractive design and informative presentation.