


Quarterly Business Review Framework Powerpoint Presentation Slides





Try Before you Buy Download Free Sample Product
 Impress Your
 Audience
 100%
100% Editable
 Save Hours
 of Time


Here is a content ready quarterly business review framework PowerPoint presentation to benefit the professionals overcome restrictions to run a corporate. Highlighting the important facts of this business information review PPT slides, here we have come up with readymade presentation related to your topic. In this quarterly business overview PPT templates, we have included a firm overview, financial performance, CSR, competitor’s analysis, future roadmap, client & project updates etc. You can also use this complete company summary PowerPoint sample slide with related topics like economic assessment, company evaluation, organizational study, company information analysis, enterprise audit, enterprise assessment, organizational appraisal and many more. Organizational summary is required to ensure the challenges of economic and financial performance. This is the most suitable QBR PPT designs for middle and top-level management. This professionally pre-designed quarterly business review framework presentation graphics are available to download. Our Quarterly Business Review Framework Powerpoint Presentation Slides are truly out of this world. Even the MIB duo has been keeping tabs on our team.
People who downloaded this PowerPoint presentation also viewed the following :
Content of this Powerpoint Presentation
Slide 1: This slide introduces Quarterly Business Review Framework. State Your Company Name and get started.
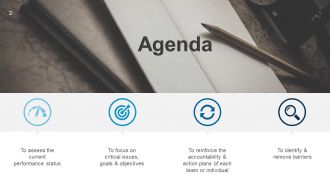
Slide 2: This is an Agenda slide. State agendas such as- To assess the current performance status, To focus on critical issues, goals & objectives, To reinforce the accountability & action plans of each team or individual, To identify & remove barriers.
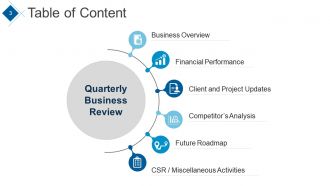
Slide 3: This slide shows Table of Content. The points inlcuded are- Quarterly Business Review, Business Overview, Financial Performance, Client and Project Updates, Competitor’s Analysis, Future Roadmap, CSR / Miscellaneous Activities.
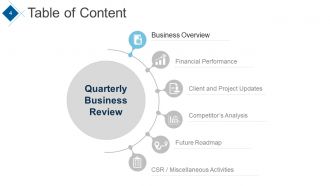
Slide 4: This slide continues Table of Content. The point highlighted is- Business Overview.
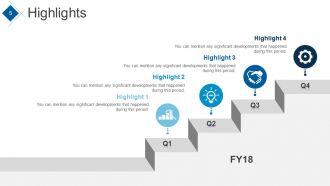
Slide 5: This slide shows Highlights. You can mention any significant developments that happened during this period.
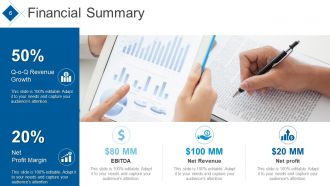
Slide 6: This slide presents the Financial Summary with the following points- Net profit, EBITDA, Net Revenue, Net Profit Margin, Q-o-Q Revenue Growth.
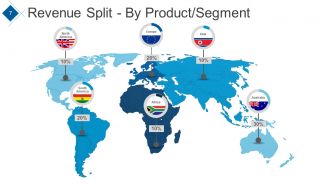
Slide 7: This slide shows Revenue Split - By Product/Segment in world map image to show global segregation.
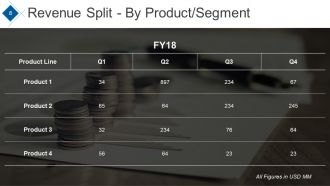
Slide 8: This slide shows Revenue Split - By Product/Segment table of different products.
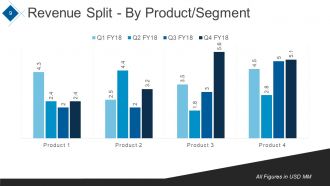
Slide 9: This slide shows Revenue Split - By Product/Segment in graph form.
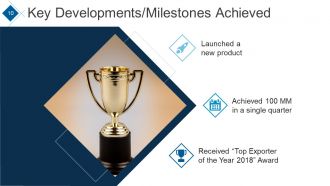
Slide 10: This slide shows Key Developments/Milestones Achieved with examples such as- Launched a new product, Achieved 100 MM in a single quarter, Received “Top Exporter of the Year 2018” Award.
Slide 11: This slide shows Table of Content highlighting Financial Performance.
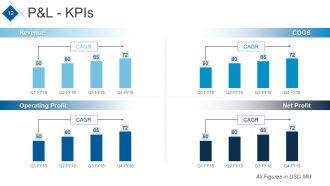
Slide 12: This slide presents P&L - KPIs CAGR graphs of Revenue, Operating Profit, COGS, Net Profit.
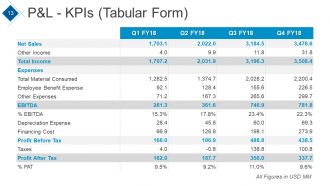
Slide 13: This slide presents P&L - KPIs CAGR in tabular form.
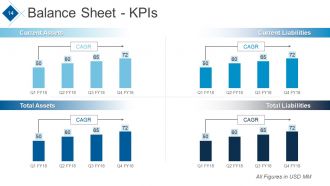
Slide 14: This slide shows Balance Sheet - KPIs showing- Current Assets, Total Assets, Current Liabilities, Total Liabilities.
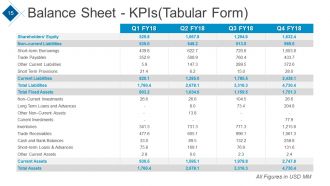
Slide 15: This slide shows Balance Sheet - KPIs in tabular form.
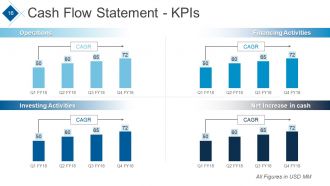
Slide 16: This slide showcases Cash Flow Statement - KPIs graphs of Operations, Investing Activities, Financing Activities, Net Increase in cash.
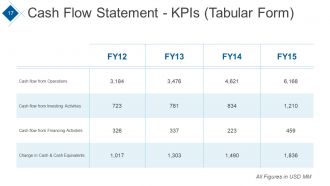
Slide 17: This slide showcases Cash Flow Statement in tabular form.
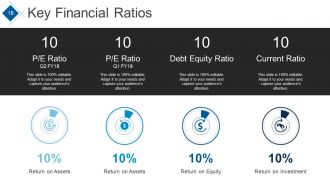
Slide 18: This slide presents Key Financial Ratios of- P/E Ratio, Debt Equity Ratio, Current Ratio with- Return on Assets, Return on Equity, Return on Investment, Return on Assets.
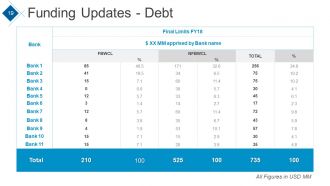
Slide 19: This slide presents Funding Updates - Debt in tabular form.
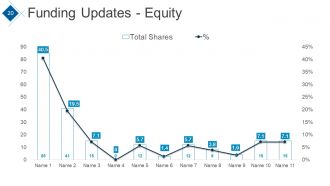
Slide 20: This slide presents Funding Updates - Equity in graph form.
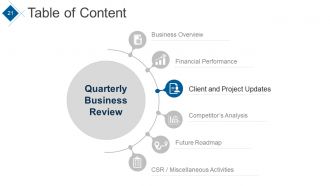
Slide 21: This slide showcases Table of Content with the highlighted point- Client and Project Updates.
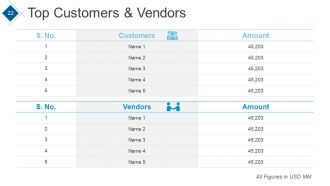
Slide 22: This slide shows the table for Top Customers & Vendors.
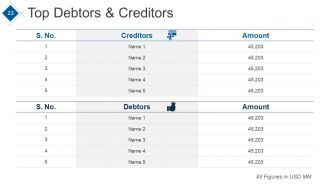
Slide 23: This slide shows the table for Top Debtors & Creditors.
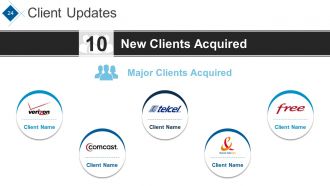
Slide 24: This slide presents Client Updates with- New Clients Acquired, Major Clients Acquired.
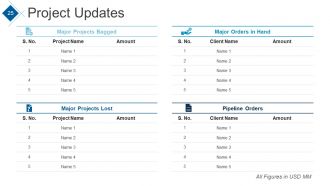
Slide 25: This slide showcases Project Updates table.
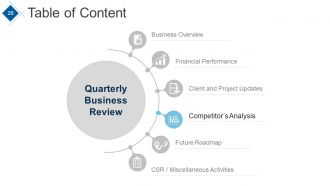
Slide 26: This slide showcases Table of Content with the highlighted point- Competitor’s Analysis.
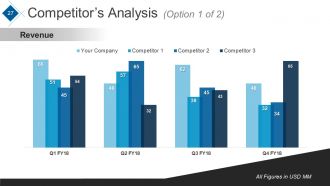
Slide 27: This slide presents Competitor’s Analysis graph of-0 Revenue.
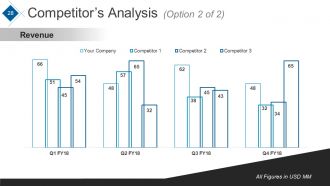
Slide 28: This slide presents another Competitor’s Analysis graph of-0 Revenue.
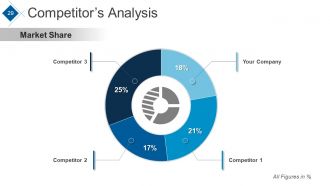
Slide 29: This slide presents Competitor’s Analysis Market Share.
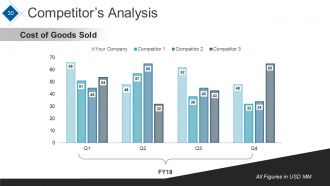
Slide 30: This slide presents Competitor’s Analysis graph of- Cost of Goods Sold.
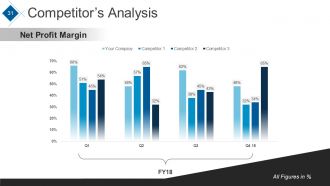
Slide 31: This slide presents Competitor’s Analysis graph of- Net Profit Margin.
Slide 32: This is Coffee Break Time slide to halt. You may change the slide content as per need.
Slide 33: This slide shows Benchmarking Competitive Intelligence in terms of High and Low.
Slide 34: This slide presents Table of Content with the highlighted point- Future Roadmap.
Slide 35: This slide displays 30-60-90 Day Plan with the following points- Watch product & customer videos, Review the opening/introductory pitch & related call scripts, Review poor follow-up emails & good email tips, Review & practice current sales pitch, Master the sales pitch with different persons and industries, Master giving an overview demo, Learn additional details about solutions, Learn the add-on details about business and products to gain expertise and confidence.
Slide 36: This slide shows Light Bulb With Time Planning Ideas image with text boxes.
Slide 37: This is a Product Roadmap Layout slide.
Slide 38: This is the second slideProduct Roadmap Layout.
Slide 39: This slide presents a Product Roadmap in Swimlane form.
Slide 40: This slide shows Phases of Implementation.
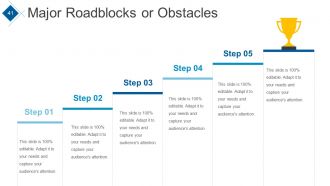
Slide 41: This slide showcases Major Roadblocks or Obstacles faced.
Slide 42: This slide showcases another variation image Major Roadblocks or Obstacles faced.
Slide 43: This slide displays SWOT Analysis For Personal Skills.
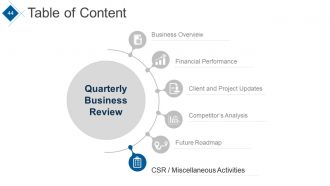
Slide 44: This slide showcases Table of Content with the highlighted point- CSR / Miscellaneous Activities
Slide 45: This slide shows Corporate Social Responsibility. State specifications etc. here.
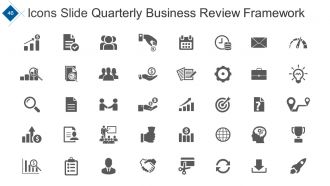
Slide 46: This is an Icons Slide Quarterly Business Review Framework. Use them as per need.
Slide 47: This slide is titled Additional Slides to move forward.
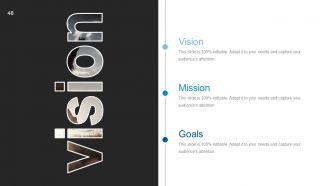
Slide 48: This is a Vision slide with Mission and Goals. State them here.
Slide 49: This is Our Team slide with names, deisgnation and image boxes.
Slide 50: This is an About Us slide. State team/company specifications etc. here.
Slide 51: This is My Goals slide. State goals etc. here.
Slide 52: This is a Comparison slide to show comparison of entities etc.
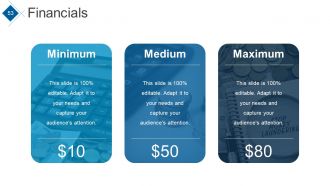
Slide 53: This is a Financials score slide to show financial aspects in terms of medium, minimum maximum.
Slide 54: This is a Quotes slide to convey company beliefs, messages etc.
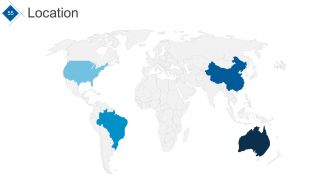
Slide 55: This is a Location slide to show global presence, growth etc.
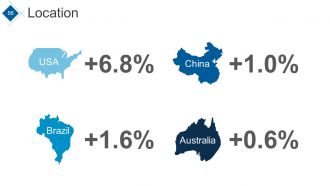
Slide 56: This is a Location slide showing different countries with percentage. State growth etc. in percentage here.
Slide 57: This is a Dashboard slide to show metrics, Kpis etc.
Slide 58: This is an Important Notes slide to show important/highlighted information etc.
Slide 59: This slide shows a Timeline. State highligting factors etc. here.
Slide 60: This slide also presents a Timeline. State highligting factors etc. here.
Slide 61: This slide too showcases a Timeline. State highligting factors etc. here.
Slide 62: This is a Target image slide. State targets, goals, etc. here.
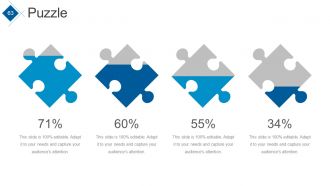
Slide 63: This is a Puzzle image slide. State information, specificiations etc. here.
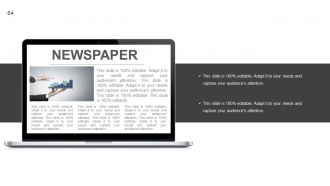
Slide 64: This is a Newspaper image slide. State news, events, etc. here. You can change the slide contents as per need.
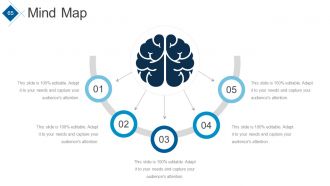
Slide 65: This is a Mind map image slide. State information, specificiations etc. here.
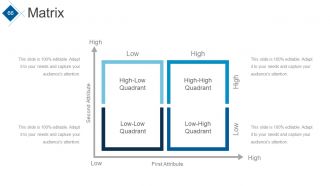
Slide 66: This is a Matrix image slide. State information, specificiations etc. in terms of high-low here.
Slide 67: This is a Lego image slide. State information, specificiations etc. here.
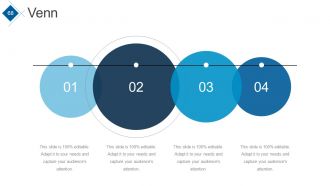
Slide 68: This is a Venn diagram image slide. State information, specificiations etc. here.
Slide 69: This slide is titled Our Charts to move forward.
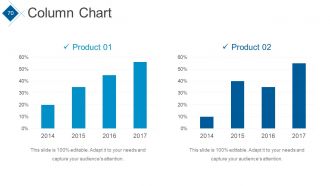
Slide 70: This slide presents a Column Chart for entity/product comparison.
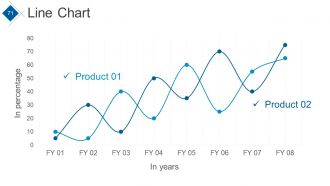
Slide 71: This slide presents a Line Chart for entity/product comparison.
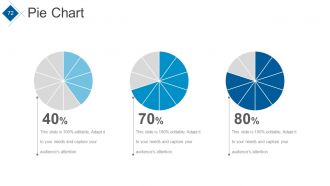
Slide 72: This slide presents a Pie Chart for entity/product comparison.
Slide 73: This slide presents a Bar Chart for entity/product comparison.
Slide 74: This slide presents an Area Chart for entity/product comparison.
Slide 75: This slide presents a Scatter Chart for entity/product comparison.
Slide 76: This slide presents a Radar Chart for entity/product comparison.
Slide 77: This slide presents a Combo Chart for entity/product comparison.
Slide 78: This is a Contact Us slide with Address# Street number, city, state, Email address, Contact numbers.
Slide 79: This is a Thank You slide for acknowledgement.
Quarterly Business Review Framework Powerpoint Presentation Slides with all 79 slides:
Put your thoughts on the line. Our Quarterly Business Review Framework Powerpoint Presentation Slides will take up the challenge.
-
Quarterly Business Review Framework Q1 FY18
-
Agenda
-
Quarterly Business Review
-
Quarterly Business Review
-
Highlights
-
Financial Summary
-
Revenue Split By Product Segment
-
Revenue Split By Product Segment
-
Revenue Split By Product Segment
-
Key Developments Milestones Achieved
-
Quarterly Business Review
-
P L KPIs
-
P L KPIs Tabular Form
-
Balance Sheet KPIs
-
Balance Sheet KPIs Tabular Form
-
Cash Flow Statement KPIs
-
Cash Flow Statement KPIs Tabular Form
-
Key Financial Ratios
-
Funding Updates Debt
-
Funding Updates Equity
-
Quarterly Business Review
-
Top Customers Vendors
-
Top Debtors Creditors
-
Client Updates
-
Project Updates
-
Quarterly Business Review
-
Competitor s Analysis Option 1 of 2
-
Competitor s Analysis Option 2 of 2
-
Competitor s Analysis
-
Competitor s Analysis
-
Competitor s Analysis
-

Coffee Break Time
-
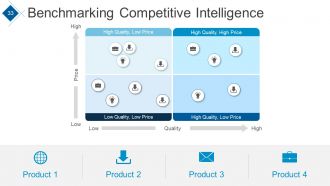
Benchmarking Competitive Intelligence
-
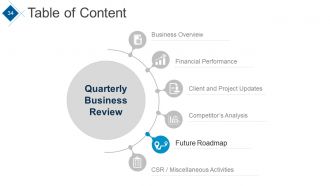
Quarterly Business Review
-
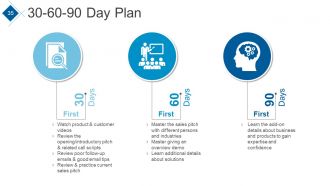
30 60 90 Day Plan
-
Light Bulb With Time Planning Ideas
-
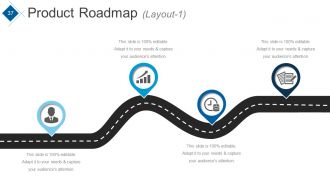
Product Roadmap Layout 1
-
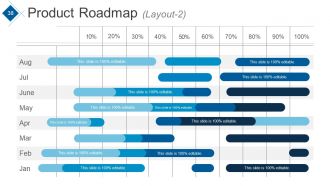
Product Roadmap Layout 2
-
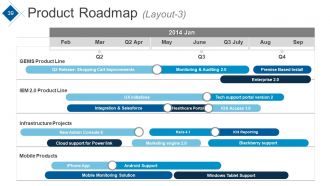
Product Roadmap Layout 3
-
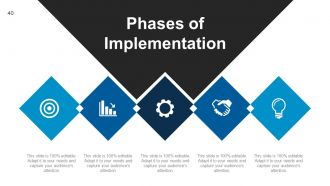
Phases of Implementation
-
Major Roadblocks or Obstacles
-

Major Roadblocks or Obstacles
-

SWOT Analysis for Personal Skills
-
Quarterly Business Review
-

Corporate Social Responsibility
-
Icons Slide Quarterly Business Review Framework
-

Additional Slides
-
Vision
-
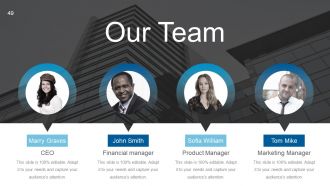
Our Team
-
About Us
-
My Goal
-
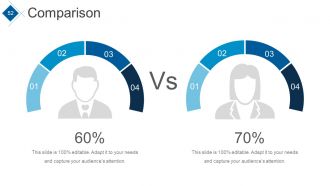
Comparison
-
Financials
-

Quarterly Business Review Framework Slid
-
Location
-
Location
-

Dashboard
-
Important Notes
-
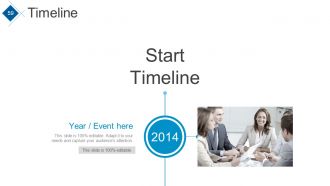
Timeline
-
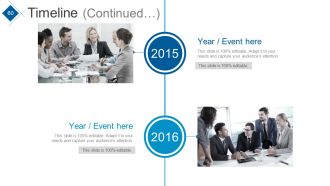
Timeline Continued
-
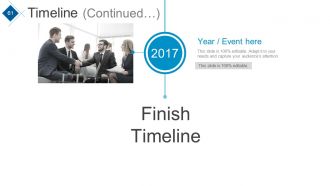
Timeline Continued
-
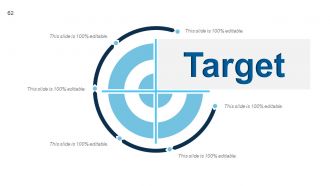
Target
-
Puzzle
-
Quarterly Business Review Framework Slid
-
Mind Map
-
Matrix
-

Lego
-
Venn
-

Our Charts
-
Column Chart
-
Line Chart
-
Pie Chart
-
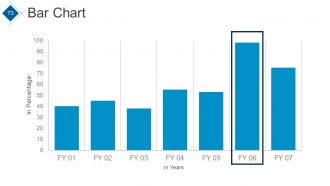
Bar Chart
-
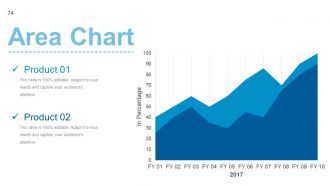
Area Chart
-
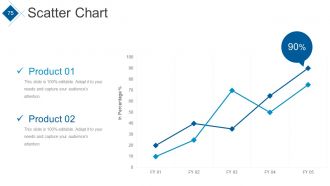
Scatter Chart
-
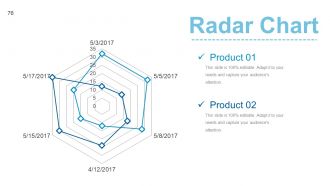
Radar Chart
-

Combo Chart
-
Contact Us
-

Thank You
FAQs for Quarterly Business Review Framework
Honestly, stick to what actually matters for your business - revenue growth, customer acquisition costs, churn rates, and gross margins. Those are your bread and butter. Pipeline health and conversion rates help you see what's coming down the road. Customer satisfaction scores keep you honest too (learned that one the hard way). Don't get sucked into vanity metrics that just make pretty slides but won't help you make real decisions. Operational stuff like team productivity and delivery timelines matter, but keep your total list to maybe 8-12 metrics max. Any more than that and you're just creating noise for your next quarter's planning.
Honestly, visual aids will save your QBR. Nobody wants to stare at spreadsheets for an hour - charts and graphs make everything way easier to digest. People actually stay awake when they can see trends instead of drowning in raw data. Plus discussions move faster since everyone's looking at the same thing. I learned this the hard way after watching executives zone out during my first few presentations. Keep your slides clean though, and stick with consistent colors. Oh, and don't go crazy with animations - that's just distracting.
Pick 3-5 objectives max that actually address your biggest gaps from this quarter - not random stuff that sounds good. Be specific too. Like "boost customer retention 15%" beats "make customers happier" any day. Each one needs an owner and monthly check-ins or it'll just collect dust. Honestly, most teams bite off way more than they can chew here. Stay realistic about what you can actually handle while still pushing forward. Oh, and draft these before your QBR meeting hits. You'll thank yourself later when you're refining instead of scrambling to think of goals on the spot.
Get everyone involved in planning instead of just showing up with their own numbers. Do breakout sessions where they actually work on problems together - like when acquisition costs spike and sales points fingers at marketing while marketing blames product (classic, right?). Build in time for departments to directly question each other, not just report upward to leadership. Switch the whole vibe from "here's our update" to "let's fix this mess together." Oh, and assign follow-ups that need two teams collaborating. Forces them to keep talking after the meeting ends, which honestly is where the real work happens anyway.
PowerPoint or Google Slides are your best bet for the actual presentation - execs expect that format and it's easy to share around. For the data viz though, definitely use Tableau or Power BI since they'll pull live numbers and look way cleaner than Excel charts. You'll still need Excel for the nitty-gritty analysis work behind everything. Clean data is honestly half the battle here! Canva's pretty solid if you want your slides to not look completely soul-crushing corporate. Keep it simple tool-wise so you're focused on the actual insights instead of fighting with random software bugs.
Start your next QBR with an "Actions from Last Quarter" section - seriously, this stuff vanishes into thin air otherwise. Go through each item and mark it complete, delayed, or dead. People need to see you're actually paying attention to what they said. I'd keep a simple doc running between meetings so nothing gets lost. Then work any ongoing issues into your current discussion. Honestly, half the value of QBRs is just showing you listen and follow up. Super simple but makes a huge difference in how seriously people take these reviews.
Honestly, competitive analysis in QBRs is like getting slapped with reality - shows where you actually are vs where you think you are. Track what your main competitors did that quarter. Pricing moves, market share changes, new product launches. I get weirdly paranoid reading these sections but whatever, it's useful! You'll spot threats before they wreck you and find opportunities you're blind to. The hard part? Being brutally honest about what they're crushing you on. Pick 3-5 direct competitors and track them every quarter - that's how you catch patterns instead of just random noise.
Don't just dump customer data in one sad slide - that's painful to watch. Spread those insights throughout your whole QBR instead. Like, take your customer pain points and tie them directly to roadmap decisions. Show how user behavior actually changed your pricing. Connect retention numbers to why you invested more in support. Short version: make customer insights explain the "why" behind every strategic move you made. An NPS score sitting there with zero context? Useless. But when you show how that feedback drove real decisions, now you've got something worth talking about.
Okay so first thing - send them a quick survey beforehand asking what they actually want to talk about. Gets them invested from the start. Then during the meeting, ditch the endless slide deck (seriously, we've all suffered through enough of those). Mix in some polls or small group discussions instead. Also, ask different people to jump in and share what's going well or what's driving them crazy with their teams. Way better than you just talking the whole time. Oh and this is key - save like 25-30% of your time for actual discussion and planning next steps. People care more when they're helping build the agenda, not just sitting there listening to you present.
Most places do them quarterly, which is probably where you should start. But honestly? It totally depends on how crazy your industry is. We switched to monthly last year because things were changing so fast that quarterly felt pointless - like reviewing ancient history. Some companies I know do them every six months if they're in super stable markets. The trick is figuring out if you're catching problems early enough or just talking about stuff that's already old news. Try quarterly first, then adjust if it feels too slow or too much. Don't just do meetings for the sake of meetings.
Okay so the biggest thing is avoiding the data dump trap - you know how some people just vomit every single metric they have? Pick like 3-5 that actually tell a story. Also don't make it all about what already happened. Those charts look nice but spend half your time talking about what's next and how you're adjusting. Oh, and this might sound obvious but keep it solution-focused when stuff goes wrong. I've seen too many of these turn into blame sessions and then suddenly everyone's "too busy" for the next review. Nobody wants that drama.
Look, nobody wants to sit through another PowerPoint full of charts that mean nothing. Data storytelling basically means you're walking execs through what actually happened this quarter - like you're explaining it over drinks, not reading from a script. Connect your numbers to real business stuff that matters. Short punches work: "Sales dropped 15% in Q2." Then explain why and what you're doing about it. Honestly, most QBRs are just data vomit that people forget five minutes later. Build toward decisions they can actually make, not just pretty graphs. Guide them through the story - what went wrong, what went right, where you're heading next.
Okay so for your QBR takeaways, hit these three things: how you did against your goals, what caught you off guard this quarter, and your top priorities for next quarter. Don't just rehash everything - people already heard all that! Focus on the "so what" moments that actually help with decisions. Be super clear about what winning looks like going forward and what you need to get there. Honestly, the best takeaways answer this question: "What from today will matter when we're planning three months from now?" That's really what people need to walk away with.
Okay so right after your QBR ends, get everyone to nail down specific action items with actual people's names attached - not just "the marketing team will handle this." That's where most of these meetings die, honestly. Break everything into three buckets: stuff for the next 30 days, this quarter, and longer strategic things. Make someone own a shared doc to track it all. Here's the key part though - send that action plan out within like 48 hours max, otherwise people forget half of what you discussed. Then schedule check-ins at 30 and 60 days or nothing will actually happen.
Honestly, the best way is just sending out quick surveys after each QBR - like 2 minutes max asking people to rate how relevant and actionable everything was. But here's what really matters: did anyone actually DO the stuff you talked about last quarter? That's your real test right there. During meetings, I always watch if people are engaged or doom-scrolling their phones. Quick feedback form sent within 24 hours works great. Also track if business metrics actually improve in the weeks after - sometimes these meetings feel productive but nothing changes. Short surveys beat long ones every time.
-
Very well designed and informative templates.
-
Top Quality presentations that are easily editable.