


Quarterly business review agenda and objectives powerpoint presentation with slides






Try Before you Buy Download Free Sample Product
 Impress Your
 Audience
 100%
100% Editable
 Save Hours
 of Time


Get your hands on the content ready quarterly business review agenda and objectives PowerPoint presentation to analyse business results. Create a plan for the upcoming quarter and beyond using executive business review PowerPoint presentation. Compare the last quarter number with previous quarters and review the team’s performance with the help of quarterly business review agenda and objectives PPT deck. Analyse whether the performance was better or poor and develop strategies to improve the performance for the next quarter. SlideTeam presents you a complete presentation deck on quarterly business review agenda and objectives that includes slides on the 90-day action plan, value proposition, return on investment analysis, product usage, last 90-day results and more. Give a complete picture to the team members at glance using business quarter review PPT templates. With these professionally designed content ready templates, you can identify the winning strategies, understand the bottlenecks, spot new competitors in the market and more. Download readymade quarterly business review agenda and objectives presentation ppt to encourage the team members to meet the targets for the next quarter. Investigate every facet of the issue with our qbr template ppt With Slides. Judge it from every angle.
People who downloaded this PowerPoint presentation also viewed the following :
Content of this Powerpoint Presentation
Slide 1: This slide introduces Quarterly Business Review. State Your Company Name, Agenda and Objectives and begin with clarity.
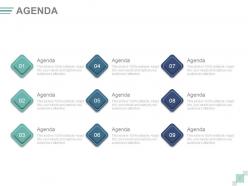
Slide 2: This is an Agenda slide. State your agendas here.
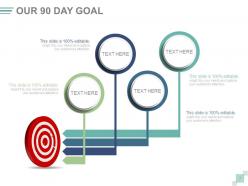
Slide 3: This slide presents Our 90 day Goal.
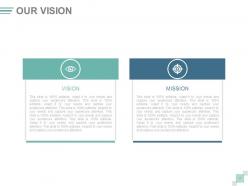
Slide 4: This slide presents Our Vision. State your vision here.
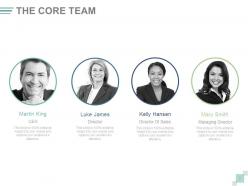
Slide 5: This is The Core Team slide with name, designation and image boxes.
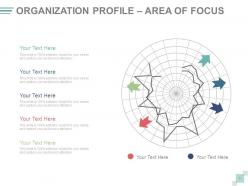
Slide 6: This slide presents Organization Profile – AREA OF FOCUS.
Slide 7: This slide shows Completed, Outstanding And New Items to be stated.
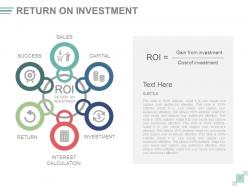
Slide 8: This slide showcases Return On Investment with- Capital, Sales, Success, Return, Investment, Interest Calculation.
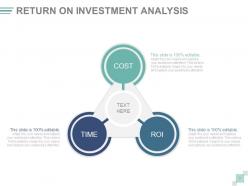
Slide 9: This slide presents Return On Investment Analysis with- COST, ROI, TIME.
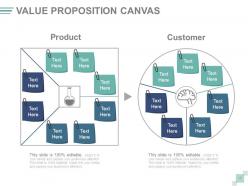
Slide 10: This slide shows Value Proposition Canvas with circular imagery and text boxes displaying PRODUCT and CUSTOMER aspects.
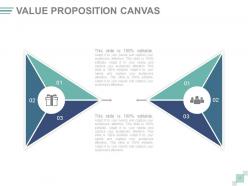
Slide 11: This slide also shows Value Proposition Canvas.
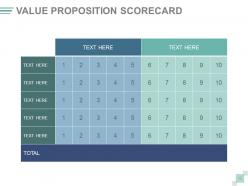
Slide 12:' This slide displays a Value Proposition Scorecard.
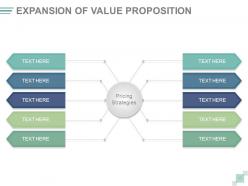
Slide 13: This slide presents Expansion Of Value Proposition with the subheading- Pricing Strategies.
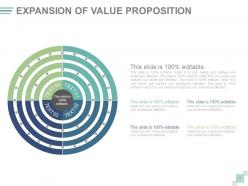
Slide 14: This slide shows Expansion of Value Proposition with imagery and text boxes.
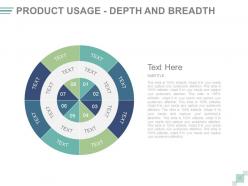
Slide 15: This slide presents Product Usage - Depth And Breadth.
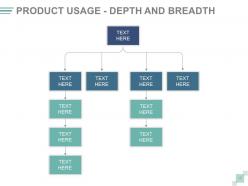
Slide 16: This slide presents another variation of Product Usage - Depth And Breadth.
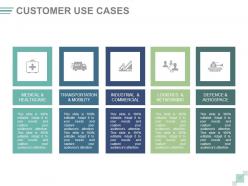
Slide 17: This slide showcases Customer Use Cases with the following points- Medical & HelathCare, Transportation & Mobility, Industrial & Commercial, Logistics & Networking, Defence & Aerospace.
Slide 18: This slide presents the Phases Of Implementation of business etc.
Slide 19: This slide presents another variationof Phases Of Implementation of business etc.
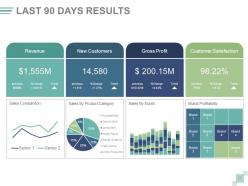
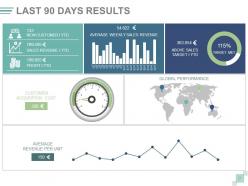
Slide 20: This slide presents LAST 90 DAYS RESULTS of a particular project/business etc.
Slide 21: This slide presents another variation of LAST 90 DAYS RESULTS of a particular project/business etc.
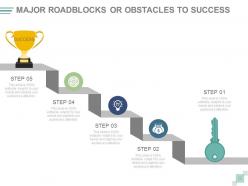
Slide 22: This slide showcases Major Roadblocks Or Obstacles To Success.
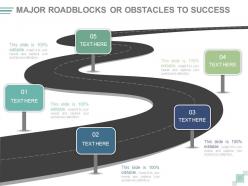
Slide 23: This slide showcases roadmap image form of Major Roadblocks Or Obstacles To Success.
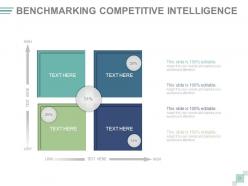
Slide 24: This slide showcases Benchmarking Competitive Intelligence in terms of HIGH and LOW.
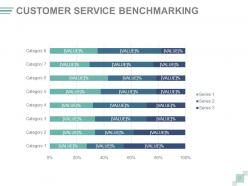
Slide 25: This slide shows Customer Service Benchmarking in terms of category and percentage in bar graph form.
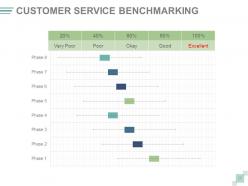
Slide 26: This slide shows Customer Service Benchmarking in terms of- Very Poor, Poor, Okay, Good, Excellent.
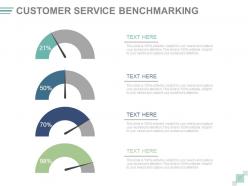
Slide 27: This slide displays Customer Service Benchmarking with metrics image.
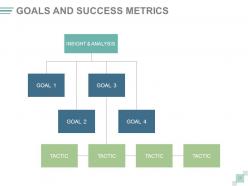
Slide 28: This slide showcases Goals and Success Metrics. State them here.
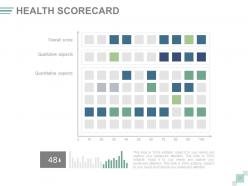
Slide 29: This slide showcases a Health Scorecard.
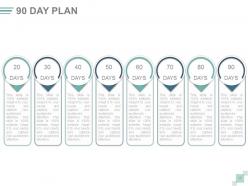
Slide 30: This slide presents a 90 DAY PLAN. State your plan here.is 100% editable. Adapt it to your needs and capture your audience's attention. This slide is 100% editable. Adapt it to your needs and capture your audience's attention.
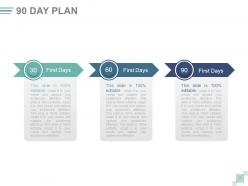
Slide 31: This slide shows a 90 DAY PLAN divided into 30, 60, 90. State your plan here.
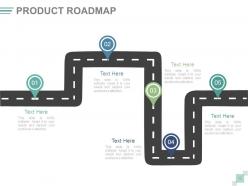
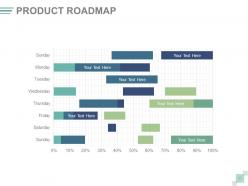
Slide 32: This is a Product Roadmap slide. State growth highlights, milestones achieved here.
Slide 33: This is a Product Roadmap slide shown in Swimlane form.
Slide 34: This slide is titled Additional Slides to proceed forward. You can change/alter the slide content as per need.
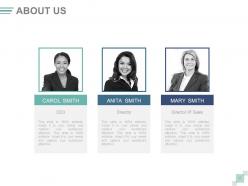
Slide 35: This is an About Us slide. State company/team specifications here.
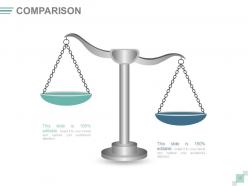
Slide 36: This slide showcases Comparison of two entities in a creative form.
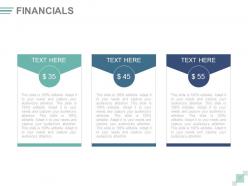
Slide 37: This is a Financial score slide. State financial aspects, stats etc. here.
Slide 38: This is a Quotes slide. State business message, beliefs etc. here.
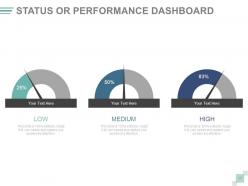
Slide 39: This is a Status or Performance Dashboard slide to show growth factors in terms of High, Low, Medium.
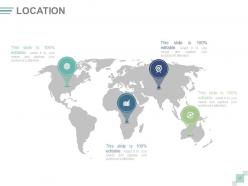
Slide 40: This is Location image slide of world map image to show global growth, presence etc.
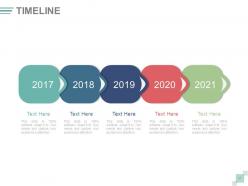
Slide 41: This is a Timeline slide to show evolution, journey, growth, milestones etc.
Slide 42: This slide showcases Post It Notes to be displayed. Show events, important piece of information, events etc. here.
Slide 43: This slide showcases Newspaper image. Show events, important piece of information, events etc. here.
Slide 44: This is a Puzzle image slide to show information, specifications etc.
Slide 45: This is a Target image slide to show targets, goals, information, aspirations etc.
Slide 46: This is a Venn Diagram image slide to show information, specifications etc.
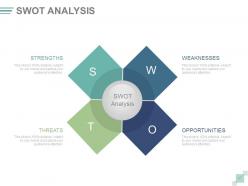
Slide 47: This is a SWOT Analysis slide.
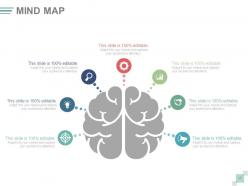
Slide 48: This is a Mind map image slide to show information, segregation, specifications etc.
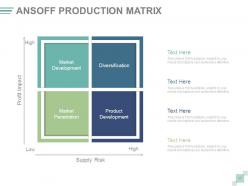
Slide 49: This is an ANSOFF Product Matrix slide to show information, specifications etc.
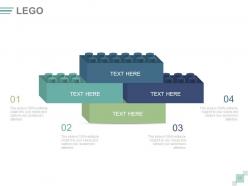
Slide 50: This is a Lego Blocks Diagram slide to show information, specifications etc.
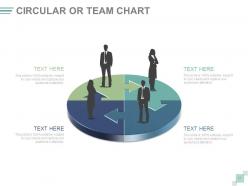
Slide 51: This is a Cicular or Team Chart slide to show information, specifications etc.
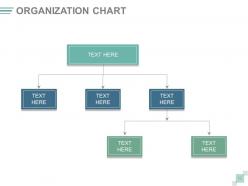
Slide 52: This is an Organization Chart in hierarchy form to state team specifications etc.
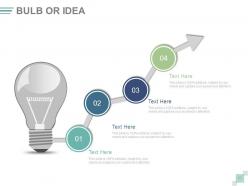
Slide 53: This is a Bulb or Idea slide to show information, innovative specifications etc.
Slide 54: This slide shows a Magnifying glass image with text boxes. State information etc. here.
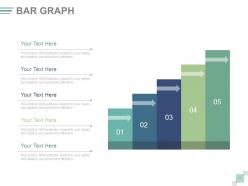
Slide 55: This slide presents a Bar Graph for showcasing product/company growth, comparison etc.
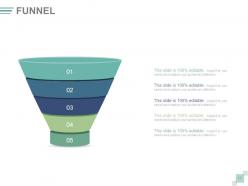
Slide 56: This slide displays a Funnel image. State information, funneling aspects etc. here.
Slide 57: This is a Thank You slide with Address# street number, city, state, Contact Numbers, Email Address.
Quarterly business review agenda and objectives powerpoint presentation with slides with all 57 slides:
Convince folks that you can conquer adversity with our Quarterly Business Review Agenda And Objectives Complete Powerpoint Deck With Slides. Be an example of grit and determination.



FAQs for Quarterly business review agenda and objectives powerpoint
Start with your quarterly metrics - actual numbers, not fluffy stuff. Show what went well and what sucked. Financial breakdown is crucial (revenue, costs, margins). Next quarter's priorities should be crystal clear. Honestly, I'd definitely add a competitive landscape slide because execs eat that up every time. Use visuals when you can - nobody wants walls of text. Oh, and don't forget a resource/roadblock slide where they can actually help you out. Keep it tight and focused. You're basically proving you owned this quarter while setting realistic expectations for what's ahead.
Look, nobody wants to sit through spreadsheets of numbers for an hour - your brain just checks out. Charts and graphs make everything click instantly. People can actually see trends and spot problems without squinting at data rows. Plus visuals help you tell the real story of your quarter, like how you went from that messy April to crushing your goals by June. I'd stick to maybe 3-4 solid charts that back up your main points. Way better than drowning everyone in numbers. Your audience will remember the presentation instead of forgetting it five minutes later.
Honestly, start by digging into what you've actually hit before - can't make realistic goals without that baseline. I go for the 80/20 thing now: targets that stretch you but you can nail about 80% of the time. Made the mistake of setting crazy ambitious numbers once and it just crushed everyone's morale. Break the big stuff into monthly chunks so you're not flying blind for three months straight. Your team needs to help build these targets since they're doing the work anyway. Bring last quarter's numbers to your next QBR and get everyone's input - way better than just dictating from the top. You'll actually get people invested that way.
Know your audience, seriously. Execs want the big picture stuff - revenue numbers, strategic wins, don't bog them down with operational details. Department heads? They're looking for their team's KPIs and what resources they need. Individual contributors actually care about how their projects tied into company goals. I've watched so many QBRs crash and burn because someone pitched technical specs to the C-suite or gave a sales presentation to engineers - it's painful. Make different versions of your deck, or at least switch up your talking points. Quick test: what decisions will these people make after hearing this info?
Start with the big three: ARR growth, customer acquisition cost, and churn. Those tell your whole growth story right there. I'd also toss in gross margins and sales cycle length - executives eat that operational stuff up. NPS and product adoption give you a peek into next quarter's performance, which is honestly super valuable when you're trying to forecast. But seriously, don't go overboard with charts. Pick maybe 5-7 metrics that actually matter for decisions. The real trick? You've gotta explain WHY numbers changed, not just show fancy visuals. Trust me on this one.
Here's the thing - don't let people walk out without real action items. While everyone's still in the room, turn those insights into actual tasks with names and dates attached. Skip the vague "improve customer satisfaction" nonsense (honestly, that drives me crazy). Instead: "Sarah redesigns onboarding by March 15th" or "test new pricing with 50 customers this quarter." Put everything in a shared doc and set up monthly check-ins. Otherwise you've just burned hours making pretty slides that'll collect digital dust. The follow-up is what separates useful QBRs from total time-wasters.
So for competitive analysis in your QBR, you basically want to show where you stack up against everyone else. Cover stuff like pricing changes, new product launches, market share moves - anything big your competitors did that quarter. Executives actually pay attention during this part (rare, I know). The trick is tying it directly to your numbers. Like if you lost deals, explain why. Won some back? What changed. Don't just say "Company X is crushing it" - bring real examples and data. Oh, and maybe prep a few extra slides because they always ask follow-up questions on this section.
Dude, try Mentimeter or Slido for live polling - way better than watching people zone out during presentations. Breakout rooms help too if you're doing it virtually. Miro's solid for collaborative stuff where everyone can throw ideas on a whiteboard at once. Honestly? Most QBRs are just PowerPoint torture sessions. Even something basic like a shared Google doc for real-time feedback makes a huge difference. I'd start with just one interactive thing and see how it goes. Your team will actually pay attention for once instead of scrolling their phones under the table.
Honestly, the worst thing you can do is just vomit data all over them without any story. Like, nobody cares about your 47 different metrics if they don't know what it means for the business. Don't forget the "so what" part - that's where the magic happens. Most QBRs I've sat through are basically fancy status reports with zero actual insights. Oh, and don't just celebrate the wins. Talk about what bombed and how you're fixing it. Seriously though, practice your damn presentation first. Nothing's more painful than watching someone wing it through slides they've never seen before.
QBRs basically force everyone to sit in a room and actually talk about what they're doing - which sounds obvious but rarely happens otherwise. Marketing can finally see if their campaigns are moving sales numbers. Product delays? Now customer success knows why their metrics look weird. Each team needs to connect their wins back to company goals though, not just celebrate random departmental stuff. Otherwise it's just show-and-tell. The real magic is catching those disconnects before they snowball into actual problems. Honestly beats most other meetings by a mile.
Ditch the boring spreadsheets and turn your numbers into actual visual stories. Dashboard slides work great - make your key metrics look like scorecards. Waterfall charts are clutch for showing how you went from last quarter's revenue to this one. Before/after comparisons hit different too, especially for market share stuff. Honestly, infographics make everything more digestible than walls of data. Don't dump every number you have on people though. Pick your top 2-3 metrics and make those shine instead of overwhelming everyone with analysis paralysis.
Don't let it turn into another boring slide deck where everyone's checking their phones. Get people actually talking - ask specific folks direct questions, throw in some breakout sessions. I learned this the hard way after watching way too many people zone out during mine. Mix up who presents different sections so it's not just you droning on for an hour. Short sentences work. Leave real time for Q&A at the end, not just "any questions?" when you're already packing up. Honestly, if people feel like they're contributing instead of just sitting there, you'll actually get useful feedback instead of polite nods.
Definitely get those action items written down within a day or two - memories get fuzzy fast. Send everyone a recap email with the main decisions and who's doing what next quarter. Trust me, wait too long and people just delete it without reading. Also schedule those follow-up meetings that inevitably come up during QBRs (there's always something that needs a deeper dive, right?). Update your project trackers with the new deadlines. Oh, and set yourself reminders to check in mid-quarter - otherwise stuff just sits there until the next review rolls around.
Honestly, just treat the QBR feedback like your blueprint for next quarter. What worked? What bombed? Build Q2 around those lessons. Stakeholder input is pure gold - they'll straight up tell you what they actually need. Those "what surprised you" comments always catch the real issues nobody wants to admit upfront. When they suggest changes to resources or processes, listen. Don't just nod and forget about it later. Turn their feedback into actual action items for your quarterly planning. I've seen too many teams waste great insights because they didn't follow through.
Honestly, the worst part is always data that doesn't match up and people walking in totally unprepared. Send your agenda plus key numbers a week early - gives everyone time to actually look at it. Stick to maybe 3-5 big outcomes instead of drowning in every metric you've got. I learned this the hard way after sitting through a brutal 3-hour meeting that felt like we were mining for data treasure or something. Get someone to watch the clock too. These things always run over, but you'll actually walk away with real action items if you stay focused.
-
Excellent work done on template design and graphics.
-
Excellent Designs.