


Quarterly sales performance review powerpoint presentation with slides





Try Before you Buy Download Free Sample Product
 Impress Your
 Audience
 100%
100% Editable
 Save Hours
 of Time


To leave a lasting impression with your quarterly sales performance review PowerPoint presentation, you off course need a good PPT example. Taking this into account here we have come up with a readymade PPT sample file to help you look back and thoroughly do performance management, performance review or performance evaluation for future success. Going further, using our qbr marketing presentation deck you can set the tone of a sales meeting to discuss next quarter plans so as to ensure efficient business goals achievement. Best part here is that you can apply our PowerPoint slide deck for your organizational development by portraying various sales data relations and methods to trim down operational costs. Not finished yet, our creative template designs like quarterly pipeline summary, sales cycle, quarter track record, weekly/quarterly sales summary etc. prove handy to address all significant concepts linked to an operational review meeting. Conclusion here is that if you want everything just right in your next quarterly performance review PPT slide show, then you should not look beyond this exclusive PPT sample. Investigate every clue with our Quarterly Sales Performance Review Complete Powerpoint Deck With Slides. Establish the interplay of events.
People who downloaded this PowerPoint presentation also viewed the following :
Content of this Powerpoint Presentation
Slide 1: This slide presents Quarterly Sales Performance Review. State your company name and continue.
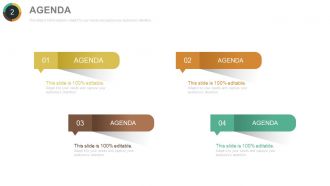
Slide 2: This slide shows your company Agenda. Add it here.
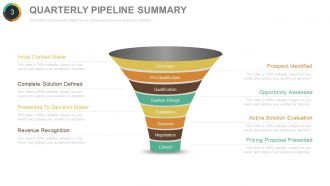
Slide 3: This slide presents Quarterly Pipeline Summary with the following stages- Discovery, Pre-Qualification, Qualification, Solution Design, Evaluation, Decision, Negotiation, Closed. It also shows the following steps- Prospect Identified, Opportunity Assessed, Active Solution Evaluation, Pricing Proposal Presented, Initial Contact Made, Complete Solution Defined, Presented To Decision Maker, Revenue Recognition.
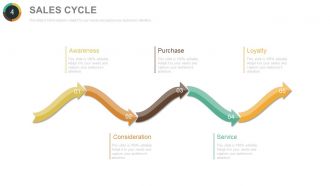
Slide 4: This slide presents Sales Cycle in a flow diagram form with the following stages- Awareness, Consideration, Purchase, Service, Loyalty.
Slide 5: This slide shows Weekly/Quarterly Sales Summary with Total Sales.
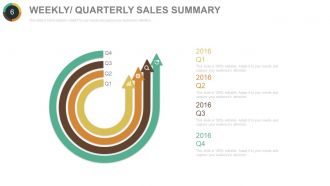
Slide 6: This slide also shows Weekly/Quarterly Sales Summary.
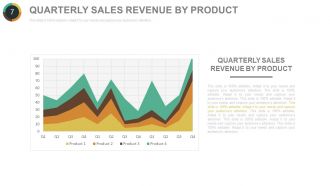
Slide 7: This slide displays Quarterly Sales Revenue By Product graphically.
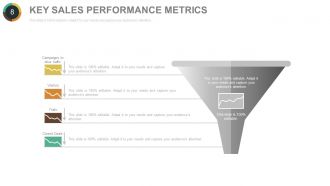
Slide 8: This slide shows a funnel image stating Key Sales Performance Metrics. These metrics include- Trials, Closed Deals, Visitors, Campaigns to drive traffic.
Slide 9: This slide presents Quarter Track Record in charts and graphs.
Slide 10: This slide shows Opportunity Timeline. You can add the relevant data such as milestones, journey etc. in this timeline and make use of it.
Slide 11: This slide shows Opportunity Score matrix. We have provided few text boxes for you to put relevant data.
Slide 12: This slide also shows Opportunity Score matrix with the following four points- Qualify (Sales Development), Pass to Sales, Scrap, Nurture (Marketing).
Slide 13: This slide presents Product Wise Pipeline Analysis with text boxes to fill.
Slide 14: This slide shows Next Quarter Deals.
Slide 15: This is Voice Of The Customer slide to state customer problems, opinions etc.
Slide 16: This slide presents Win-Loss Review in percentage etc.
Slide 17: This slide shows Pipeline Quality graph with two aspects- Sales Stage on x-axis and Opportunity Age shown on the y-axis.
Slide 18: This slide presents Pipeline Quality in a matrix form with- Qualify (Sales Development), Pass to Sales, Scrap, Nurture (Marketing).
Slide 19: This slide shows Key Sales Initiatives in a funnel image form.
Slide 20: This slide also shows Key Sales Initiatives in a funnel image form.
Slide 21: This slide presents Forecast Accuracy graph indicating the Upper Control Limit (UCL), Lower Control Limit (UCL).
Slide 22: This slide also shows Forecast Accuracy graph.
Slide 23: This slide presents Current Quarter Portfolio in a pie chart/ graph form. It also shows various icons and text boxes to fill.
Slide 24: This slide presents Current Quarter Portfolio graph.
Slide 25: This is Sales Rep Performance Scorecard matrix slide showing the Overall Territory Performance.
Slide 26: This slide shows Sales Rep KPI Tracker.
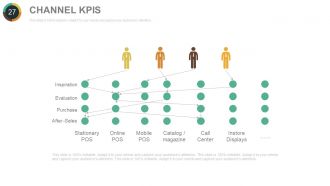
Slide 27: This is Channel KPIS slide showing- Stationary POS, Online POS, Mobile POS, Catalog / magazine, Call Center, Instore Displays, Inspiration, Evaluation, Purchase, After -Sales.
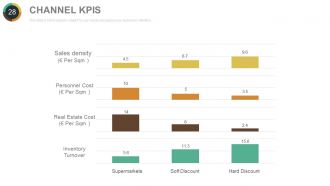
Slide 28: This slide also shows Channel KPIS on the basis of- Sales density (€ Per Sqm ), Personnel Cost (€ Per Sqm ), Real Estate Cost (€ Per Sqm ), Inventory Turnover.
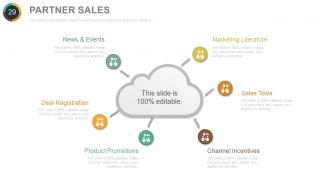
Slide 29: This slide shows Partner Sales with cloud imagery. It also shows- Marketing Literature, Sales Tools, Channel Incentives, Product Promotions, Deal Registration, News & Events.
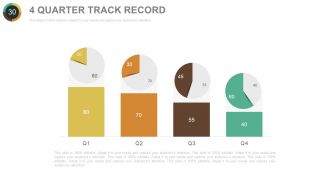
Slide 30: This slide displays 4 Quarter Track Record in charts and graphs.
Slide 31: This slide also shows 4 Quarter Track Record graph.
Slide 32: This is Partner Score Card slide showing Talent Scorecard.
Slide 33: This slide presents Competitive Analysis.
Slide 34: This slide also presents Competitive Analysis in a graphical form.
Slide 35: This slide presents Funnel Forecast Review. You can add text as per your need.
Slide 36: This slide also shows Funnel Forecast Review.
Slide 37: This slide shows Critical Opportunity Review.
Slide 38: This is Sales Process Map slide in people silhouettes and funnel imagery to go with.
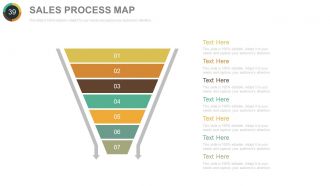
Slide 39: This slide also shows Sales Process Map in a funnel form with text boxes. You can add information as per your requirement.
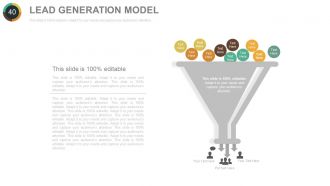
Slide 40: This slide presents Lead Generation Model with funnel imagery and text boxes.
Slide 41: This slide shows Projected Quarterly Sales. Use this slide to show your own quarterly sales.
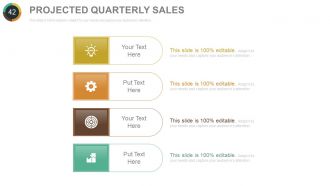
Slide 42: This slide also shows Projected Quarterly Sales with icon imagery and text boxes.
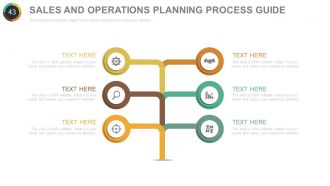
Slide 43: This slide shows Sales And Operations Planning Process Guide. We have provided few text boxes for you to add relevant information.
Slide 44: This slide shows Sales Team Target And Achievement bar graph. Present your own data in a graphical form form.
Slide 45: This is Sales Performance Versus Target slide with metric imagery. You can add your own sales performace and target stats in this slide and compare the two accordingly.
Slide 46: This slide is titled Additional Slides to move ahead. You can alter the content as per need.
Slide 47: This slide showcases Our Team with name, designation etc. to fill.
Slide 48: This is Our Goal slide with target and arrow imagery. Use it to state your goals.
Slide 49: This slide showcases Comparison of two entities- Male and Female.
Slide 50: This is Dashboard slide to show metrics, KPIs etc.
Slide 51: This is a Location slide to show global growth, presence etc. on a world map image.
Slide 52: This is a Timeline slide to present important dates, journey, evolution, milestones etc.
Slide 53: This is Target With Arrow image slide. Use it to state your targets, goals etc.
Slide 54: This is a Venn diagram image slide to show information, specifications etc.
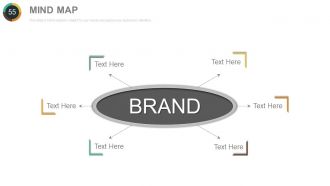
Slide 55: This is a Mind Map slide to show behavioral segmentation, information or anything relative.
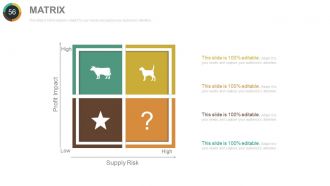
Slide 56: This is a MATRIX slide with High and Low parameters.
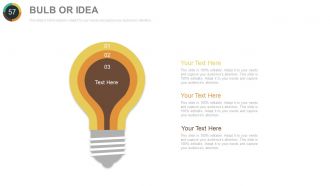
Slide 57: This is a Bulb or Idea slide to state a new idea or highlight specifications/ information etc.
Slide 58: This slide shows a Magnifier Glass image with text boxes.
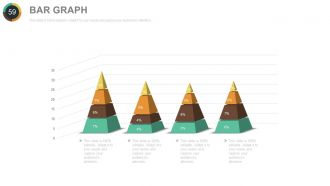
Slide 59: This slide shows a creative Bar Graph to show product comparison, growth etc.
Slide 60: This is a Thank You slide for acknowledgement or to end the presentation.
Quarterly sales performance review powerpoint presentation with slides with all 60 slides:
The final image generated by our Quarterly Sales Performance Review Complete Powerpoint Deck With Slides is impressive. It ensures all the elements gel.
-
Quarterly Sales Performance Review
-
Agenda Slide
-
Quarterly Pipeline Summary
-
Sales Cycle
-

Weekly Quarterly Sales Summary
-
Weekly Quarterly Sales Summary
-
Quarterly Sales Revenue by Product
-
Key Sales Performance Metrics
-
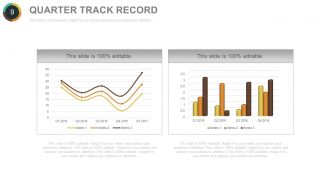
Quarter Track Record
-
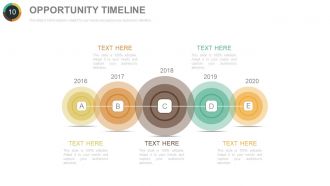
Opportunity Timeline
-

Opportunity Score
-
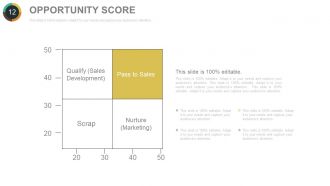
Opportunity Score
-
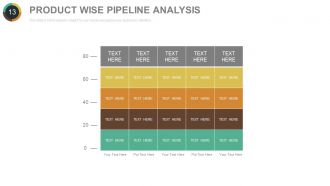
PRODUCT WISE PIPELINE ANALYSIS
-
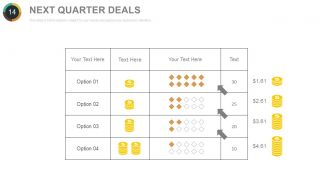
Next Quarter Deals
-
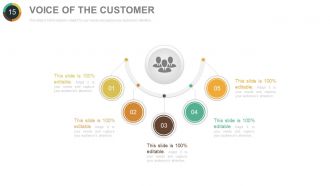
Voice of the Customer
-

WIN LOSS REVIEW
-
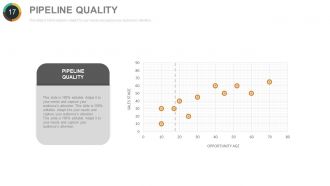
Pipeline Quality
-
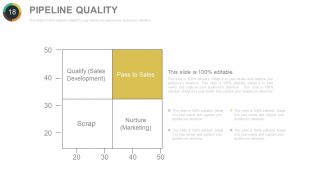
Pipeline Quality
-
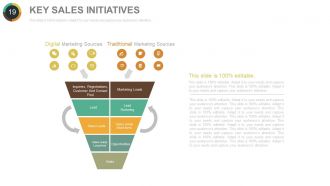
Key Sales Initiatives
-
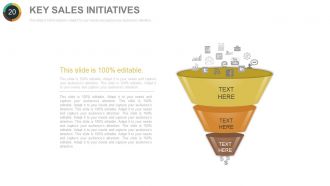
Key Sales Initiatives
-
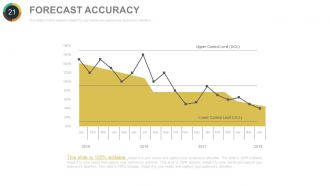
Forecast Accuracy
-
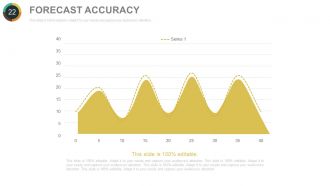
Forecast Accuracy
-
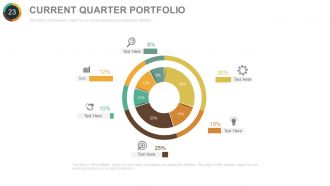
Current Quarter Portfolio
-
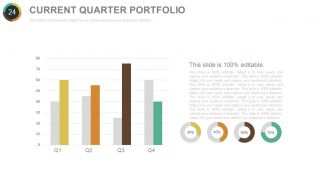
Current Quarter Portfolio
-
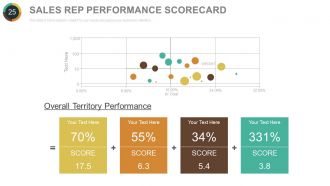
Sales Rep Performance Scorecard
-
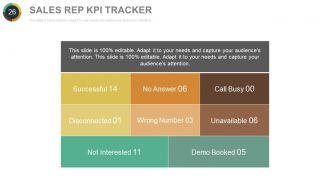
Sales Rep KPI Tracker
-
CHANNEL KPIs
-
CHANNEL KPIs
-
Partner Sales
-
4 Quarter Track Record
-
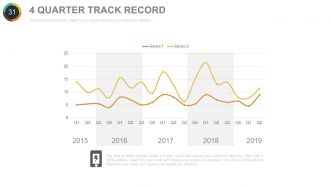
Four Quarter Track Record
-
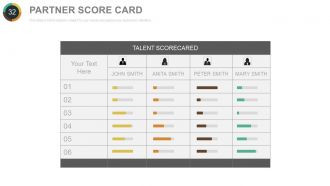
Partner Score Card
-
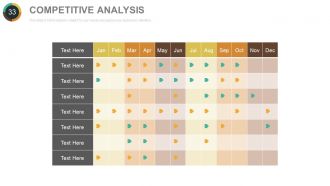
Competitive Analysis
-
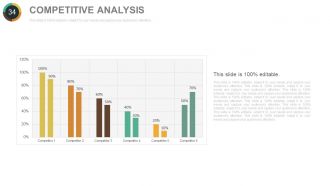
Competitive Analysis
-
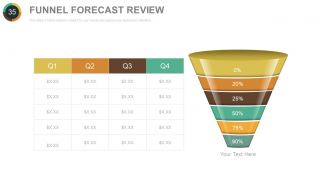
Funnel Forecast Review
-
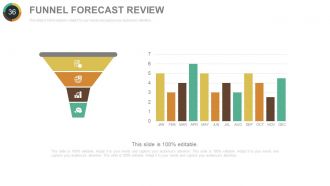
Funnel Forecast Review
-
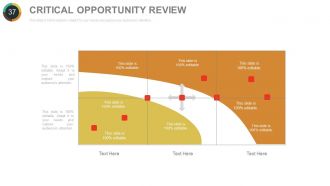
Critical Opportunity Review
-
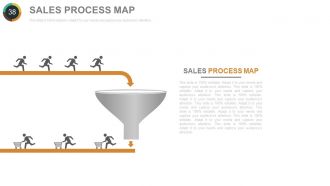
Sales Process Map
-
Sales Process Map
-
Lead Generation Model
-

PROJECTED QUARTERLY SALES
-
Projected Quarterly Sales
-
Sales and Operations Planning Process Guide
-
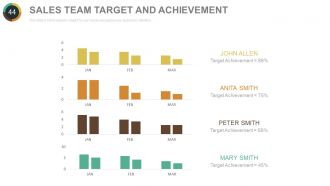
Sales Team Target and Achievement
-

Sales Performance Versus Target
-
Additional Slides
-

OUR TEAM
-
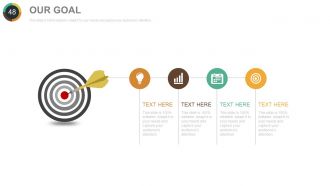
OUR GOAL
-

Comparison
-
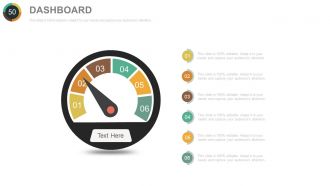
Dashboard
-
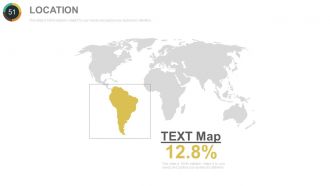
LOCATION
-
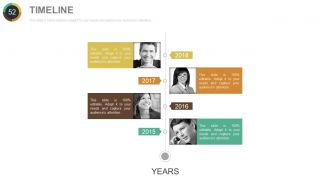
Timeline
-
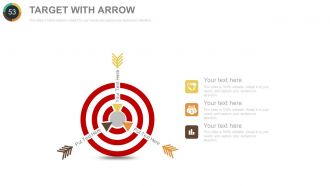
Target with Arrow
-
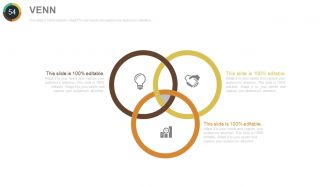
Venn Diagram
-
Mind Map
-
Matrix
-
BULB OR IDEA
-

Magnifier Glass
-
Bar Graph
-
Thank You
FAQs for Quarterly sales performance review powerpoint
Revenue growth is the obvious one, but conversion rates and deal size matter way more than people think. Sales cycle length too. I got burned last quarter - our numbers looked amazing but we were hemorrhaging cash on customer acquisition costs vs what they were actually worth long-term. Pipeline velocity is clutch for forecasting. Break down win/loss ratios by territory and rep so you can see who's actually performing. Monthly pulls are better than waiting until quarter-end when it's too late to fix anything. Oh, and retention metrics if you've got recurring revenue.
Yeah seasonality messes with everything - retail goes crazy in Q4 obviously, but B2B usually tanks in summer when everyone's at the beach. Compare year-over-year instead of quarter to quarter. That's way more useful. Plot your last 3 years and you'll see the patterns jump out. Don't freak when Q3 looks terrible compared to Q2 - some industries just work that way. I learned this the hard way when I panicked over a summer dip that turned out to be totally normal. Use those historical trends to set realistic forecasts so you're not constantly surprised by predictable swings.
Honestly, I'd go with something like Salesforce or HubSpot since they're basically made for tracking deals and spitting out quarterly reports automatically. Way better than wrestling with Excel spreadsheets every three months (learned that the hard way lol). If you need fancier charts and stuff, Tableau or Power BI work great. Google Sheets can actually handle simpler setups pretty well too - just need some basic formulas. The main thing is making sure whatever you pick connects with wherever your sales data currently lives. Otherwise you'll be stuck manually entering everything twice, which is honestly the worst.
Honestly, pull up your last 8-12 quarters first. What's the actual trend - 5% growth each quarter? 10%? Seasonal ups and downs? Don't just average everything out because you'll totally lowball yourself if there's real momentum happening. We did that once and it was embarrassing how easy our targets were. Think about what's changing too - new hires, product launches, whatever. I'd probably add 10-15% on top of your trend line for stretch. You want it tough enough that people care but not so crazy they just check out, you know?
Start with your pipeline - what deals are stuck and why? Look at this quarter's wins vs losses to see what actually moved the needle. Most reps honestly just cross their fingers and hope things improve without doing this homework. Stop chasing garbage leads. Qualify harder upfront instead of wasting time on prospects who'll never buy. Get regular coaching sessions to practice objection handling, and use those customer success stories as proof points. Oh, and don't wait until next quarter starts - implement this stuff now while you've got time to adjust.
Dude, customer feedback and market trends are basically your cheat codes for quarterly planning. Look at what customers are complaining about or raving over - that tells you which features to push or problems to solve. Market data shows where demand's heading, so you can shift resources before everyone else catches on. I swear, teams that ignore this stuff always act shocked when their numbers crash mid-quarter. Review both monthly, then tweak your messaging and target different segments. Oh and honestly? The companies crushing it right now are the ones actually listening to this data instead of just collecting it.
Look, competitive analysis is basically your reality check on quarterly numbers. That 15% growth might seem awesome until you find out everyone else hit 25% - then you're actually behind. I always tell people to track what competitors are doing with pricing and product drops throughout the quarter. Otherwise you're just celebrating in a bubble, you know? The whole market could've exploded and you'd think your strategy was genius. It's happened to me before, honestly. Raw sales data means nothing without context. Compare against competitors and suddenly those numbers tell you what's really working.
Honestly, just focus on telling a story with your data instead of throwing numbers at people. Bar charts are perfect for comparing quarters, and line graphs show trends super clearly. Dashboard layouts are everywhere now - you can display multiple metrics without making people's heads spin. Skip pie charts for sales stuff though, they're pretty useless here. Color-code by product or region so patterns pop right away. Here's the thing - pick maybe 2-3 metrics that actually matter to whoever you're presenting to. Build everything around what they need to make decisions.
Don't fall into the seasonality trap - Q4 vs Q2 is like comparing apples to oranges, so stick to year-over-year comparisons. Breaking down by product lines and regions is huge because those aggregate numbers can be seriously misleading. I learned this the hard way when I got obsessed with total revenue and completely missed some warning signs. One-time deals will mess with your head too, so watch for those. Honestly, just make yourself a template with different views - saves me so much time and I don't miss the obvious stuff anymore.
Dude, you're missing so much by just staring at sales numbers alone. Get marketing, product, and customer success in the room - they'll tell you WHY that weird Q2 dip actually happened. Was it a bug? Bad campaign timing? People churning like crazy? Finance can spot seasonal stuff you'd never notice too. Honestly feels like night and day once you see the bigger picture. I'd do monthly cross-team sessions where everyone brings their top insights that might mess with your sales. Takes like an hour but saves you from wild goose chases later.
Dude, training really works - I've seen teams jump 15-20% in just 2-3 months after good programs. Your reps get way better at explaining products and closing deals. They also sound way more confident on calls, which honestly makes a huge difference. Better product knowledge means they can actually upsell existing clients instead of just taking orders. The math works out too since higher close rates pay for the training pretty fast. Oh, and definitely track your close rates before/after so you can actually see the impact. Some managers skip that part and miss seeing how much it helped their quarterly numbers.
Stop burying people in spreadsheets! Your quarterly results need a real story. What was the goal? What went wrong? Like that July sales dip from the product delay - we've all been there, right? Then show how you bounced back in September. Honestly, stakeholders tune out without the narrative thread connecting everything. Throw in some actual customer wins or specific examples. Structure it like you're telling a friend what happened, not reading from a boring report. Short version: make them care about the journey, not just the final numbers.
Pipeline velocity is probably the biggest one nobody talks about enough - shows how fast deals actually move. Revenue growth, win rates, and average deal size are obvious picks. Customer acquisition cost vs lifetime value matters too. I'd definitely track quota performance by rep and territory, plus lead conversion at each stage. Sales cycle length helps with forecasting way more than people realize. Oh and honestly? Start simple with maybe 5-6 of these instead of going crazy with dashboards. Better to nail the basics than drown in data you won't use.
Honestly, most people just stare at their quarterly numbers without doing anything useful with them. Check what channels actually converted - if social killed it but your emails flopped, move that budget around for next quarter. Same with audiences. Double down on segments that worked and either fix the duds or cut them loose. The biggest mistake I see (and this drives me nuts) is teams spend forever making fancy reports but never actually change anything. Block out time each quarter to dig into the data, then immediately tweak your targeting and spend based on what you find.
Start with the easy stuff and get some wins on the board - even small ones count right now. Honestly, I'd just be straight up about what happened instead of acting like nothing's wrong. People can tell anyway, you know? Break things down into shorter goals so your team actually feels like they're accomplishing something. Maybe throw in some training sessions or get them better leads to work with. Once you get a couple victories, the momentum kind of builds itself. It's weird how that works but it really does. The confidence thing fixes itself once people start succeeding again.
-
Easy to edit slides with easy to understand instructions.
-
Helpful product design for delivering presentation.
-
relevant and effective
highly resourceful aid for management decision making