


Quantitative Risk Analysis Powerpoint Presentation Slides




Try Before you Buy Download Free Sample Product
 Impress Your
 Audience
 100%
100% Editable
 Save Hours
 of Time


PMI provides modeling techniques to develop and control the schedule and perform quantitative risk analysis. Check out our efficiently designed Quantitative Risk Analysis template that focuses attention on various techniques such as data gathering, data analysis, data representation, decision making, communication, and interpersonal team skills. We have covered benchmarking, brainstorming, check sheets, checklists, focus groups, interviews, market research, questionnaires and surveys, and statistical sampling in data gathering tools. In data analysis techniques, we have outlined the alternative analysis, assessment of risk parameters, assumption and constraint analysis, cost of quality, cost-benefit analysis, decision tree analysis, document and earned value analysis, iteration burnout chart, performance reviews, etc. We have focused on hierarchical charts, responsibility assignment matrix, cause and effect diagrams, etc. This insightful template can be used for visual modeling the project management approach. Book a free demo with our research or design team and customize this 100 percent editable template based on your needs. Grab the templates access and download it now.
People who downloaded this PowerPoint presentation also viewed the following :
Content of this Powerpoint Presentation
Slide 1: This slide introduces Quantitative Risk Analysis. State Your Company Name and begin.
Slide 2: This slide states Agenda of the presentation.
Slide 3: This slide presents Table of Content for the presentation.
Slide 4: This is another slide continuing Table of Content for the presentation.
Slide 5: This slide highlights title for topics that are to be covered next in the template.
Slide 6: This slide represents the glimpse about the steps required in benchmarking process which covers the phases such as planning, analysis, etc.
Slide 7: This slide provides the glimpse about the benchmarking analysis tool for project management.
Slide 8: This slide presents the glimpse about the brainstorming technique for financial statements.
Slide 9: This slide provides the glimpse about the brainstorming project mind mapping tool which focuses on problem solving, project management, improvement, team building, etc.
Slide 10: This slide displays the glimpse about the project management daily check sheet which focuses on issues faced during project management daily for one week.
Slide 11: This slide represents the glimpse about the software project management weekly tally sheet which focuses on issues faced during project management on 4 weeks of the month.
Slide 12: This slide provides the glimpse about the project management checklist which focuses on various project items.
Slide 13: This slide presents the glimpse about the contactor project evaluation check list which focuses on quality of contractor’s work.
Slide 14: This slide shows Steps Required in Planning Project Focus Group.
Slide 15: This slide displays Implementing Focus Group Methodology in Company.
Slide 16: This slide represents the glimpse about the methods of research interviews such as email, web, telephonic, personal, etc.
Slide 17: This slide provides the glimpse about the method to collect data market research such as interviews, focus groups, etc.
Slide 18: This slide presents Questionnaires and Surveys in Project Management.
Slide 19: This slide provides the glimpse about the various statistical sampling methods which covers random, stratified, volunteer, and opportunity, etc.
Slide 20: This slide highlights title for topics that are to be covered next in the template.
Slide 21: This slide represents Steps Required in Alternatives Data Analysis Technique.
Slide 22: This slide shows Alternatives Analysis Technique used in Company.
Slide 23: This slide presents assessment of other risks based on 5x5 risk matrix along with probability and impact measures.
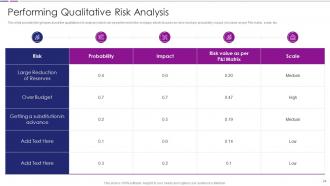
Slide 24: This slide provides the glimpse about the qualitative risk analysis which can be performed in the company which focuses on risks involved, probability, impact, etc.
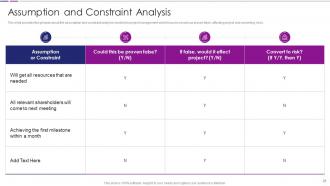
Slide 25: This slide displays the glimpse about the assumption and constraint analysis involved in project management.
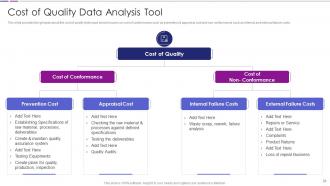
Slide 26: This slide represents the glimpse about the cost of quality technique.
Slide 27: This slide shows cost benefit analysis which focuses on project details such as budget, cost, planned start & finish date, percent completed and assignment date.
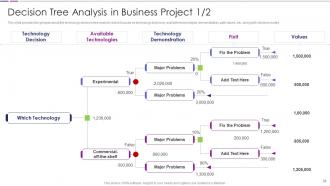
Slide 28: This slide presents technology decision tree analysis which focuses on technology decisions, available technologies, demonstration, path values, etc
Slide 29: This slide shows decision tree analysis of business project which focuses on decision definition, nodes, chance nodes, etc.
Slide 30: This slide displays the glimpse about the document analysis for software project which focuses on the documents that needs to be considered during project duration.
Slide 31: This slide represents phase earned value analysis table which focuses on phases, budget, date completed, etc.
Slide 32: This slide shows Project Phase Earned Value Performance Forecast.
Slide 33: This slide presents project iteration burn down chart which focuses on 21 days plan along with completed tasks, remaining effort, etc.
Slide 34: This slide shows Mathematical Approach for Software Project Make or Buy Analysis.
Slide 35: This slide displays Decision Tree for Project Make or Buy Analysis.
Slide 36: This slide represents the glimpse about the project performance review along with budget, earned and actual values, etc.
Slide 37: This slide shows Five Key Elements for Process Improvement Project Success.
Slide 38: This slide highlights title for topics that are to be covered next in the template.
Slide 39: This slide shows work breakdown structure (WBS) for the project which focuses on different software phases to schedule the project.
Slide 40: This slide displays organization breakdown structure (OBS) which showcase the software team hierarchy.
Slide 41: This slide represents resource break down structure (RBS) which focuses on different resources needed for the project.
Slide 42: This slide shows responsibility assignment matrix for a project which focuses on RACI and how work has been assigned.
Slide 43: This slide presents Cause and Effect Diagram for Project Management.
Slide 44: This slide highlights title for topics that are to be covered next in the template.
Slide 45: This slide displays project multi criteria decision matrix along with various targeted features such as strategic objective, etc.
Slide 46: This slide represents project preference voting technique which focuses on different project and their preference ranking in the company.
Slide 47: This slide highlights title for topics that are to be covered next in the template.
Slide 48: This slide presents Stakeholder Analysis for Project Communication.
Slide 49: This slide shows project communication media choice such as hard copy, telephone call, voice mail, etc.
Slide 50: This slide highlights title for topics that are to be covered next in the template.
Slide 51: This slide represents leadership skills important for project manager which focuses on delegating, participating, telling and selling skills.
Slide 52: This slide shows project interpersonal skills needed for the managers such as leadership, team building, motivation, etc.
Slide 53: This slide presents Developing Project Interpersonal Skills and Team Building Activities.
Slide 54: This slide displays Icons for Quantitative Risk Analysis.
Slide 55: This slide is titled as Additional Slides for moving forward.
Slide 56: This slide shows Project Manager Facilitation Development Matrix.
Slide 57: This slide presents Project Manager Communication Techniques.
Slide 58: This slide displays Expectation Project Management Matrix.
Slide 59: This slide represents Project Management Issue Log.
Slide 60: This slide showcases Influence Diagram in Project Risk Management.
Slide 61: This slide represents Stacked Bar chart with two products comparison.
Slide 62: This slide depicts Area chart with two products comparison.
Slide 63: This is Our Mission slide with related imagery and text.
Slide 64: This slide depicts Venn diagram with text boxes.
Slide 65: This slide shows Post It Notes. Post your important notes here.
Slide 66: This slide contains Puzzle with related icons and text.
Slide 67: This is an Idea Generation slide to state a new idea or highlight information, specifications etc.
Slide 68: This is a Timeline slide. Show data related to time intervals here.
Slide 69: This is a Comparison slide to state comparison between commodities, entities etc.
Slide 70: This is Our Target slide. State your targets here.
Slide 71: This slide provides 30 60 90 Days Plan with text boxes.
Slide 72: This is a Thank You slide with address, contact numbers and email address.
Quantitative Risk Analysis Powerpoint Presentation Slides with all 77 slides:
Use our Quantitative Risk Analysis Powerpoint Presentation Slides to effectively help you save your valuable time. They are readymade to fit into any presentation structure.
-

Quantitative Risk Analysis
-
Agenda of Quantitative Risk Analysis
-
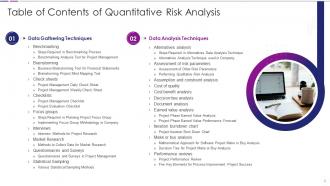
Table of Contents of Quantitative Risk Analysis
-

Table of Contents of Quantitative Risk Analysis
-
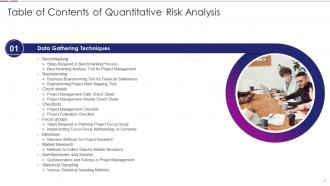
Table of Contents of Quantitative Risk Analysis
-
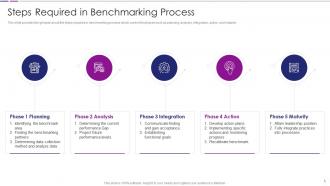
Steps Required in Benchmarking Process
-
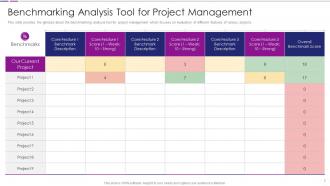
Benchmarking Analysis Tool for Project Management
-

Business Brainstorming Tool for Financial Statements
-
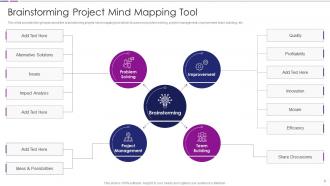
Brainstorming Project Mind Mapping Tool
-
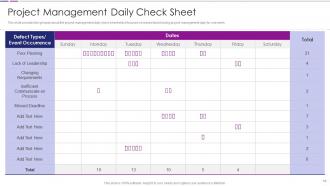
Project Management Daily Check Sheet
-
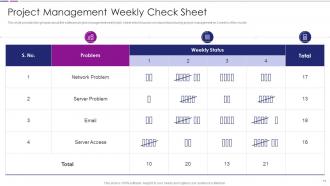
Project Management Weekly Check Sheet
-
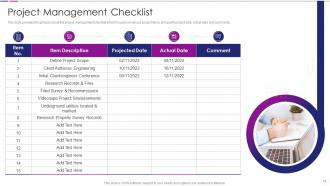
Project Management Checklist
-
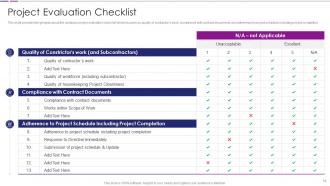
Project Evaluation Checklist
-
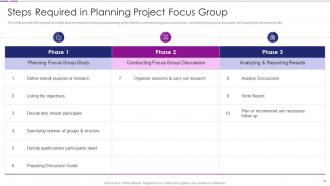
Steps Required in Planning Project Focus Group
-
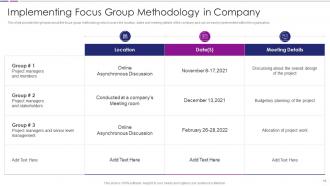
Implementing Focus Group Methodology in Company
-

Interview Methods for Project Research
-
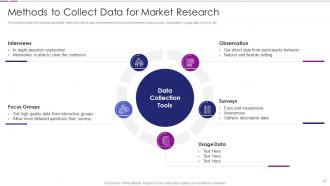
Methods to Collect Data for Market Research
-
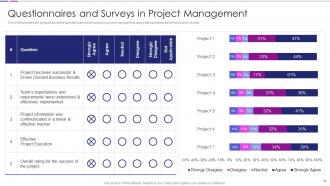
Questionnaires and Surveys in Project Management
-
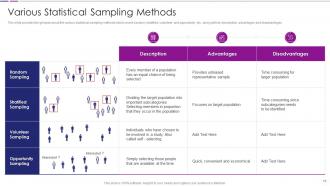
Various Statistical Sampling Methods
-
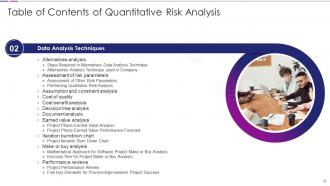
Table of Contents of Quantitative Risk Analysis
-
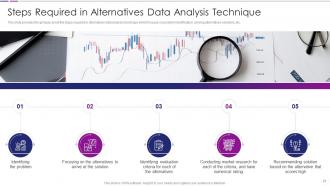
Steps Required in Alternatives Data Analysis Technique
-
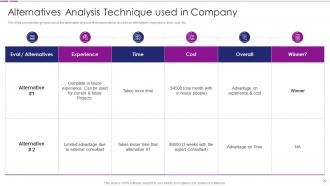
Alternatives Analysis Technique used in Company
-
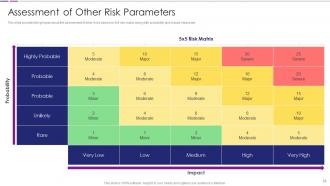
Assessment of Other Risk Parameters
-
Performing Qualitative Risk Analysis
-
Assumption and Constraint Analysis
-
Cost of Quality Data Analysis Tool
-

Cost Benefit Analysis for Projects
-
Decision Tree Analysis in Business Project 1 2
-
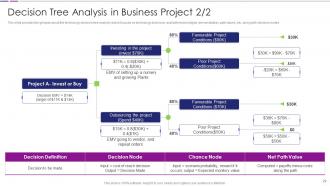
Decision Tree Analysis in Business Project 2 2
-
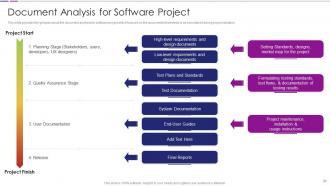
Document Analysis for Software Project
-
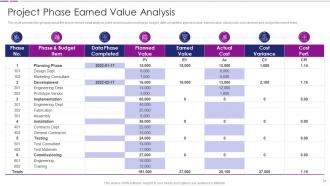
Project Phase Earned Value Analysis
-
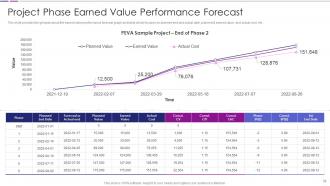
Project Phase Earned Value Performance Forecast
-
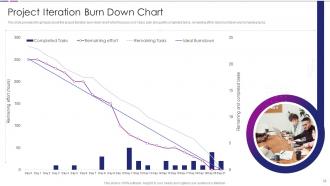
Project Iteration Burn Down Chart
-
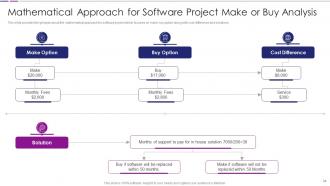
Mathematical Approach for Software Project Make or Buy Analysis
-
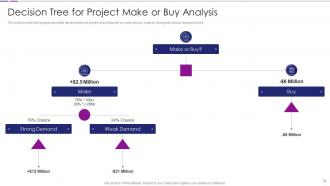
Decision Tree for Project Make or Buy Analysis
-

Project Performance Review
-
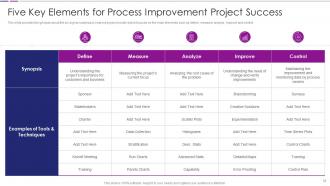
Five Key Elements for Process Improvement Project Success
-
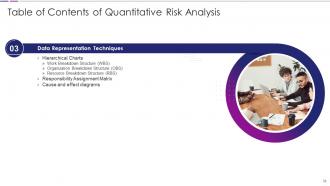
Table of Contents of Quantitative Risk Analysis
-
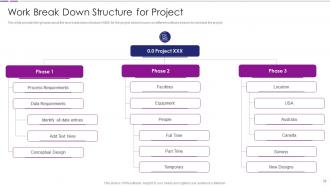
Work Break Down Structure for Project
-
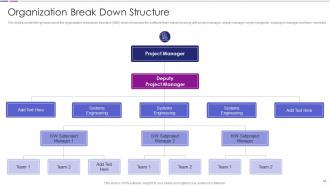
Organization Break Down Structure
-
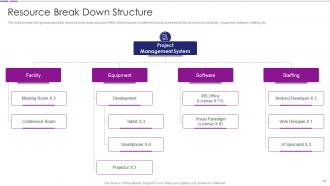
Resource Break Down Structure
-
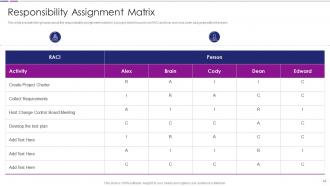
Responsibility Assignment Matrix
-
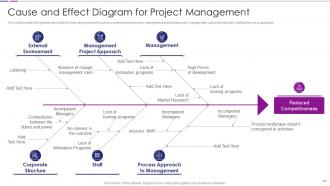
Cause and Effect Diagram for Project Management
-
Table of Contents of Quantitative Risk Analysis
-
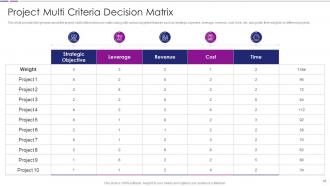
Project Multi Criteria Decision Matrix
-
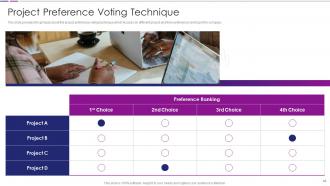
Project Preference Voting Technique
-

Table of Contents of Quantitative Risk Analysis
-
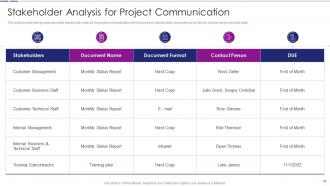
Stakeholder Analysis for Project Communication
-
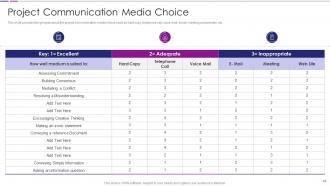
Project Communication Media Choice
-

Table of Contents of Quantitative Risk Analysis
-
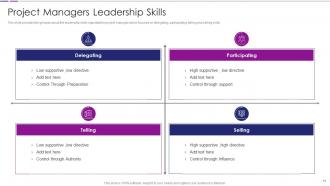
Project Managers Leadership Skills
-
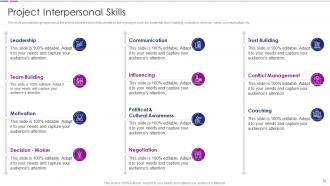
Project Interpersonal Skills
-
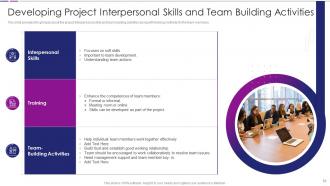
Developing Project Interpersonal Skills and Team Building Activities
-
Icons Slide for Quantitative Risk Analysis
-

Additional Slides
-
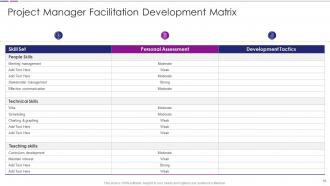
Project Manager Facilitation Development Matrix
-

Project Manager Communication Techniques
-
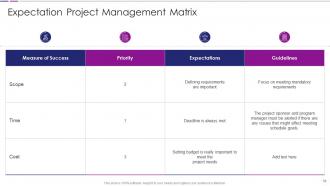
Expectation Project Management Matrix
-
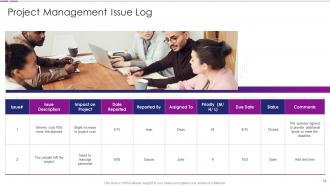
Project Management Issue Log
-
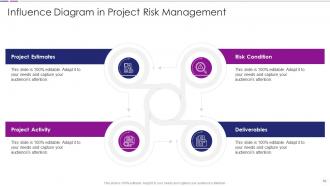
Influence Diagram in Project Risk Management
-
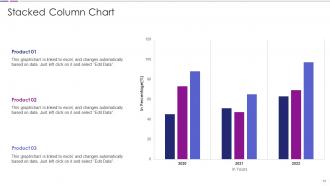
Stacked Column Chart
-

Area Chart
-

Our Mission
-
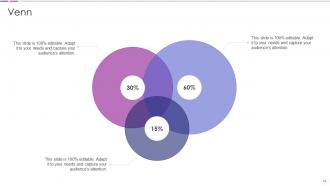
Venn
-
Post it Notes
-
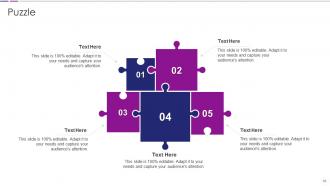
Puzzle
-
Idea Generation
-
Timeline
-
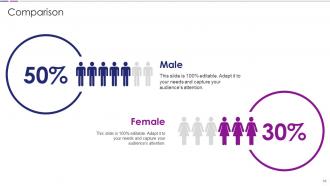
Comparison
-

Our Target
-
30 60 90 Days Plan
-

Thank You for Watching
-

-

-

-

-

FAQs for Quantitative Risk Analysis
Honestly, start with your biggest risks first - don't try to tackle everything at once, you'll go crazy. Map out what could actually go wrong, then figure out how likely each thing is to happen and what it'd cost you. The math gets pretty gnarly but that's where you actually get useful insights. You need solid data sources and some kind of modeling - Monte Carlo simulations work well for running different scenarios. Oh, and set up risk tolerance thresholds so you know when something's worth freaking out about versus just keeping an eye on. Impact quantification is huge too since everything needs to translate to actual dollars.
So qualitative risk assessment is more like "yeah, this feels risky" with color-coded heat maps and high/medium/low ratings. Quick and dirty, but pretty subjective. Quantitative actually does the math - Monte Carlo simulations, real probabilities, dollar amounts. Like instead of "this could be expensive," you'd say "there's a 15% chance we're looking at $2.3 million in losses." Honestly, quantitative takes way more time but you'll need those hard numbers if you're dealing with budgets or regulatory stuff. Depends what your boss is asking for, really.
Statistical modeling is what turns all that messy historical data into actual predictions about future risks. You're basically using Monte Carlo simulations, regression analysis, probability distributions - yeah, it gets pretty math-heavy. But honestly? That's where you separate the pros from people just guessing. These models let you put real numbers on risk probability and impact instead of going with your gut. I'd definitely start simple though - basic models first, then work up to the complex stuff once you're not drowning in formulas.
Basically, Monte Carlo sims let you run thousands of scenarios by randomly sampling from your risk distributions. You'll input stuff like costs, timelines, failure rates - then it churns out probability ranges for outcomes. Way more useful than just estimating one number, tbh. Running 10,000+ iterations takes like seconds and shows you confidence intervals plus which risks actually matter most. I'd start with maybe 3-5 of your biggest risk variables first - no point overcomplicating it right away. The visual results are pretty satisfying to watch too.
Look at your historical data first - that's usually your most reliable bet. When you don't have much past info to go on, expert judgment workshops can fill the gaps pretty well. Monte Carlo simulations are cool if you have time and want to get really detailed, but honestly they're probably overkill for most situations. Probability trees work nicely for events that happen in sequence. Oh, and Bayesian analysis is useful when you're constantly getting new information that changes things. Just pick whatever matches your timeline and how complex the risk actually is.
Dude, translate everything into dollar signs first - like "this screws us out of $2M" hits way harder than some probability chart. Executives honestly zone out the second they see spreadsheets of numbers. Visual stuff works better - dashboards, heat maps, whatever keeps their attention. Always give them three options: best case, worst case, most likely. Include actual dollar amounts and when things might happen. Skip the nerdy methodology unless they specifically ask for it. Start with "so what" instead - which fires need putting out right now and what you think they should actually do about it.
Honestly, garbage data will wreck everything - your whole analysis becomes useless if you don't check data quality first. Complex risks get messy too, so resist shoving them into tidy probability boxes because real life doesn't work that way. You're gonna miss huge blind spots if you only focus on stuff you can quantify while ignoring the qualitative risks lurking around. Oh, and definitely validate your models against what actually happened - I've seen too many people skip this step. When presenting results, always show the uncertainty ranges and spell out your assumptions. Nobody wants just one "magic number" without context.
So sensitivity analysis is basically your way of figuring out which parts of your risk model actually matter. You tweak different inputs one by one and see how much your results change - pretty straightforward stuff. The variables that cause big swings? Those are your danger zones where uncertainty can really mess things up. Honestly, it's way better than just hoping your model holds up when reality hits. Focus your energy on getting the top 3-5 most sensitive parameters right first. Don't waste time obsessing over inputs that barely budge your outcomes anyway.
If you're looking at quantitative risk analysis tools, **@RISK** and **Crystal Ball** are probably your best bet for Monte Carlo stuff in Excel. Super easy to use. **R** and **Python** work great too if you don't mind coding - finance teams love that they're free. There's also **MATLAB** and **Palisade DecisionTools** for heavier modeling. I'd honestly just go with @RISK if you're already comfortable in Excel. The learning curve won't kill you. Oh, and here's something I learned the hard way - just pick whatever works with your existing data first. Don't get caught up choosing the "perfect" tool and never actually finishing your analysis.
So compliance basically sets up all the rules you have to follow for your QRA - what risk metrics to calculate, probability thresholds to hit, documentation requirements, the whole deal. Basel III for banks, Solvency II for insurers - that kind of stuff isn't optional. Honestly, you'll hate how much time gets eaten up by documentation, but that's the reality. Build your models with these requirements baked in from the start though. Trust me on this one - retrofitting compliance later is a nightmare. First step? Figure out which regulations actually apply to your situation.
Backtesting is your best friend here - run your model against historical data to see where it would've screwed up. Stress tests are crucial too, especially for those crazy market days that break everything. I'd also cross-validate using different time periods, since markets love to change their personality. Get someone else to review your work - you'll miss stuff you're too close to see. Oh, and don't just validate once and forget about it. Set up some automated alerts so you know when reality starts disagreeing with your assumptions. Most models look great until they don't.
So basically, historical data is your starting point - it shows you what's actually gone down before and gives you real patterns to work with. Then predictive analytics takes those patterns and tries to figure out what might happen next. It's kinda like looking at your past driving record to guess your future accident risk, except way more complex obviously. I'd honestly start with getting solid historical data first since that keeps your predictions grounded in reality. Otherwise you're just making educated guesses. The predictive stuff helps you prep for scenarios that haven't hit yet, which is pretty useful.
VaR shows you the worst loss your portfolio might hit over a set time period at a certain confidence level. Think of it as your financial disaster boundary. You can use it for managing risk, setting limits on positions, and figuring out how much money to put where. Black swan events totally ignore VaR though - like 2008 basically laughed at everyone's models. But it gives you a real number to talk about when discussing downside with people. The best part? You can stack different investments against each other to see which ones might torpedo your returns first.
So you build like 3-5 different "what-if" scenarios into your models - base case, best case, worst case, maybe throw in some specific events too. Then run your Monte Carlo sims (or whatever method you're using) for each one. Way better than just staring at historical averages, trust me. Each scenario needs different input parameters and probability distributions. The real value comes from comparing how your risk metrics shift between scenarios. Shows you exactly where you're most vulnerable and what to focus on first. I learned this the hard way on a project last year - single-point estimates are basically useless for real risk management.
So basically, quantitative risk analysis turns your hunches into actual numbers. Rather than telling your boss "this feels risky," you can show them concrete probabilities and costs. Monte Carlo simulations are clutch for this - they'll run thousands of scenarios so you can see what might actually happen. Honestly, stakeholders eat this stuff up, especially the spreadsheet-obsessed ones. You can forecast different outcomes with real percentages, which makes planning way easier. Don't overthink it though. Just grab your biggest 3-5 risks and slap some numbers on them. Even rough estimates beat guessing.
-
Enough space for editing and adding your own content.
-
The customer care of SlideTeam is very responsive. I was having a payment issue and they fixed it for me in no time.