In 2018, the world witnessed the devastating collapse of the Morandi Bridge in Italy, which caused 43 fatalities and significant financial losses. The cause of the disaster was later attributed to poor risk management, highlighting the need for a systematic approach to it in all businesses.
According to a recent survey, only 38% of businesses have a formal risk management strategy in place. This leaves the majority of businesses vulnerable to potential risks and losses, from cyber attacks to supply chain disruptions. Effective risk management can not only prevent such disasters but also help businesses identify new opportunities for growth.
To help businesses manage their risks, SlideTeam has created a set of Risk Management Dashboard PPT Templates that act as comprehensive and easy-to-use tools for identifying, analyzing, and managing risks. Our templates enable businesses to anticipate potential issues and minimize financial losses. The 100% customizable nature of the templates provides you with the desired flexibility to edit your presentations. The content-ready slides give you the much-needed structure.
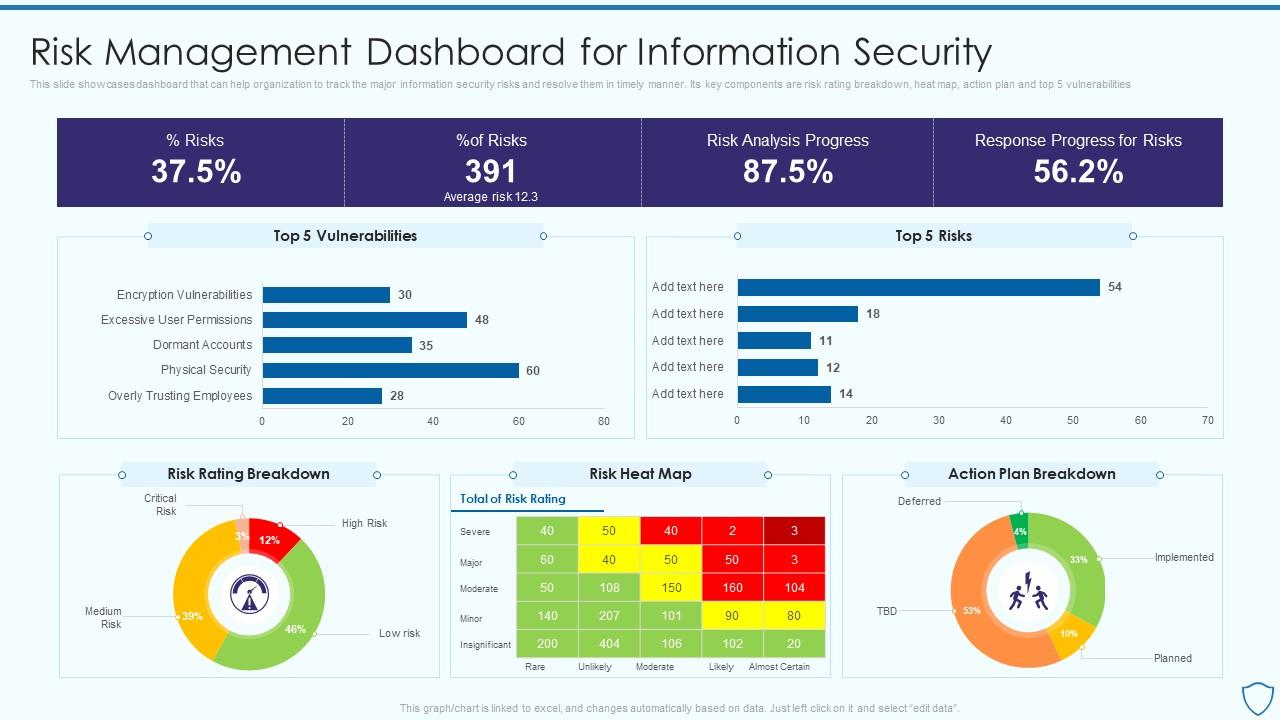
Template 1: Risk Management Dashboard for Information Risk Assessment and Management Plan for Information Security
Risk management is a critical vertical in any company that aims to identify, monitor, and minimize all types of risks. Our risk management dashboard template includes the tools and information that you need. It highlights the top five vulnerabilities and risks to help you focus efforts and resources where they are needed most. This dashboard examines unforeseen situations or adverse conditions and implements the necessary risk-mitigation measures. This design is ideal for storing important information in one location. Download it right away.
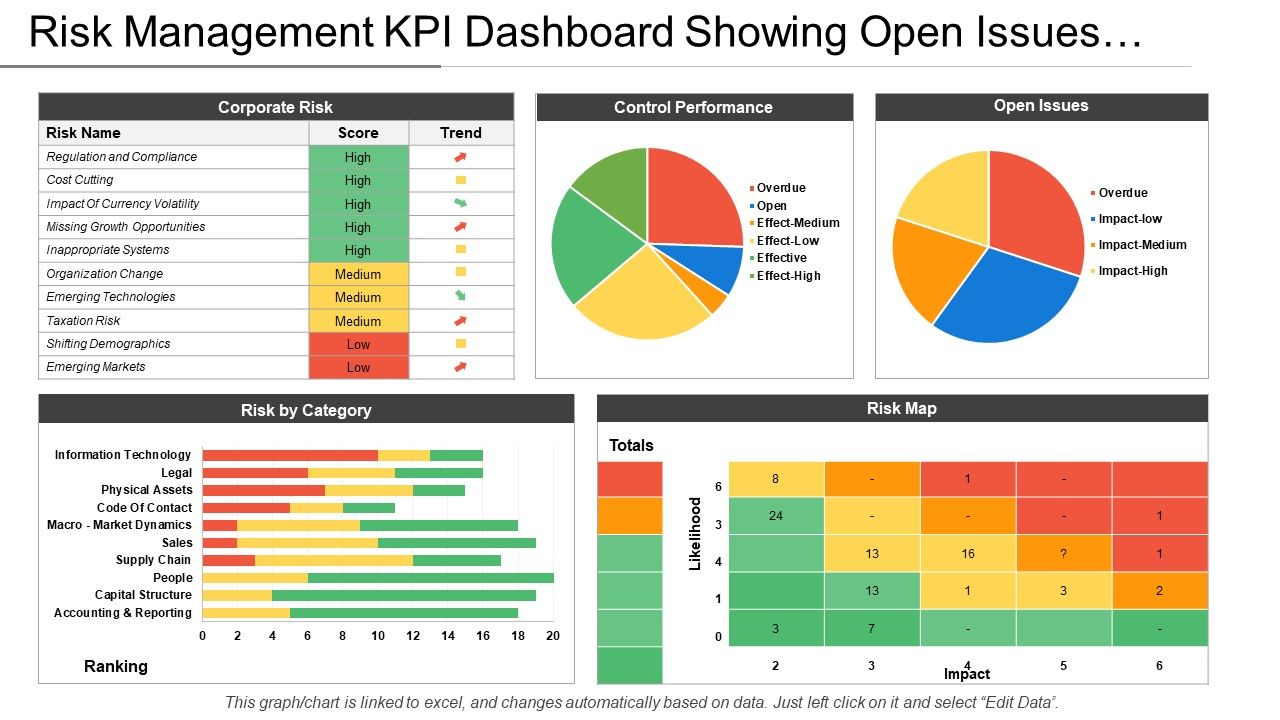
Template 2: Risk Management KPI Dashboard Showing Open Issues And Control Performance
Use our Risk Management KPI Dashboard PPT Template to track and assess the team's ability to make sure that the organization's risk policies and plans are successfully implemented, and that long-term goals are met. This design displays different subjects such as corporate risk, control performance, open issues, and so on. With this exclusive design, minimize any potential risk in the organization. Download it immediately.
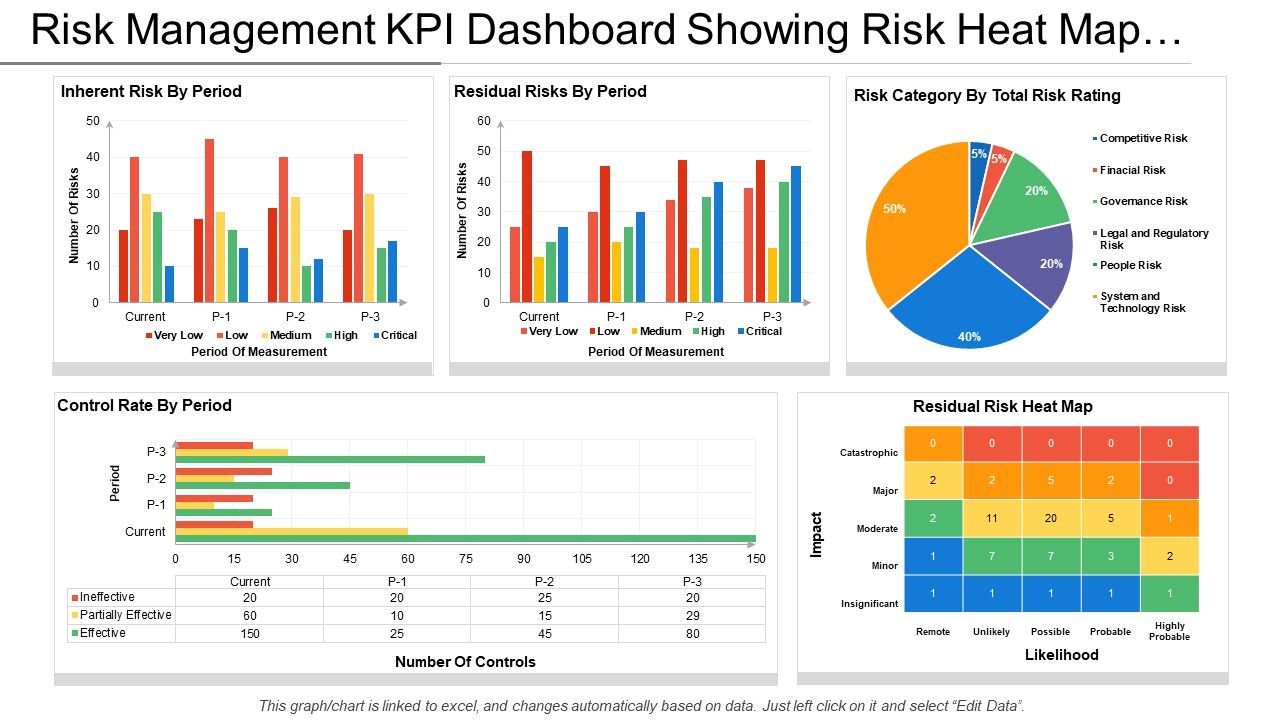
Template 3: Risk Management KPI Dashboard Showing Risk Heat Map
Our dashboard is critical for understanding an organization's risk environment and making informed decisions. When presenting to the board, you'll most likely want to show high-level KPIs and insights and explain the program's overall health. Use risk heat maps and control rates to help identify the risks you are likely to face. View the different levels of concern associated with each risk and their risk priorities in an intuitive, self-explanatory manner. Get it instantly.
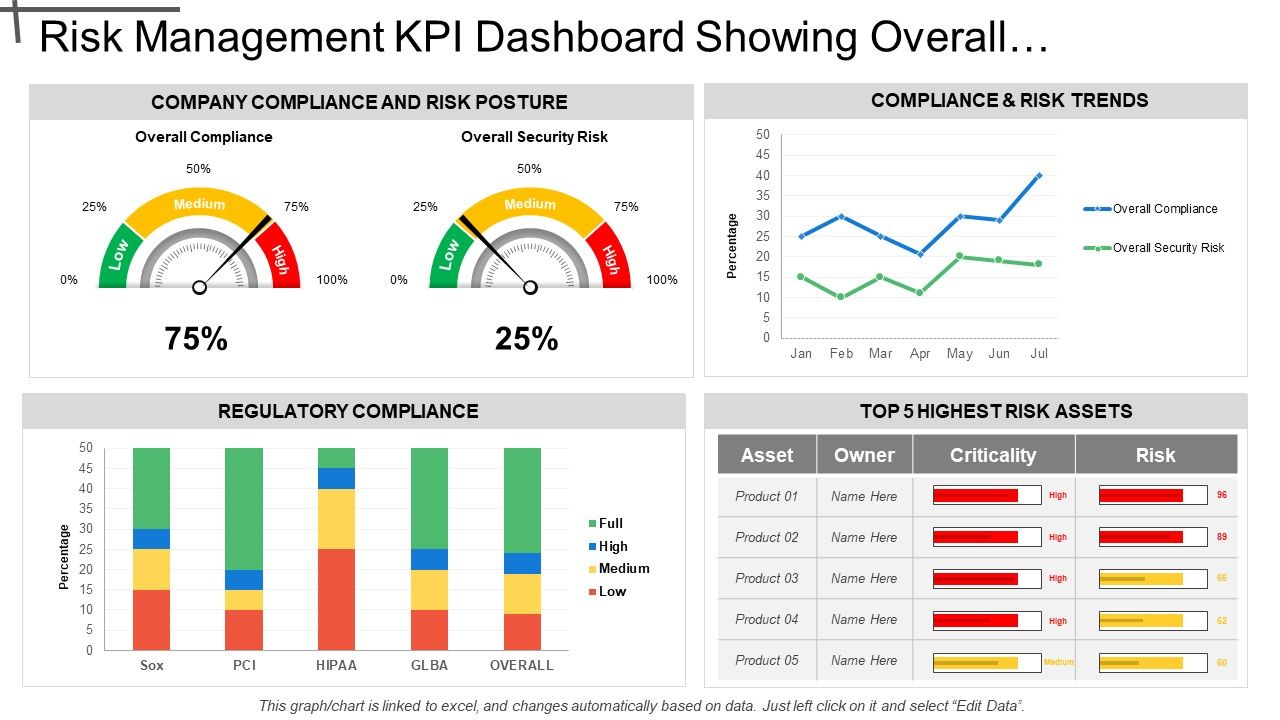
Template 4: Risk Management KPI Dashboard Showing Overall Security Risk
By quantifying and reporting on potential risks, our PPT Slide assists you in proactively monitoring exposure. KRIs can be implemented to detect and manage potential issues in information security, financial health, and other operational areas. This design is beneficial in making suitable resource allocation, tooling, and security control implementation decisions in light of the overall security risk and regulatory environment. Incorporate it right now.
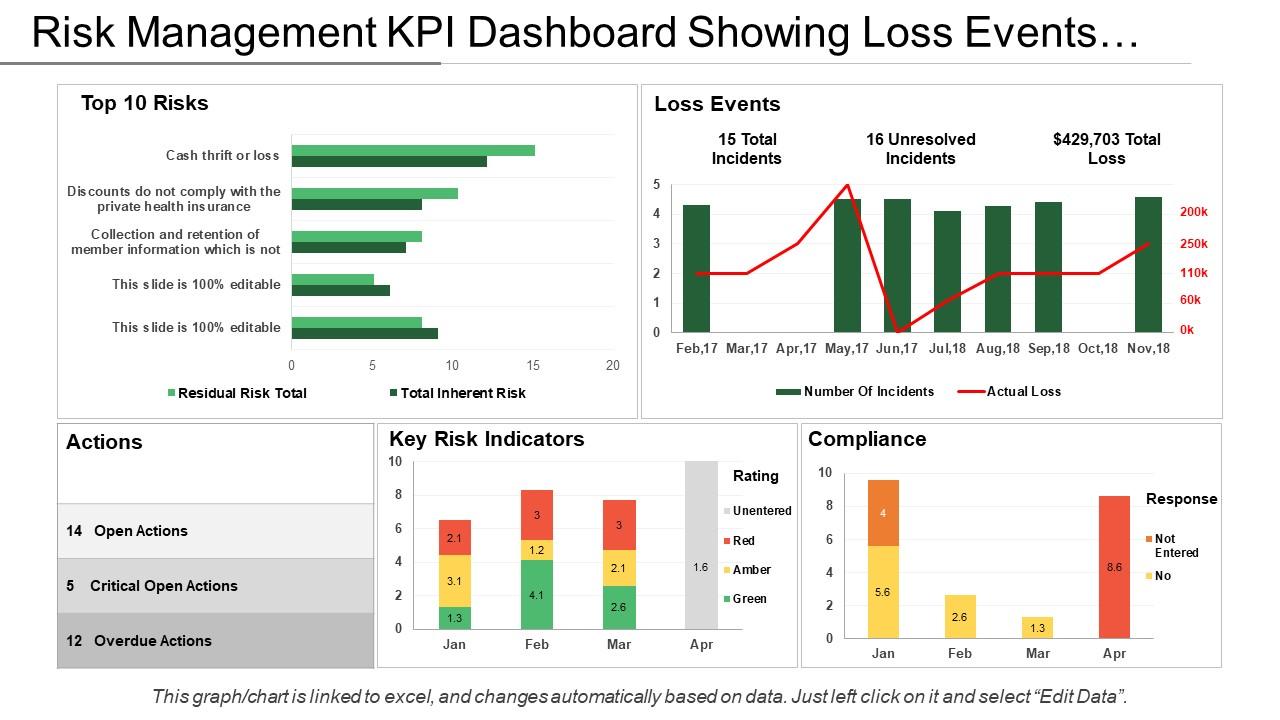
Template 5: Risk Management KPI Dashboard Showing Loss Events Actions and Compliance
Losses stall the growth of businesses. Although profits and losses are part and parcel of the deal, there are measures you can take to keep damage to a minimum. Our PPT Dashboard helps risk management personnel be wary of the top 10 risks their business is vulnerable to and underlines the key risk indicators. The loss events graph that illustrates total and unresolved incidents while attributing total loss is the highlight of our template. Get it now.
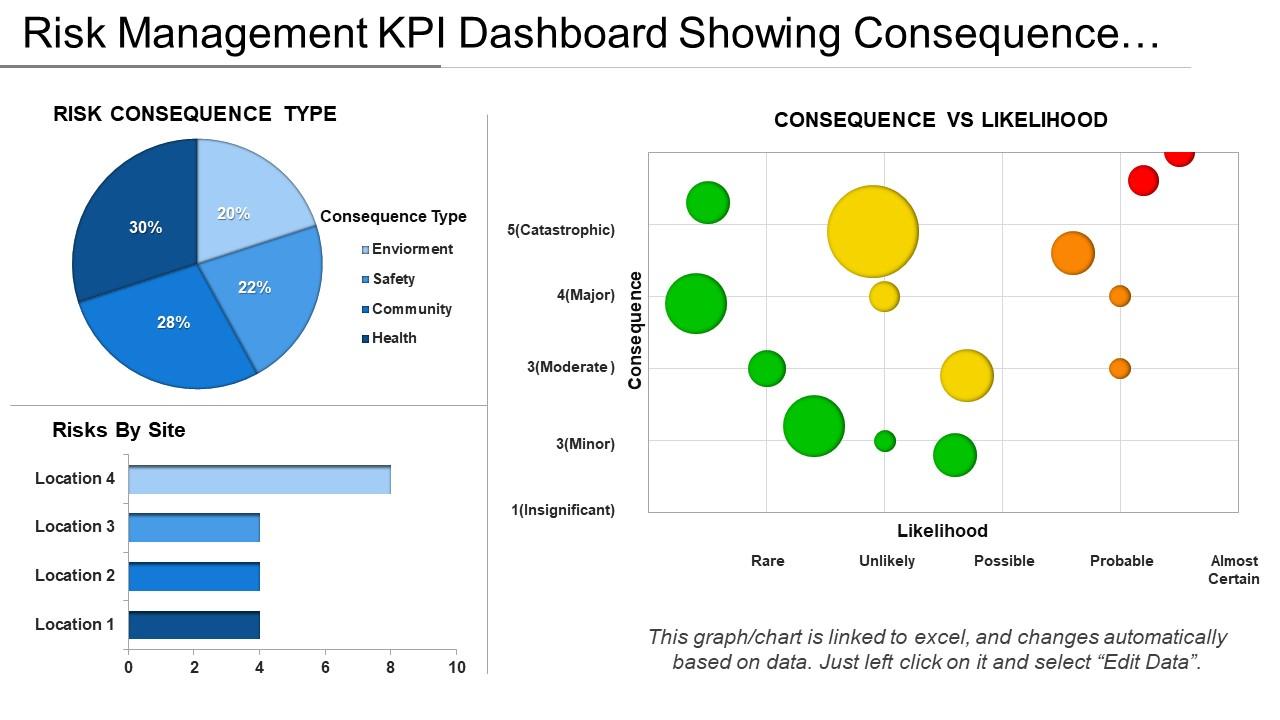
Template 6: Risk Management KPI Dashboard Showing Consequence Vs. Likelihood
Risks are inevitable but avoidable! With our Consequence vs. Likelihood PPT Dashboard, you can evaluate the possibilities of risks that can threaten your business. It helps you differentiate between risk consequence types and chart a graph to depict a given risk as rare, unlikely, or certain to happen. Download now.
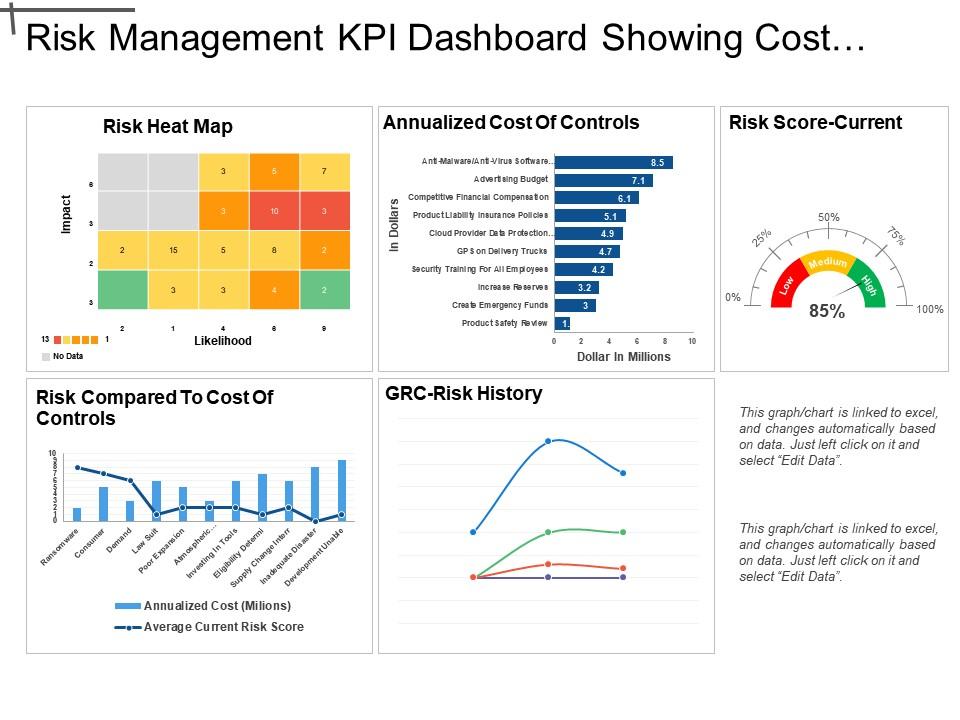
Template 7: Risk Management KPI Dashboard Showing Cost of Control And Risk Score
Take advantage of this dashboard presentation design to identify and control the risk incidents in your organization. It entails a risk heat map presenting the risk/likelihood data, a bar graph to analyze category-wise risk annual cost, a current risk score meter, and a GRC history line graph. You can share key highlights or warnings in the adjacent free space. Download it now!
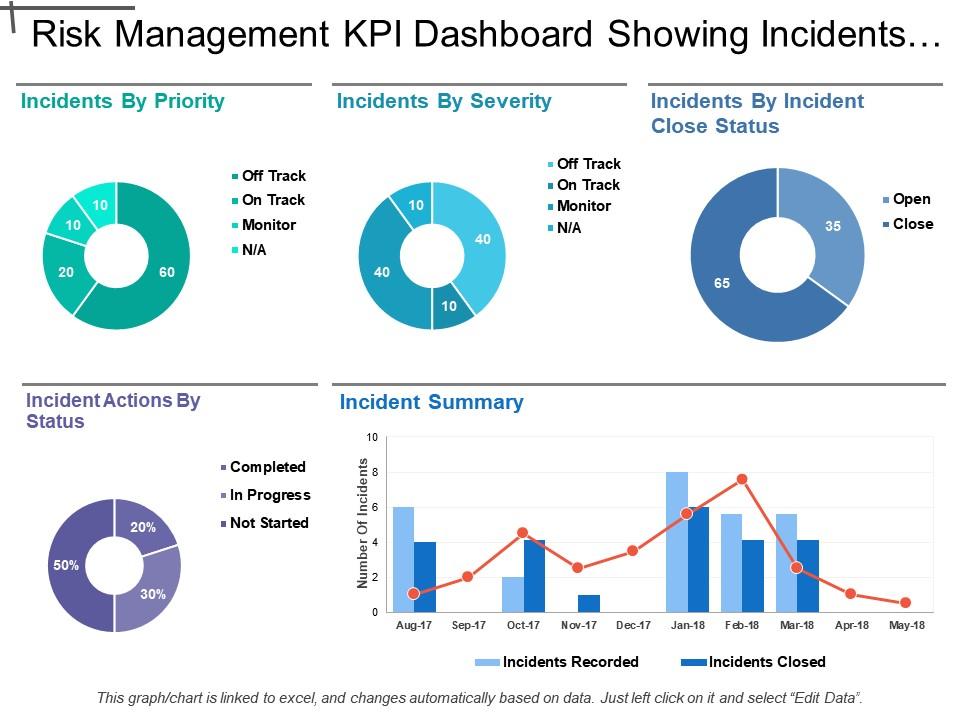
Template 8: Risk Management KPI Dashboard Showing Incidents By Priority And Severity
Managing incidents is critical for effective risk management. Our exclusive PPT Template has a framework that helps address incidents on the basis of priority, severity, and status. It represents the incident summary using an easy-to-understand graph that highlights the number of incidents and the recorded and closed incidents. Get it now.
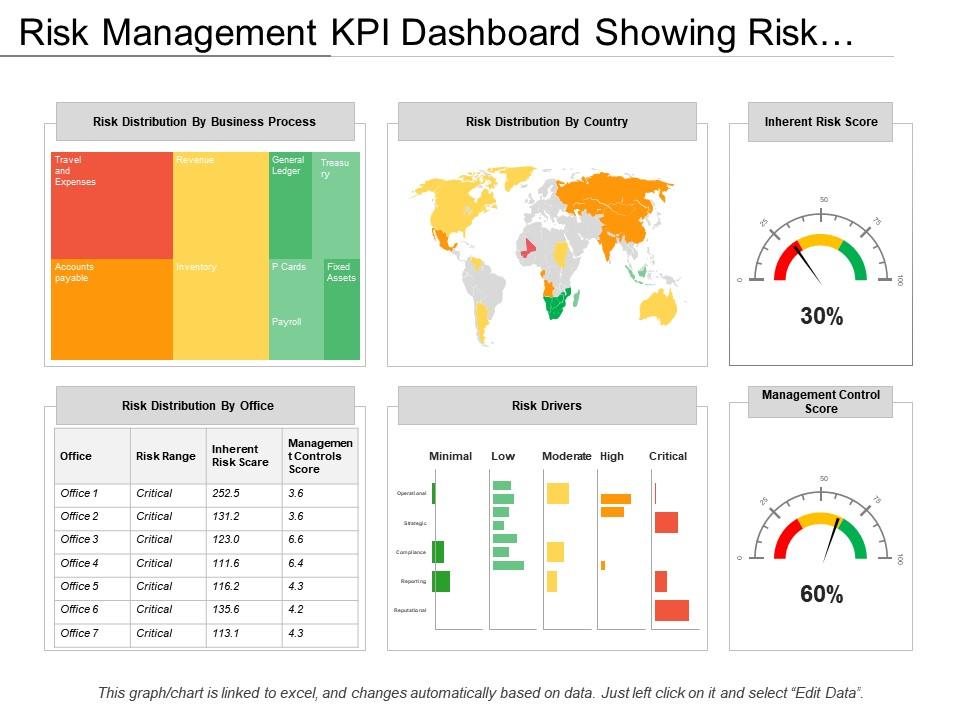
Template 9: Risk Management KPI Dashboard Showing Risk Distribution
Every business is prone to different kinds of risks, which emphasizes the importance of building a framework that addresses each of these. Here’s a PPT Template that aids risk distribution in terms of business processes, country, and office. It also highlights the major risk drivers in your business operations. Download now.
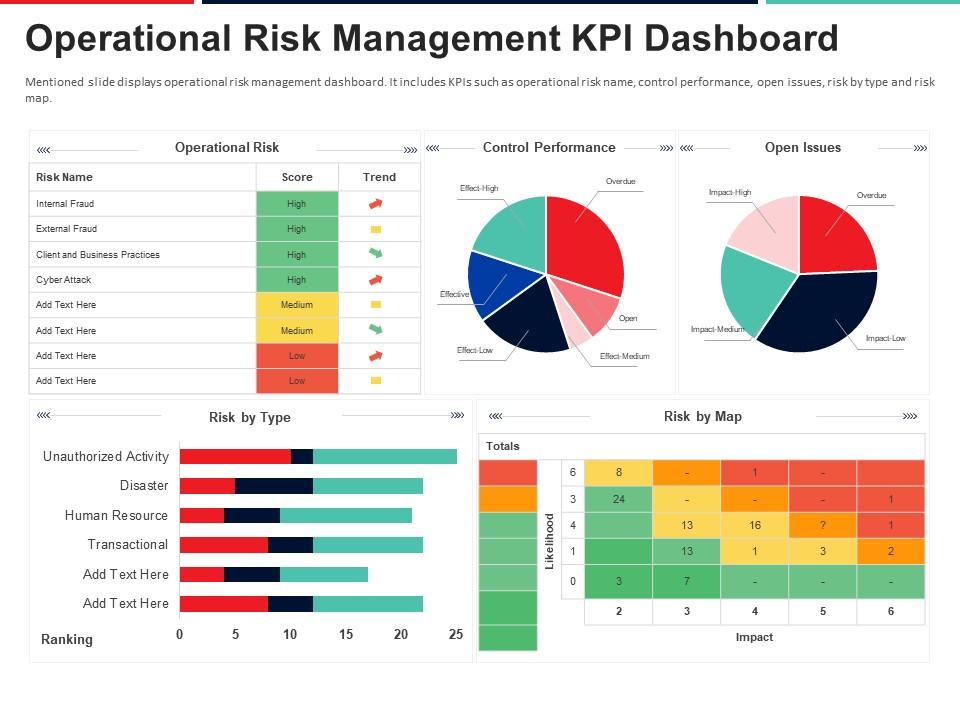
Template 10: Operational Risk Management KPI Dashboard Approach to Mitigate Operational Risk
Introducing our operational risk management PPT Presentation to help you stay afloat and thrive in today’s fierce business landscape. This presentation design has visual aids like pie charts, bar graphs, and heat maps to show the risk data and statistics. Use it to share the types of operational risks along with their trends and score. With the help of pie charts, you can present the controlled vs. open risk incidents data to show the effectiveness of the mitigation strategies. Download it now!
Turn Uncertainty into Opportunity
Taking control of risks is essential to achieving sustainable growth. By utilizing a risk management dashboard, businesses can gain a clearer understanding of their risk exposure and take proactive steps to mitigate potential threats. Investing in a comprehensive risk management system can provide peace of mind and position your organization for success. Download our Risk Management PPT today.
FAQs on Risk Management Dashboard
What are the five components of risk management?
The five typical components of risk management are defined as follows:
- Risk Identification: This involves identifying and documenting potential risks that could affect the organization, its goals, or its stakeholders. It may include reviewing historical data, conducting risk assessments, and engaging with subject matter experts.
- Risk Assessment: This involves analyzing the identified risks to determine their likelihood and potential impact on the organization. Risk assessment may involve qualitative or quantitative analysis and can help prioritize risks based on their significance.
- Risk Mitigation: This involves developing strategies to reduce or control the potential impact of identified risks. Risk mitigation can take various forms, including risk avoidance, transfer, risk reduction, and acceptance.
- Risk Monitoring: This involves ongoing risk-tracking and evaluating risks to ensure that risk mitigation strategies are effective and align with the organization's goals and risk tolerance. Monitoring may involve periodic risk assessments and ongoing analysis of key risk indicators.
- Risk Communication: This involves ensuring that all stakeholders know the risks, their potential impact, and the organization's risk management strategies. Effective risk communication is essential for engaging stakeholders, promoting transparency, and building trust in the organization's risk management processes.
What should be included in a risk dashboard?
A risk dashboard is a tool that provides an at-a-glance view of the most important risks facing an organization. The specific information that should be included in a risk dashboard will depend on the organization's goals, risk appetite, and risk management processes. However, here are some common elements that may be included in a risk dashboard:
- Key risk indicators (KRIs): These are metrics or data points that help in identifying and measuring potential risks. Examples of KRIs include financial data, operational data, or other key performance indicators relevant to the organization's risk profile.
- Risk ratings: This involves a qualitative or quantitative assessment of each risk using a consistent rating system. It helps in risks based on their potential impact and likelihood and can inform risk management strategies.
- Risk mitigation status: This involves tracking the progress of risk mitigation activities, including any outstanding risks, incomplete tasks, and timelines for completion.
- Trend analysis: This involves tracking changes in risk levels over time and identifying any emerging risks or trends that may require attention.
- Risk heat map: This is a visual representation of the organization's risks, showing the relative impact and likelihood of each risk. A risk heat map can help to identify high-priority risks and inform risk management strategies.
- Executive summary: This provides a brief overview of the key risks and risk management activities, highlighting any areas that require attention.




 Customer Reviews

