
Risk Management Kpi Dashboard Showing Open Issues And Control Performance


Try Before you Buy Download Free Sample Product
 Impress Your
 Audience
Editable
of Time


Raise your status with our Risk Management Kpi Dashboard Showing Open Issues And Control Performance. They will always uphold your dignity.
People who downloaded this PowerPoint presentation also viewed the following :
Content of this Powerpoint Presentation
Is setting up a new semiconductor factory in the developed world a risky proposition? When you and I answer this question, it is a different perspective than when a risk professional, whose duty it is to study the risk and take a call, presents their report. In the global business environment today, where wars appear to happen all too frequently, risk professionals face an unprecedented level of scrutiny. Risk managers are not only responsible for protecting and securing their organizations, they also have to provide evidence that their risk management programs are actually effective at managing risk. At the very minimum, risk managers must prove they are meeting the expectations of not only regulators, examiners, and their board of directors, but also customers, investors, fellow employees, and communities.
In the era of the see-through economy, the rapid advancement and proliferation of technologies like social media have left companies with nowhere to hide. We’re living in an age of transparency where the public is empowered to impact a company’s reputation.
Without meaningful metrics, the value of the company’s Enterprise Risk Management program, or the degree to which previously unidentified risks have been mitigated, is unlikely to be demonstrated. Often, risk managers don’t collect the metrics they need and don’t allocate responsibility for information collection and reporting. As a result, risk management teams find themselves drowning in a sea of data they are unable to analyze and glean out meaning. Don’t make that mistake!
How To Measure Risk With KPIs
Most often, the metrics used to evaluate business performance are identified Key Performance Indicators (KPIs). For the top brass, KPIs are quantifiable ways to measure the downsides and upsides of risk for an organization.
KPIs are metrics that evaluate the components of a business deemed crucial for its success, revealing how consistently the company achieves key business objectives. Click here to check out our Project management KPI Templates.
By analyzing KPIs in concert, and over an extended period of time, you will be able to show actual or probable deviations from a given standard or goal. With these risk metrics, you can improve your company’s understanding of just how likely achieving its strategic objectives is going to be.
Manage risks with our content-ready KPI Dashboards. The 100% customizable nature of the template provides you with the desired flexibility to edit your presentations and mitigate risks. The content-ready slide will give you a structure to get started.
Template 1: Risk Management KPI Dashboard Showing Open Issues and Control Performance
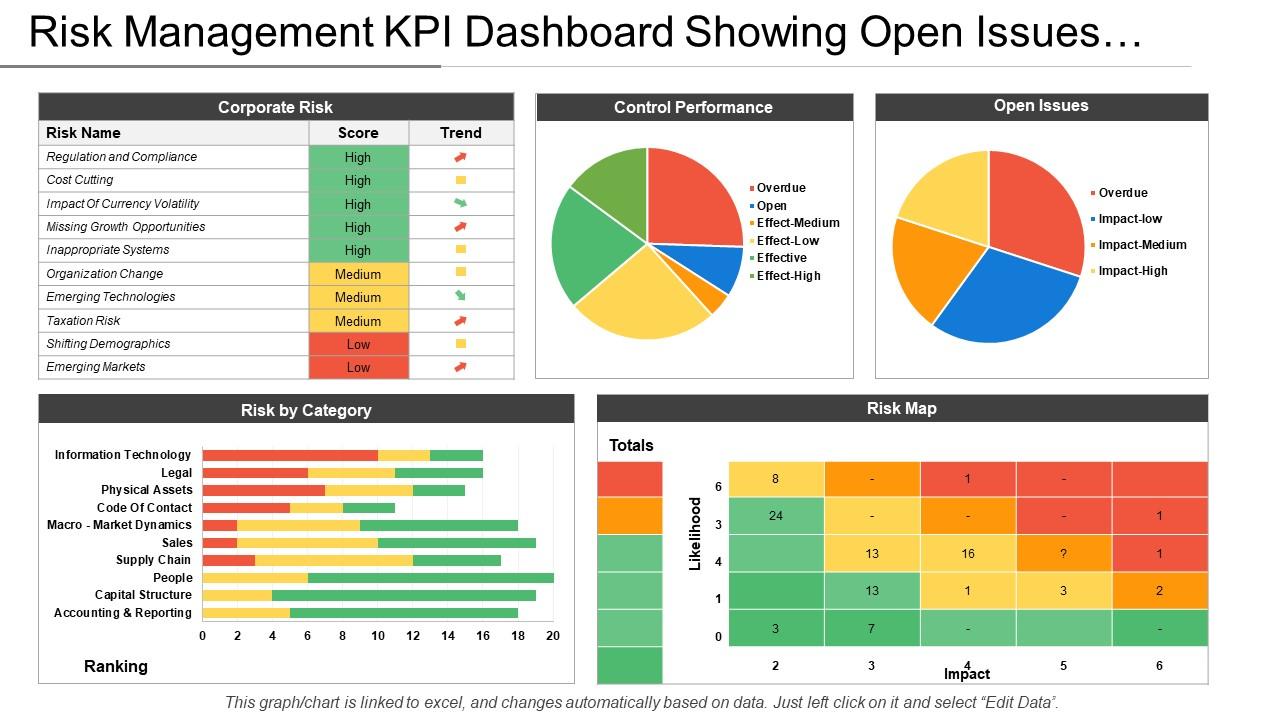
KPIs bring to light critical parts of businesses that need to function at their full potential for the company to meet its objectives. Incorporate this pre-designed PPT Template to monitor business strategies and operations and understand how effective these are in terms of reducing risk. You can add legal, code of conduct, people, supply chain, inappropriate systems, emerging technologies, and other risks in this dashboard and compare them with one another to see which one has more impact on your business, and needs to be addressed first. There are charts in this dashboard that can be used to showcase your data. Besides this, you will also get a risk map that shows the impact of the risk in comparison to its likelihood. Download this dashboard from the link given below.
Keep track, stay risk-free!
By tracking these metrics, organizations are able to mitigate existing risks and detect emerging risks long before they are able to have a detrimental impact on the organization.
You can assess the strength of your own ERM program and create a roadmap for improving performance today with our Risk Maturity Model.
Risk Management Kpi Dashboard Showing Open Issues And Control Performance with all 6 slides:
Capitalise in your abilities with our Risk Management Kpi Dashboard Showing Open Issues And Control Performance. They help you function at your best.


FAQs for Risk Management Kpi Dashboard Showing Open Issues
Honestly, risk management boils down to four things: spot problems before they blow up, figure out how likely and bad they could be, put safeguards in place, then keep watching everything like a hawk. Think of it as professional paranoia - but productive paranoia, you know? Don't let it become some yearly PowerPoint that nobody looks at. You want this stuff baked into how people actually make decisions daily. I'd start simple: write down your worst 5-10 nightmares tomorrow and make someone responsible for each one.
Start with brainstorming sessions - grab people from different departments since they'll catch stuff you'd never think of. SWOT analysis works great for this, or just use a basic risk register to cover internal, external, financial threats, etc. Definitely dig into your old project files too (seriously, most teams ignore this goldmine). Regular stakeholder interviews help a lot. Check industry reports for new risks popping up. Oh, and don't treat this like a one-and-done thing - set up quarterly reviews to stay on top of emerging issues. Makes a huge difference when you catch problems early.
So you've got a few good options here. Risk matrices are your best starting point - just plot probability against impact and boom, you'll see what to tackle first. SWOT analysis is clutch for bigger picture stuff. Technical systems? Go with fault tree analysis. Honestly though, I've watched teams overcomplicate this with expensive software when Excel does the job just fine. Risk registers help you track everything without losing your mind. The real trick is picking something that fits your team's vibe and actually sticking with it instead of abandoning it after two weeks.
Look, the basic framework is pretty much the same everywhere, but what you're actually worried about? Totally different story. Finance people are constantly stressed about credit risks and market swings. Healthcare is all patient safety and staying compliant with regulations. Manufacturing gets crazy complex - supply chains breaking down, equipment failing left and right. Tech companies though, they're paranoid about cyberattacks and data breaches more than anything else. Your risk tolerance changes too, plus how fast you need to react when things go sideways. Honestly, just figure out what's making the C-suite lose sleep in your industry and start there.
Honestly, communication makes or breaks everything in risk management. People need to actually talk to each other - sounds obvious but you'd be shocked how often it doesn't happen. Regular check-ins are huge. Also create spaces where folks can speak up about problems without getting their heads bitten off. I've watched perfectly good plans crumble because someone spotted a red flag but felt weird about mentioning it. Teams end up doing their own thing, missing critical info, making calls with half the story. The fancy risk framework doesn't matter if nobody's sharing what they're seeing.
Honestly, risk frameworks are game-changers for big decisions. You get a clear process to map out what could blow up, how likely that is, and what damage it'd cause. Way better than just winging it (though we've all been there). Your whole team evaluates stuff using the same criteria, which cuts down on those random judgment calls that make no sense later. Plus you'll catch things you probably would've missed otherwise. The consistency thing is huge too - I've seen teams flip-flop on similar decisions because they had no system. Just pick one framework and try it on your next big call.
Look, if your actual losses keep beating your predictions, that's your first clue something's broken. Same goes when risks you thought you had handled keep biting you anyway. Your team shouldn't be putting out fires 24/7 - that's exhausting and means you're missing stuff upfront. Stakeholders losing faith in your assessments? Yeah, that stings but it's valid feedback. I'd also watch for outdated risk registers (we've all been there) and departments not talking to each other about new threats. Oh, and if your mitigation plans aren't actually reducing anything, what's the point? Start by comparing your last six months of incidents to what you originally predicted.
Honestly, AI is a game-changer for risk management. It spots patterns in massive datasets that you'd miss completely doing it by hand. Real-time analysis helps predict failures before they happen and quantifies risks way better than old-school methods. Machine learning gets better over time too, which is honestly pretty impressive. Start small though - pick one specific risk area and nail that first. Clean data is crucial (garbage in, garbage out, right?). The algorithms can automate monitoring and send alerts when something's off. Once you see it working, then expand to other areas.
Honestly, most companies either completely ignore risks or get so freaked out they can't make any decisions. Don't fall into the "set it and forget it" trap - risks shift all the time, so you've got to review stuff regularly. People always focus on the obvious money stuff but miss things like reputation damage or operational headaches. I learned this the hard way at my last job. You need real data, not just going with your gut. The trick is staying aware without getting paralyzed by what-ifs. Start documenting what could go wrong and check it every quarter.
Okay so basically you want risk stuff to be everyday conversation, not some boring quarterly PowerPoint nightmare. Get your leadership to actually talk about what went wrong or almost went wrong in regular meetings. People need to see that it's normal to discuss this stuff. Make reporting problems super easy too - nobody wants to be that person always pointing out issues, you know? I'd skip the big annual training sessions and just weave it into team meetings instead. The key thing is rewarding people who spot problems early. Don't make them feel like troublemakers for speaking up.
Honestly, risk management and compliance are pretty much joined at the hip. Compliance tackles your regulatory risk head-on. Good risk frameworks? They'll naturally spot where regulations kick in and help you build the right controls. Way better to handle them together than separately - learned that the hard way at my last job. Your compliance folks need to chat with risk management regularly since regulatory violations can seriously mess up your business (just another type of risk, really). I'd start by mapping out your main risks against whatever regulations apply to you.
So basically you want to track your KRIs - stuff like how often incidents happen, near-misses, response times. Check if you're actually staying within your risk tolerance levels too. Audit findings tell you a lot honestly - fewer surprises means things are working. I'd compare your loss data year over year to see trends. Oh, and definitely set up some kind of simple dashboard (doesn't have to be fancy) and review it monthly with your team. That way you'll catch issues before they blow up. Works way better than waiting for problems to find you.
Honestly, you've gotta spot your biggest risks upfront and layer your defenses. Don't rely on just one solution - spread your bets around. Build backup plans with clear warning signs for when to pull the trigger, and make sure someone owns each response. Most people skip the testing part though, which is dumb because that's where everything usually breaks down. I'd run practice drills every few months and update your list based on what goes wrong. Oh, and start small - pick your top three scariest risks first and nail those contingencies before moving on.
Honestly, our brains are terrible at judging risk. We freak out about plane crashes but ignore the real killers like heart disease from being sedentary all day. It's wild how we overestimate flashy, memorable dangers while completely missing the statistical ones. Plus we're overconfident idiots who think we control way more than we do. Loss aversion kicks in too - you'll do anything to avoid losing $100 but won't work nearly as hard to gain that same amount. My advice? Don't trust your gut on big decisions. Step back, look at actual numbers first.
Dude, stakeholder engagement seriously transforms how you handle risks. Different people catch things you'd totally miss - customers see operational gaps, suppliers know supply chain weak spots. Community groups? They'll call out reputation issues before they blow up. When people feel included in the process, they actually help instead of fighting your solutions. Map out your key players for each risk area first. Then - and this might sound obvious but people skip it - set up regular check-ins with them. The implementation part is where you'll really see the difference. Trust me on this one.
-
Like
-
like
-
Awsome
-
good manage risk
-
its good and thanks
-
I loved these templates & all business approach!!, I am looking forward to subscribe, Great work LEAN TEAM!
-
Awesome presentation, really professional and easy to edit.
-
Amazing product with appealing content and design.
-
exceptionally informative and relevant