





 0 Comment
 Customer Reviews

You know what’s scarier than a data breach? Not knowing it happened until your CEO reads about it on Twitter.
Security risks aren’t just lurking in dark corners of the internet—they’re often hiding in plain sight on your own network, waiting for someone to misconfigure one setting or skip one update. The real tragedy is that most organizations don’t lack data, they simply lack visibility.
That’s where Security Risk Dashboards step in as survival tools. They consolidate critical security indicators like threat levels, vulnerabilities, incident response times, and access violations into one central view.
And when your CISO or board demands answers, SlideTeam’s Security Risk Dashboard Templates help you present those answers with clarity and impact. These professional, 100% editable PowerPoint decks let you track real-time metrics and convey risk posture in a language that even the least tech-savvy executives can’t ignore.
Let’s explore the templates that help you spot the threat before the threat spots you.
Access SlideTeam’s best-in-class Information Security Dashboard Templates with a click here.
Template 1: Global Cyber Security or Critical Risk Dashboard PPT
This PowerPoint Set provides a strategic overview of the contemporary cyber threats and risk management practices. It addresses important areas like threat analysis, incident response, compliance, employee training, and risk assessment techniques. The deck emphasizes the necessity of cybersecurity metrics and frameworks, including NIST, ISO 27001, CIS Controls, and GDPR. It presents methods to detect critical risk indicators, data breach analysis, and response implementation strategies. The presentation is an excellent resource for cybersecurity professionals and analysts to provide a practical guide to securing the digital infrastructure in an ever-changing threat environment.
[product_image id=1470164]
Template 2: Security Dashboard PPT
This is an all-inclusive Security Dashboard PowerPoint Template that offers a summary of cyber risk, threat intelligence, and application vulnerability in both the IT and cloud settings. It shows real-time data on the type of threats, the level of risks, user warnings, compliance, and shadow IT activity. The slides present charts and performance indicators that facilitate monitoring, response, and decision-making. This presentation is ideal for CISOs, IT security teams, and compliance officers, who can simplify complex security data into visual summaries that indicate risks and direct strategic actions. It is an essential instrument for demonstrating cybersecurity positioning in business environments.
[product_image id=551631]
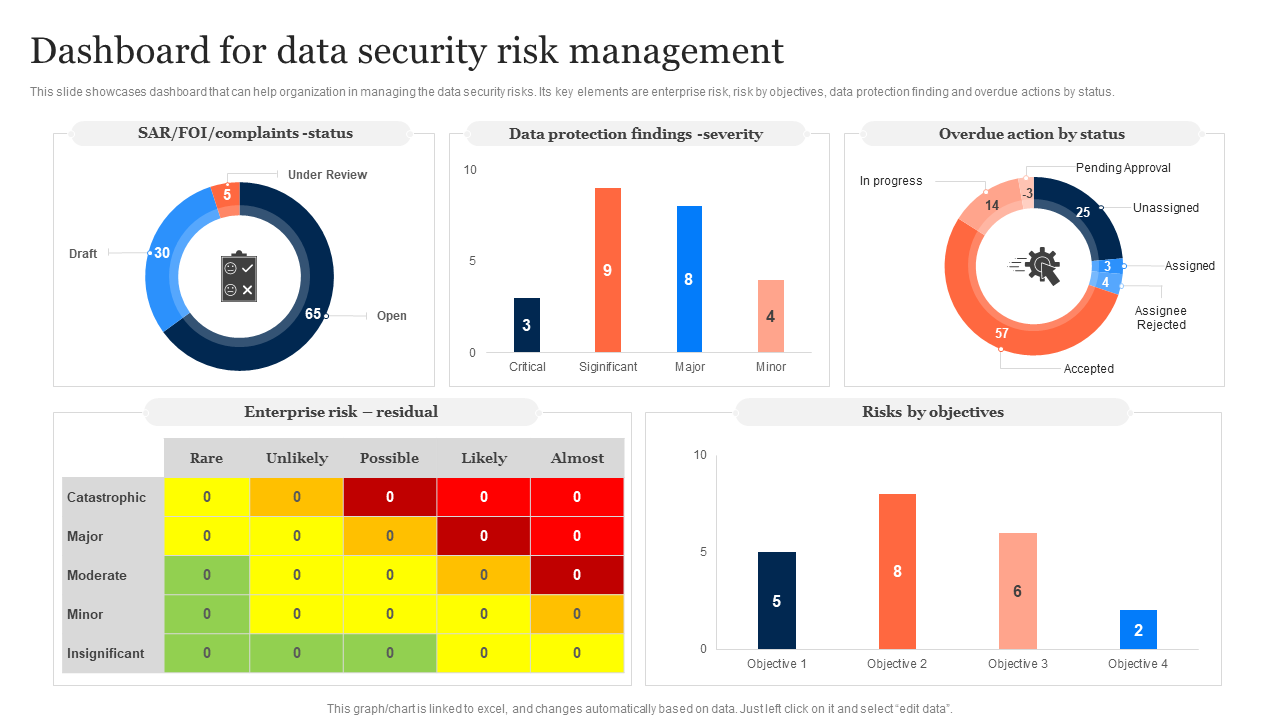
Template 3: Dashboard for Data Security Risk Management
This PPT Dashboard on data security risk management provides a unified picture of the most important risk indicators that can be used in the management of an organization. It charts SAR/FOI complaint status, data protection findings by severity, and overdue actions by resolution status. It also identifies the level of enterprise risks with the help of a residual risk matrix and plots the risks against certain business objectives. This dashboard will enable stakeholders to see the compliance, focus on risk mitigation, and keep an eye on pending approvals and rejected actions with intuitive charts and actionable insights. The slide is perfect to be used by compliance officers and IT risk managers to turn the complicated security data into a decision-ready format at the enterprise level of governance.
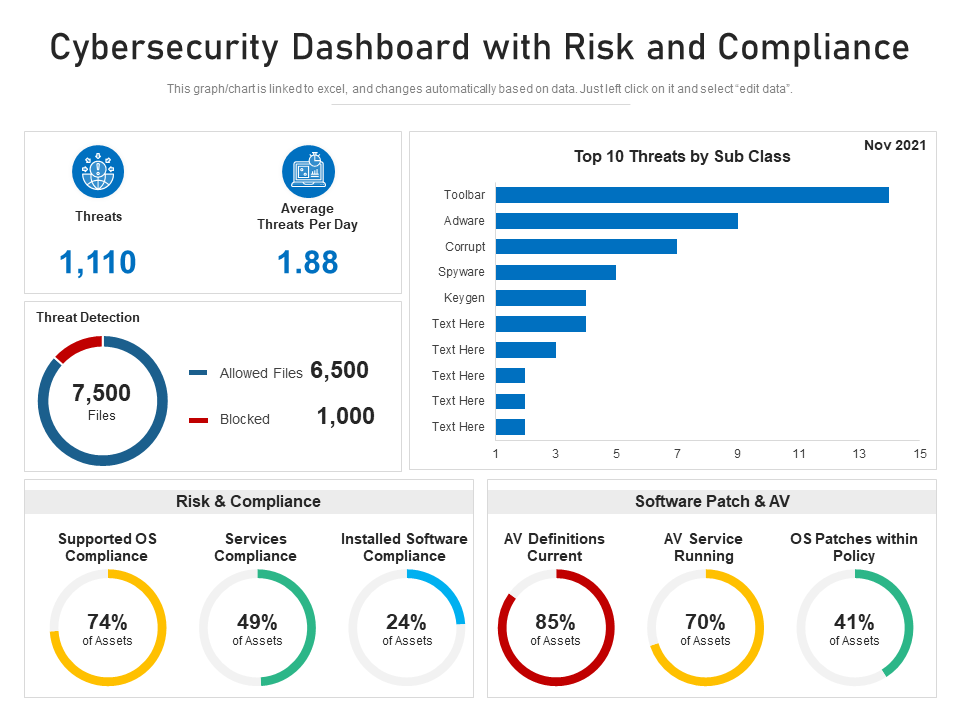
Template 4: Cybersecurity Dashboard with Risk and Compliance PPT
This PPT Slide offers a complete picture of risk and compliance measurements, which enables organizations to track the level of threats and keep the systems intact. It shows cumulative threats, average of threats daily, and the detailed threat detection statistics, including the allowed and blocked files. A list of top threats is divided into the most common types of attacks. The dashboard also discusses compliance on OS, services, and software installations and assesses the patch management and antivirus status. Having explicit percentages on AV definitions, service uptime, and patch compliance, this tool provides IT and security teams with practical information to optimize threat response, enhance compliance, and strengthen overall cybersecurity positioning.
Template 5: Risk Management Dashboard for Information Security PPT
This PPT Set provides a holistic view of the key metrics that should be monitored and mitigated to reduce cyber risks. It shows the percentage and number of risks that are above the threshold, the progress of risk analysis, and the response rate. The visuals are a risk rating breakdown, detailed heat map, and plan distribution of actions by implemented, planned, deferred, and TBD statuses. It also shows the five most critical vulnerabilities, such as physical security holes and over-provisioned user rights, and the most urgent risks. This dashboard can make organizations prioritize threats, handle vulnerabilities, and address information security concerns in a timely manner due to clear data visualization.

Template 6: Information Security Dashboard PPT
This PowerPoint Deck provides an overview of the performance and risk management of cybersecurity. It has comprehensive dashboards of threats, vulnerabilities, breach incidents, risk heat maps, open incidents, and compliance metrics. The slides provide real-time information on the classification of threats, penetration testing, control effectiveness, and sources of attacks. This presentation assists organizations in monitoring their performance, tracking risk response, and assessing security resilience with visual information about alerts, incident aging, and security control status. The PPT can be used to report to the CISO, IT audit, or board update, and it allows making informed decisions and shows active governance of digital infrastructure protection.
[product_image id=856648]
Template 7: Cyber Threat Dashboard with Current Risks and Security Service
This PowerPoint Preset provides an in-depth picture of the cybersecurity status of an organization by displaying important metrics on current threats, risks, and policy coverage. It displays the level of threat severity, risk classification, and the degree of regulatory compliance, and also demonstrates the asset control problems and classification by system, facility, and application. Other findings are the condition of security services and the vulnerabilities that were detected in asset control.

Template 8: Dashboard for Data Security Risk Management PPT
This PPT dashboard on Data Security Risk Management includes the major indicators of risks and response measures. It contains a visualization of SAR/FOI/complaints status, severity of data protection findings, and overdue action tracking by status. Other parts describe enterprise residual risk mapping in a heat matrix and risk classification according to business objectives. It is intended to help compliance officers and data protection teams identify gaps, prioritize actions, and stay in line with regulations. It allows organizations to remain proactive in their risk mitigation efforts and ensures that data governance and security standards are achieved at every touchpoint of their operations.

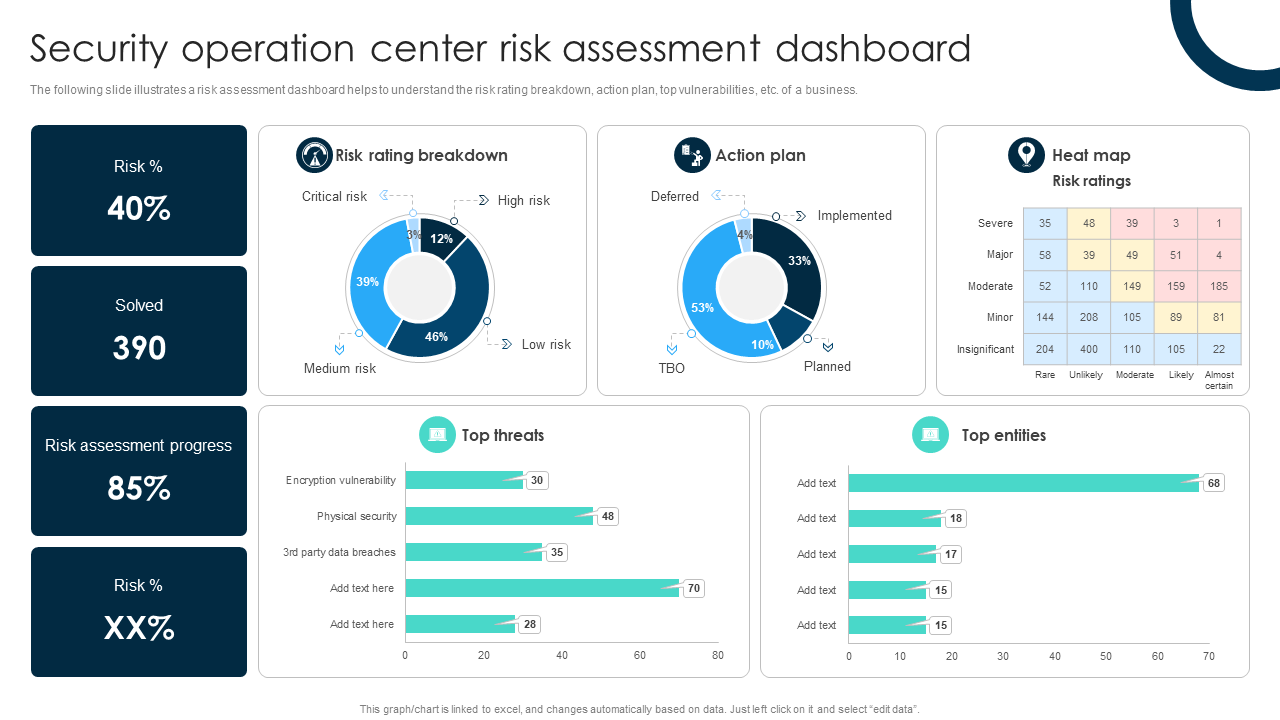
Template 9: Security Operation Center Risk Assessment Dashboard PPT
This PPT Framework offers a graphical representation of the cybersecurity status of an organization. It points out important metrics like 40 percent risk rate, 85 percent risk assessment progress, and 390 risks addressed. The slide categorizes risk ratings into critical, high, medium, and low and shows action plan statuses as implemented, planned, and deferred. A risk heat map by severity and likelihood is used to aid analysis. Also, the dashboard highlights the most dangerous threats, such as encryption vulnerabilities and 3rd party breaches, and the entities that are affected. This slide is ideal to use by SOC teams to prioritize mitigation efforts and increase situational awareness.
Template 10: Security Dashboard to Identify the Risk of Application PPT
This Security Dashboard detects application-related risks in 150 applications and 6,500 users. It displays the most important metrics, including 9.5 TB of traffic, 3,861 IPS events, and 22 open cloud alerts. The dashboard segregates identified apps into sanctioned, unsanctioned, or other, and monitors their use based on data volume. The risk levels are categorized by user activity on the high, medium, or low-risk apps, and 950 users were marked as high risk. Other insights are app categories based on GB usage, top users based on traffic, and distribution of app headquarters around the world. This tool allows making informed security decisions by visualizing the behavior of apps and risks.

Because “We’ll Handle it When It Happens” Isn’t a Plan
Hope is not a cybersecurity strategy. If your idea of risk management is reacting after the fact, you’re already late and hackers love that!
Security Risk Dashboards aren’t optional—they’re your early warning system, your accountability mirror, and your best shot at staying ahead of chaos. With threats evolving by the hour, you need visibility, clarity, and a reporting format that doesn’t put your board to sleep.
That’s where SlideTeam’s templates come in—smartly designed, fully editable, and built to surface exactly what matters. So, instead of scrambling after the breach, start leading before it happens.
Download your dashboard now—and turn risk from a surprise into a strategy.
FAQs on Security Dashboards
1. What is a Security Risk Dashboard?
A security risk dashboard delivers, analyzes, and displays real-time threat intelligence across your organization. It alerts you immediately to any vulnerabilities and provides recommendations and mitigation strategies. A security risk dashboard provides a centralized view of an organization's cybersecurity posture. It aggregates data from various security sources and presents it in an easy-to-understand format, allowing for quick identification of potential threats and areas for improvement.
2. Why is a Security Risk Dashboard important for cybersecurity management?
Security risk dashboards give you continuous access to real-time aggregated data from various security tools and systems. This constant vigilance allows security teams to stay ahead of emerging threats and vulnerabilities. The holistic view of your organization’s cybersecurity landscape enables security professionals to monitor network activity, system health, and potential vulnerabilities. Thanks to the broad perspective, they can identify and address security gaps even before they become a problem.
3. How does a Security Risk Dashboard work?
Security Risk Dashboard is a single point of view that offers a visual representation of the security position of an organization by combining data from multiple sources and displaying it in an easy-to-comprehend manner. This enables proactive risk management as security teams can easily spot possible threats, vulnerabilities, and areas that require improvement.


