


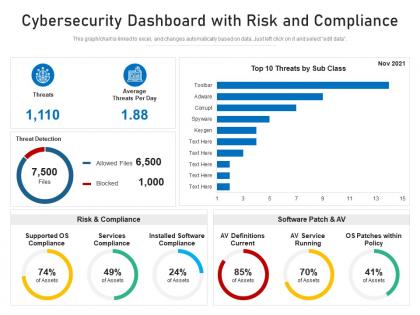
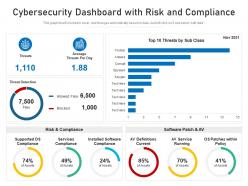
Cybersecurity dashboard with risk and compliance




Try Before you Buy Download Free Sample Product
 Impress Your
 Audience
 100%
100% Editable
 Save Hours
 of Time


Our Cybersecurity Dashboard With Risk And Compliance are topically designed to provide an attractive backdrop to any subject. Use them to look like a presentation pro.
People who downloaded this PowerPoint presentation also viewed the following :
Cybersecurity dashboard with risk and compliance with all 2 slides:
Use our Cybersecurity Dashboard With Risk And Compliance to effectively help you save your valuable time. They are readymade to fit into any presentation structure.
FAQs for Cybersecurity dashboard with
For your cybersecurity dashboard, start with threat detection rates and incident response times - those are huge. Track vulnerability counts but separate critical from low-risk ones. Don't forget failed login attempts and patch management status, they're actually pretty telling about where you stand security-wise. Oh, and system uptime plus security training completion rates. Mix real-time alerts with trend data so you'll catch both immediate stuff and patterns over time. Keep it visual, not just a wall of numbers. Honestly I'd start with maybe 5-7 metrics and build from there.
Think of it like a security control center for your whole network. Instead of checking 15 different tools (ugh), everything's in one spot. You'll see vulnerabilities, incident patterns, which systems are getting hammered - all real-time. Honestly, the visual setup makes spotting threats way easier than staring at logs all day. Plus when your boss asks "how secure are we?" you've got actual charts and data instead of just going "um, pretty secure I think?" Great for getting budget approval too since you can show exactly where the money needs to go.
Honestly, visualizations are a game-changer for security work. You'll spot patterns in seconds that would take hours scrolling through raw logs. Heat maps and timeline charts make anomalies pop right out at you. Plus, when you need to explain threats to management or other teams, charts work way better than dumping technical data on them. I'd start with basic visualizations for whatever metrics your team checks daily - maybe network traffic flows or alert volumes. The goal is making your brain work smarter, not harder, when hunting threats.
Honestly, I'd go with 5-15 minutes for the really critical stuff - active threats, system alerts, that kind of thing. Real-time is obviously best if you can swing it. Once you hit 30 minutes though, everything feels way too outdated when you're potentially dealing with a breach. For the boring compliance reports and trend stuff, hourly or daily works totally fine. I always tell people to start around 15 minutes and see how it feels. Your team will figure out pretty quick if that's too much or not enough based on how fast things can go sideways in your setup.
Look, simple is everything here. Put your critical alerts right at the top - nobody wants to dig through a mess when there's an actual breach going down. Color code it (red = oh shit, yellow = pay attention) and make the urgent stuff pop immediately. I swear, half the dashboards I see look like slot machines with all the blinking. Skip the vanity metrics. Group similar info together and focus on what your team can actually act on. Test it with real users first - they'll tell you if it sucks. Just ask your team what they need to see when they grab their morning coffee.
Dude, automation is a game-changer for cybersecurity dashboards. It handles all the boring correlation work between different alert sources and filters out those annoying false positives. Real threats get escalated automatically based on whatever rules you configure. Your threat intel feeds stay current without you babysitting them - honestly such a relief because doing that stuff by hand is mind-numbing. Incident response workflows can even start containing threats before you're fully awake. Bottom line: less time gathering data, more time actually analyzing what matters. I'd start with whatever manual task currently makes you want to scream.
Get your security tools streaming data directly into the dashboard - SIEM, firewalls, endpoint stuff, all of it. Real-time is everything here. Set up alerts that actually fire when your thresholds get hit, and make sure you've got visual timelines that update instantly. I can't tell you how many "dashboards" I've seen that look nice but refresh every 15 minutes... completely pointless for live threats. Response workflows should be baked right in so your analysts don't have to jump between different platforms. Oh, and test your lag time - anything over 30 seconds between the actual event and seeing it on screen is too slow.
Start with your SIEM logs and firewall data - that's your bread and butter right there. Intrusion detection systems and vuln scanners are next. Network monitoring is probably the most underrated tool for catching weird stuff honestly. Oh, and don't sleep on endpoint protection feeds. Threat intel can automatically flag sketchy actors which is clutch. Your identity management and cloud security platforms should definitely make the list too. But here's the thing - pick like 3 or 4 sources max to start. You can bolt on more later once everything's actually working properly instead of creating a mess.
Just figure out what each person actually needs to see first. Your CISO wants the big picture stuff - risk scores, compliance status. SOC teams live in real-time alerts and incident queues. Finance cares about costs and security tool budgets (obviously). IT ops? Vulnerability counts and patch tracking. Most platforms let you set permissions so people only see their slice - honestly saves everyone from drowning in useless data. I'd start by asking each team what decisions they make daily, then build dashboards around those specific needs. Way more useful than one massive dashboard nobody can navigate.
Oh man, the worst part is when you're pulling data from like 5 different sources - SIEM tools, network monitors, vulnerability scanners - and none of them format stuff the same way. Real-time feeds constantly break or lag too, which is infuriating when you're hunting for actual threats. People also mess with queries without thinking about what breaks downstream. I swear, half my job is just fixing things other people accidentally touched. Set up automated validation checks though, that'll save your sanity. Change management processes help too, even if they feel annoying at first.
So your cybersecurity dashboard can actually get way smarter with AI and ML. Right now it's probably just showing you what already happened, but these tools spot weird patterns humans miss - like tiny behavior changes before an attack hits. They'll filter out the noise and highlight alerts that actually need attention. Honestly, the false positive reduction alone is worth it. Plus they keep learning your environment, so they get better over time. Oh, and they can predict vulnerabilities before hackers find them. Just turn on whatever ML features your current dashboard has first.
So basically a cybersecurity dashboard gives you this real-time view of everything happening with your data and security stuff. Super helpful for compliance because you can track who's accessing what and spot breaches right away. GDPR becomes way less stressful - you'll actually hit those crazy 72-hour notification deadlines instead of scrambling around. Same thing with HIPAA since all your audit trails are right there. Honestly, the automated alerts are probably the best part because who has time to manually check everything? Just set it up once and let it catch the weird activity for you.
Honestly, it depends on your budget and what you're already using. Splunk and Elastic are amazing for log analysis but they'll cost you. Grafana with Prometheus is way cheaper and looks clean too. If you're already deep in Microsoft or IBM stuff, Sentinel and QRadar make sense. Even Power BI works if you're pulling from existing tools. Oh, and Tableau's an option too - though I always forget about it for security dashboards for some reason. Start by figuring out what data sources you need to connect, then pick whatever plays nicest with your current setup. That'll save you headaches later.
Start with the big picture stuff on your main dashboard - execs just want to know if things are good or bad at a glance. Then build in drill-down options for when your security team needs to dig deeper. Honestly, I've seen so many dashboards that are just data vomit everywhere. Color coding works great for quick status checks. Short sentences for overview stuff, but make sure people can click through to get all the nitty-gritty details when they're actually investigating something. Kind of like how news works - give me the headline first, worry about specifics later.
Your team definitely needs the cybersecurity basics down first - malware, phishing, network stuff. Log reading and alert priorities are huge too. Honestly, data visualization is pretty clutch because those dashboards can look like a hot mess with all the charts flying around. Train them on your actual tools though, not just generic stuff. I'd skip the boring lectures and do hands-on workshops instead - throw real scenarios at them. Start simple and don't dump everything on them at once. Nobody learns well when they're drowning in info from day one.
-
Graphics are very appealing to eyes.