


Threat vulnerability dashboard information security risk management program


Try Before you Buy Download Free Sample Product
 Impress Your
 Audience
Editable
of Time


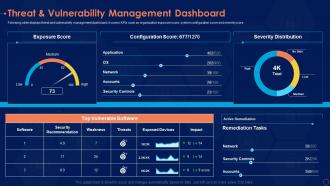
Following slide displays threat and vulnerability management dashboard. It covers KPIs such as organization exposure score, system configuration score and severity score.
People who downloaded this PowerPoint presentation also viewed the following :
Threat vulnerability dashboard information security risk management program with all 2 slides:
Use our Threat Vulnerability Dashboard Information Security Risk Management Program to effectively help you save your valuable time. They are readymade to fit into any presentation structure.
FAQs for Threat vulnerability dashboard information security
Track vulnerability counts by severity first - that's your bread and butter. How fast you're patching stuff (mean time to patch) matters way more than most people think. Also look at how old your vulnerabilities are getting because those ancient ones always come back to haunt you. Asset coverage shows if you're actually seeing your whole network or just pieces of it. Honestly, remediation rates and trend analysis over time are pretty critical too. Oh, and separate your business-critical stuff from everything else - leadership loves that context. Start simple with these, then build out based on what your boss actually asks about.
Look at CVSS scores first, but don't just stop there. Asset criticality matters way more than most people realize - like, a medium vuln on your main database is gonna wreck you harder than some high-severity thing on a random dev box. Focus on critical and high-severity stuff hitting your important systems first. Those are your actual emergencies. Your dashboard should let you sort by combined risk, not just severity alone. Honestly, I'd set up alerts for the worst combinations so you're not drowning in manual reviews all day. Oh, and check if there's active exploit activity too.
Yeah, real-time data is a game changer for threat dashboards. Without it, you're basically fighting yesterday's war while attackers are already three steps ahead. Live feeds help you catch emerging threats as they pop up and prioritize what actually matters right now. The tricky part? Making sure your sources are truly real-time, not just "close enough" updates that still leave gaps. I've seen too many teams think they're covered when they're actually running on 15-minute delays. Short bursts matter when you're trying to stop something before it spreads through your whole network.
Look, nobody wants to stare at spreadsheets full of CVE numbers - that stuff just makes people's eyes glaze over. Heat maps and trend charts actually work because execs can see the big picture instantly. Red/yellow/green indicators are your best friend here. I'd focus on building dashboards that show vulnerability trends over time, not just current issues (way more compelling). A solid visual beats endless PowerPoint slides every time. The trick is making it tell a story - where you've been, what's broken now, and what needs fixing next. Trust me, colorful risk matrices get way more attention than technical reports.
Honestly, the worst part is getting all your tools to play nice together. Each scanner spits out data in its own weird format, so you're constantly translating between them. Volume becomes insane too - real-time processing will crush your systems if you're not careful. Duplicate alerts everywhere since Tool A finds the same vuln as Tool B but calls it something else. Prioritization gets messy because everything ranks threats differently. I learned this the hard way, but seriously start with just 2-3 sources first. Get those dialed in before adding more chaos to the mix.
So ML is actually pretty sick for catching threats - it can crunch through way more data than any human team could handle. Your system gets better at spotting weird patterns between different vulnerabilities, plus it learns from each new attack it sees. The false positive thing is huge too, honestly. Instead of chasing down every random alert, ML understands context better so you're only dealing with real threats. I'd probably start with anomaly detection in whatever dashboard you're using now. Oh and it can predict new threats based on old attack patterns, which is wild when you think about it.
NIST Cybersecurity Framework is honestly your best starting point - covers all the basics like identify, protect, detect, respond, recover. OWASP's got solid web app vulnerability guides if that applies to you. ISO 27001 might be overkill unless you really need it (that thing's massive). MITRE ATT&CK is pretty cool for threat intelligence stuff - helps you actually understand what your vuln data means. But here's the thing: don't just pile on frameworks because they sound impressive. Pick what fits your org's actual maturity level and compliance needs. I'd go NIST + OWASP first, then add more later.
Daily updates are your sweet spot, but real-time is even better if you can pull it off. New vulnerabilities drop constantly and attack methods change overnight - it's honestly wild how fast things move. Most companies do fine with daily operational updates, weekly for the big picture stuff. Critical infrastructure though? Real-time isn't negotiable. Set up automated feeds from your scanners and threat intel so you're not stuck doing manual updates all day. Trust me, catching emerging threats early beats scrambling when they're already hitting your systems.
Figure out who actually needs to see this stuff first. Security team, IT ops, dev teams, plus the executives who control the money. I usually think about it like - who's gonna panic if we get hacked? Those are your main people. Executives just want the big picture and trends, but your security analysts need all the nitty-gritty details and how to fix things. Oh, and compliance teams if you're in banking or whatever. Set up different views so each group only sees their relevant info. Nobody wants to dig through a bunch of irrelevant data.
Your vulnerability dashboard becomes way more powerful when you actually connect it to other tools. SIEM integration means threat intel updates risk scores automatically. Ticketing systems create workflows so vulns become actual tickets people work on. Patch management syncs so you're not manually tracking what got fixed where - honestly such a time saver. You'll stop jumping between a million different screens just to figure out what's happening. The trick is choosing integrations that fit how your team already works, not whatever the sales guy pitched as "game-changing."
Honestly, Splunk SOAR and IBM QRadar are probably your best bets if you've got the budget. Microsoft Sentinel works great too, especially if you're already using their stuff. For vulnerability stuff specifically, check out Rapid7 InsightVM or Tenable.io - both are pretty solid. MISP is decent if you want to go open-source, but fair warning, it's a pain to set up. The real trick though? Make sure whatever you pick actually plays nice with your current tools. I've seen too many teams get stuck with fancy dashboards that don't actually help them move faster when shit hits the fan.
Just talk to your users directly - surveys, those little feedback widgets in the app, whatever works. Ask specific stuff like which metrics actually matter to them and what's confusing as hell. Monthly feedback sessions are golden if you actually act on what people say. I've watched dashboards get way better once teams realized users were totally ignoring half the data because none of it was actionable. Even tiny changes help - reordering widgets, tweaking colors, that kind of thing. Oh, and definitely start with your top power users. They'll tell you exactly what's broken since they're stuck using it all day.
Data residency laws are a real pain - some countries won't let security data leave their borders, so you might need separate dashboard instances per region. GDPR's super strict about this too. Watch out for personal info sneaking into vulnerability descriptions, even IP addresses count as personal data now. Role-based access gets tricky when geography matters - someone in Germany might not be able to see US server data. Geographic access controls and audit logs are way easier to build upfront than bolt on later. Trust me on that one.
Dude, this thing is seriously a game-changer for those painful board meetings. Instead of drowning executives in CVE numbers that nobody understands, you're showing them clean risk scores and trend charts they can actually follow. Business impact summaries hit way harder than technical jargon too. I swear, leadership finally gets why certain vulns matter when you frame it around potential revenue loss or downtime. The executive summary view keeps everyone on track - though honestly, some of these board members still zone out no matter how you present it. Bottom line: you'll look like a hero demonstrating how your team's work is actually reducing risk over time.
Basic dashboards just show vulnerability counts and severity levels - pretty simple stuff. Advanced ones? Way more useful. You get risk scoring, threat intelligence, and automated prioritization that actually saves your sanity. They track progress over time and connect vulnerabilities to real threat activity, which is honestly game-changing. The automation alone keeps you from drowning in alerts - I've seen people waste weeks manually sorting that stuff. Complex environments definitely need the advanced features, especially for compliance headaches. But if you're running something smaller, basic probably works fine.
-
Awesome use of colors and designs in product templates.
-
Excellent template with unique design.
-
Understandable and informative presentation.